0164
Diffusion MRI in the unfolded hippocampus1Centre for Functional and Metabolic Mapping, Robarts Research Institute, Western University, London, ON, Canada, 2Neuroscience Graduate Program, Western University, London, ON, Canada, 3The Brain and Mind Institute, Western University, London, ON, Canada, 4Department of Medical Biophysics, Schulich School of Medicine and Dentistry, Western University, London, ON, Canada, 5School of Biomedical Engineering, Western University, London, ON, Canada
Synopsis
The hippocampus is of high interest to the research community due to its involvement in many neurological disorders. However, in-vivo imaging, particularly diffusion weighted imaging, is challenging due to the hippocampus’ complicated curved geometry and small size. We address these challenges with an approach that ‘unfolds’ the hippocampus into a thin sheet. This allows migration of the diffusion data into this unfolded hippocampus, which enables visualization of microstructural sensitive diffusion parameters in a space where hippocampal subfields can be readily distinguished.
Introduction
The hippocampus is implicated in numerous neurological disorders, including temporal lobe epilepsy (TLE) and Alzheimer’s disease (AD), and the ability to detect subtle or focal hippocampal abnormalities earlier could significantly improve the treatment of patients. Ex vivo studies with ultra-high field have revealed that diffusion MRI (dMRI) can reveal microstructural variations within the hippocampal subfields and lamina, and may also be sensitive to intra-hippocampal pathways 1. However, in vivo dMRI studies of the hippocampus are challenging due to its complicated geometry. In addition to its small size, the hippocampus, similar to the cortex, shows gyrification (or digitations) across its structure. Further, the hippocampus has a curled or folded configuration. One novel way to overcome these obstacles is by transforming the usual cartesian coordinates in a MRI image to coordinates that are mathematically crafted to curve themselves according to the complicated geometry of the hippocampus 2. This allows us to virtually flatten the hippocampus into a thin sheet. A particularly unique aspect of our proposed approach is to project the diffusion data onto this sheet, carefully adjusting the diffusion directions from the original acquisition to be compatible with the sheet.Methods
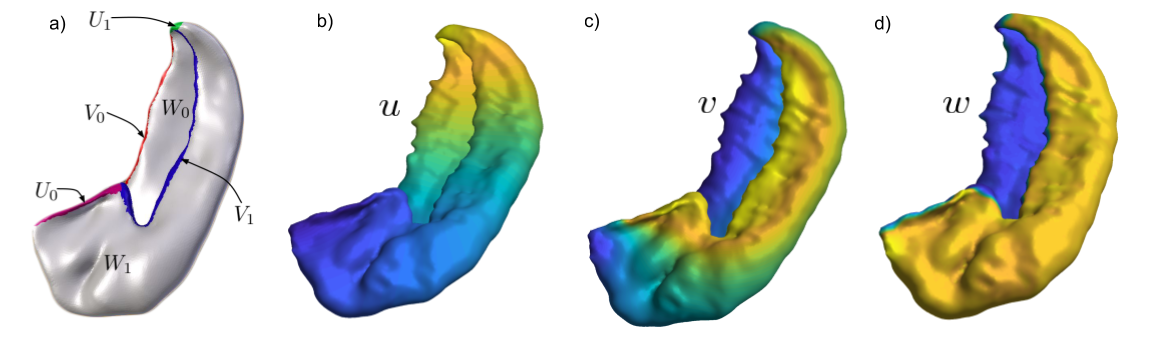
We used data from four participants in the Human Connectome Project (HCP) Young Adult 3T study 3. We begin by a manual segmentation of both hippocampi. This is followed by solving Laplace’s equation, $$$\nabla^2 \phi =0$$$, in 3-dimensions on the underlying cartesian grid with coordinates $$$x,y$$$ and $$$z$$$ native to the MRI scan; denoted the ‘native space’. The Laplace’s equation is solved three times to provide three new anatomical coordinates $$$u, v$$$ and $$$w$$$, using boundary conditions as depicted in Figure 1a. The resulting coordinate fields are shown in Figure 1b,c,d, where bright yellow is 1 and dark blue is 0. Next, we reparameterize the new coordinates with the arc length. At this stage we can ‘unfold’ the hippocampus by going in to the domain of the new coordinates, the ‘unfolded space’. The coordinate fields $$$u(x,y,z)$$$, $$$v(x,y,z)$$$ and $$$w(x,y,z)$$$ allow us to map data from the native space to the unfolded space. The novel contribution in this work is to also map vector data to the unfolded space, which is essential for properly handling diffusion gradient directions. We use the Jacobian to correctly ‘push’ the diffusion directions and corresponding signal intensities to the the unfolded space. This allows us to generate a diffusion-weighted volume, resampled in the unfolded space, with the Jacobian encoding the unfolding transformation. Several existing tools for fitting already can make use of a Jacobian to account for gradient non-linearities (e.g. FSL FDT 4), and thus can be used directly for fitting and tractography in the unfolded space. We utilized the inherent correspondence across subjects in the unfolded space to define subfield labels in our participants using average labels defined previously at 7T2. We used these to perform probabilistic tractography (FSL PROBTRACKX 5), all voxels were taken as seeds tagged with the subfield they belong to and 5000 samples were used.Results
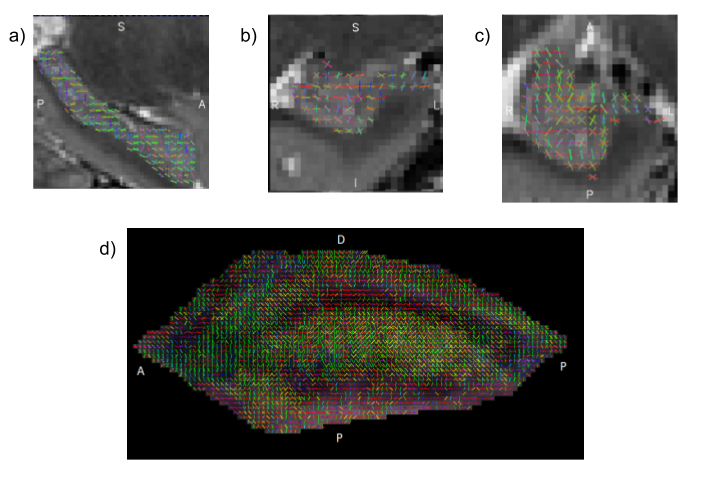
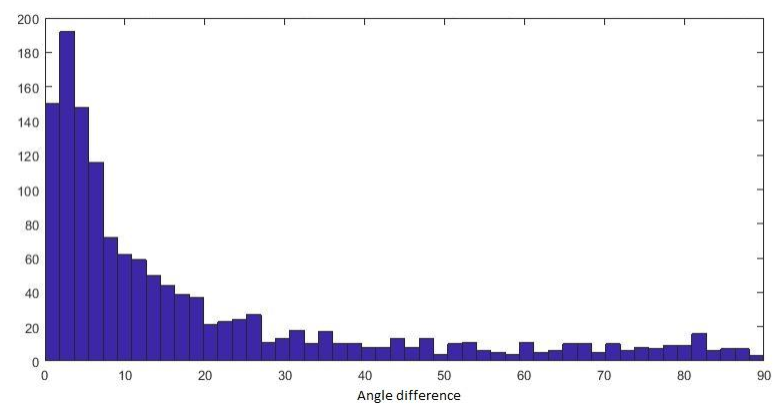
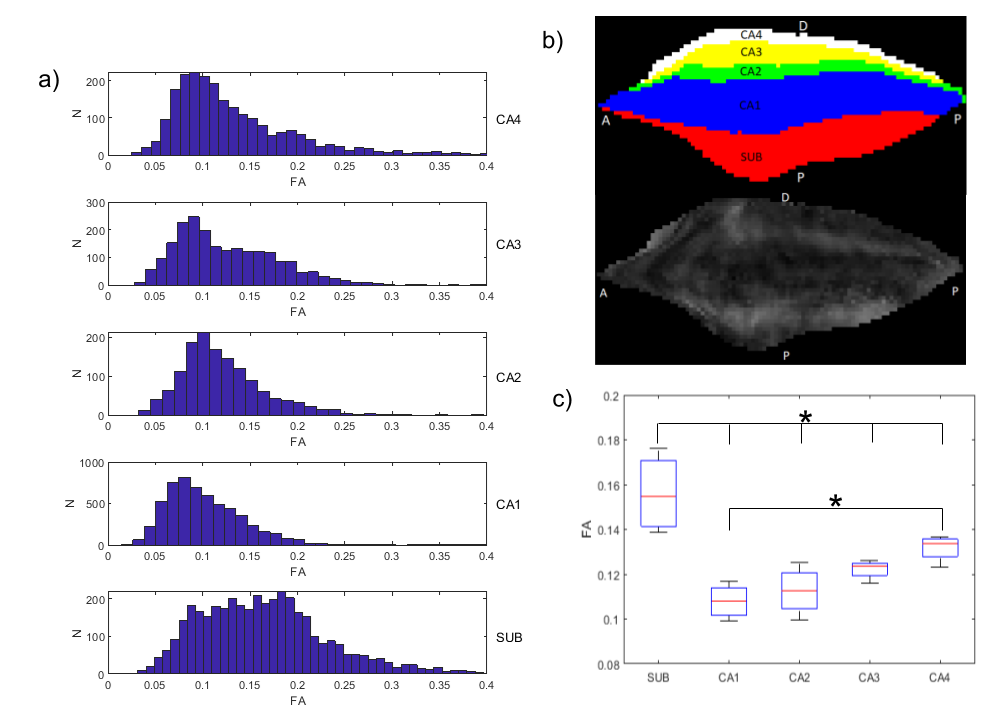
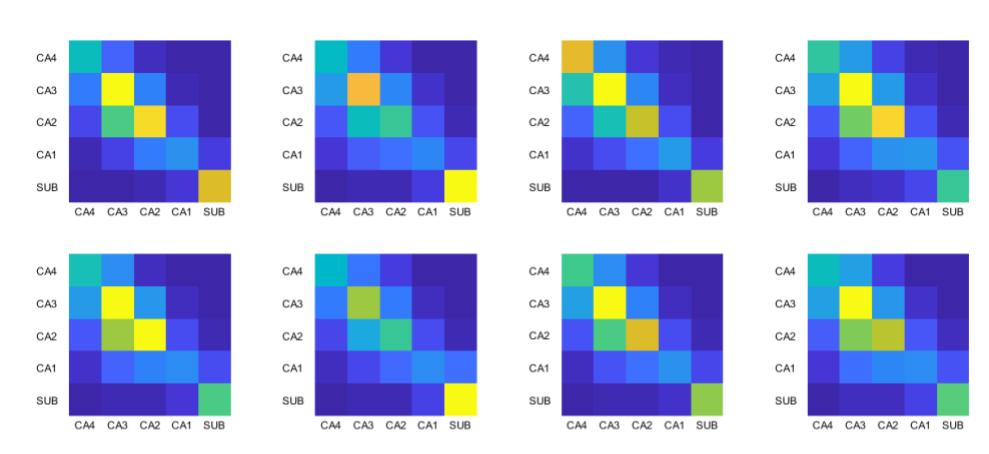
The visualizations of fibre orientation maps in Figure 2 demonstrates how unfolding provides an holistic visualization of the entire extent of the hippocampus, and reveals patterns in fibre orientation and anisotropy that are more difficult to discern in the native space. A validation of the ability of the unfolding approach to preserve orientation information is shown in Figure 3, with angle errors from fits in the native space compared to fits performed in unfolded space and mapped back to the native space. Figure 4 shows that fractional anisotropy has some subfield specificity, with subiculum significantly different than all other subfields. Figure 5 shows the intra-hippocampal connectivity for all 8 hippocampi, revealing consistent patterns that are consistent with connections related to the tri-synaptic pathway.Discussion
Acknowledgements
This work was supported by a BrainsCAN Stimulus grant from the Canada First Research Excellence Fund, Brain Canada, and a Project Grant from the Canadian Institutes of Health Research (CIHR). We thank Kayla Ferko for assisting with hippocampal subfield segmentation.References
1. Beaujoin, J., Palomero-Gallagher, N., Boumezbeur, F., Axer, M., Bernard, J., Poupon, F., Schmitz, D., Mangin, J.-F. & Poupon, C. Post-mortem inference of the human hippocampal connectivity and microstructure using ultra-high field diffusion MRI at 11.7 T. Brain Struct. Funct. 223, 2157–2179 (2018).
2. DeKraker, J., Ferko, K. M., Lau, J. C., Köhler, S. & Khan, A. R. Unfolding the hippocampus: An intrinsic coordinate system for subfield segmentations and quantitative mapping. Neuroimage 167, 408–418 (2018).
3. Van Essen, D. C., Smith, S. M., Barch, D. M., Behrens, T. E. J., Yacoub, E., Ugurbil, K. & WU-Minn HCP Consortium. The WU-Minn Human Connectome Project: an overview. Neuroimage 80, 62–79 (2013).
4. Behrens, T. E. J., Woolrich, M. W., Jenkinson, M., Johansen-Berg, H., Nunes, R. G., Clare, S., Matthews, P. M., Brady, J. M. & Smith, S. M. Characterization and propagation of uncertainty in diffusion-weighted MR imaging. Magn. Reson. Med. 50, 1077–1088 (2003).
5. Behrens, T. E. J., Berg, H. J., Jbabdi, S., Rushworth, M. F. S. & Woolrich, M. W. Probabilistic diffusion tractography with multiple fibre orientations: What can we gain? Neuroimage 34, 144–155 (2007).
Figures