0162
Mapping of fibre-specific relaxation and diffusivities in heterogeneous brain tissue1Physical Chemistry, Department of Chemistry, Lund University, Lund, Sweden, 2Random Walk Imaging AB, Lund, Sweden, 3Cardiff University Brain Research Imaging Centre (CUBRIC), School of Psychology, Cardiff University, Cardiff, United Kingdom, 4Harvard Medical School, Boston, MA, United States, 5Radiology, Brigham and Women’s Hospital, Boston, MA, United States
Synopsis
While diffusion MRI tractography has provided important insights on the human brain connectome, fibre-tracking through heterogeneous voxels has proven to be a challenging endeavour. Recently, we devised MRI acquisition- and processing methods to resolve sub-voxel heterogeneity with nonparametric 5D relaxation-diffusion distributions where contributions from distinct tissues are separated while circumventing the use of limiting assumptions. The separation between tissue-signals provides a clean mapping of nerve fibres that can then be used as an input in fibre-tracking algorithms. Additionally, values of relaxation rates and diffusivities are estimated for each distinct fibre bundle, potentially giving tract-specific information on chemical composition and microstructure.
Introduction
Fibre tracking based on conventional diffusion MRI faces problems in heterogeneous voxels containing not only myelinated axons but also unknown amounts of grey matter, cerebrospinal fluid, or pathological tissue. While multi-tissue spherical deconvolution approaches1 are able to resolve sub-voxel heterogeneity, they assume a single kernel per tissue type, which needs to be calibrated a priori2. Moreover, the existence of R2 = 1/T2 heterogeneity between different tissue types and fibre populations3 biases the quantification of tissue fractions. Inspired by multidimensional solid-state NMR methodology4,5, we designed a novel framework to quantify the composition of each voxel with nonparametric 5D distributions of R2, axial (DA) and radial (DR) diffusivities, and diffusion tensor (D) orientation (θ,φ)6. The suggested method facilitates the separation of tissue-signals, and allows characterisation of relaxation rates and diffusion properties of each distinct fibre bundle.Methods
In vivo human brain data: A healthy volunteer was scanned on a 3T Siemens MAGNETOM Prisma equipped with a 32-channel receiver head-coil, using an EPI sequence customised for variable echo times (TE) and b-tensor diffusion encoding5,7. Images with different b-tensors and TE were acquired, yielding a 5D acquisition space (Fig.1a) whose dimensions match those of the sought-for R2-D distributions. Tensor-valued diffusion encoding was performed with numerically optimised waveforms8 that were both spectrally-matched9 and Maxwell-compensated10. All images were recorded using TR=4 s, FOV=234×234×60 mm3, voxel-size=3×3x3 mm3, partial-Fourier=6/8, and iPAT=2 (GRAPPA).
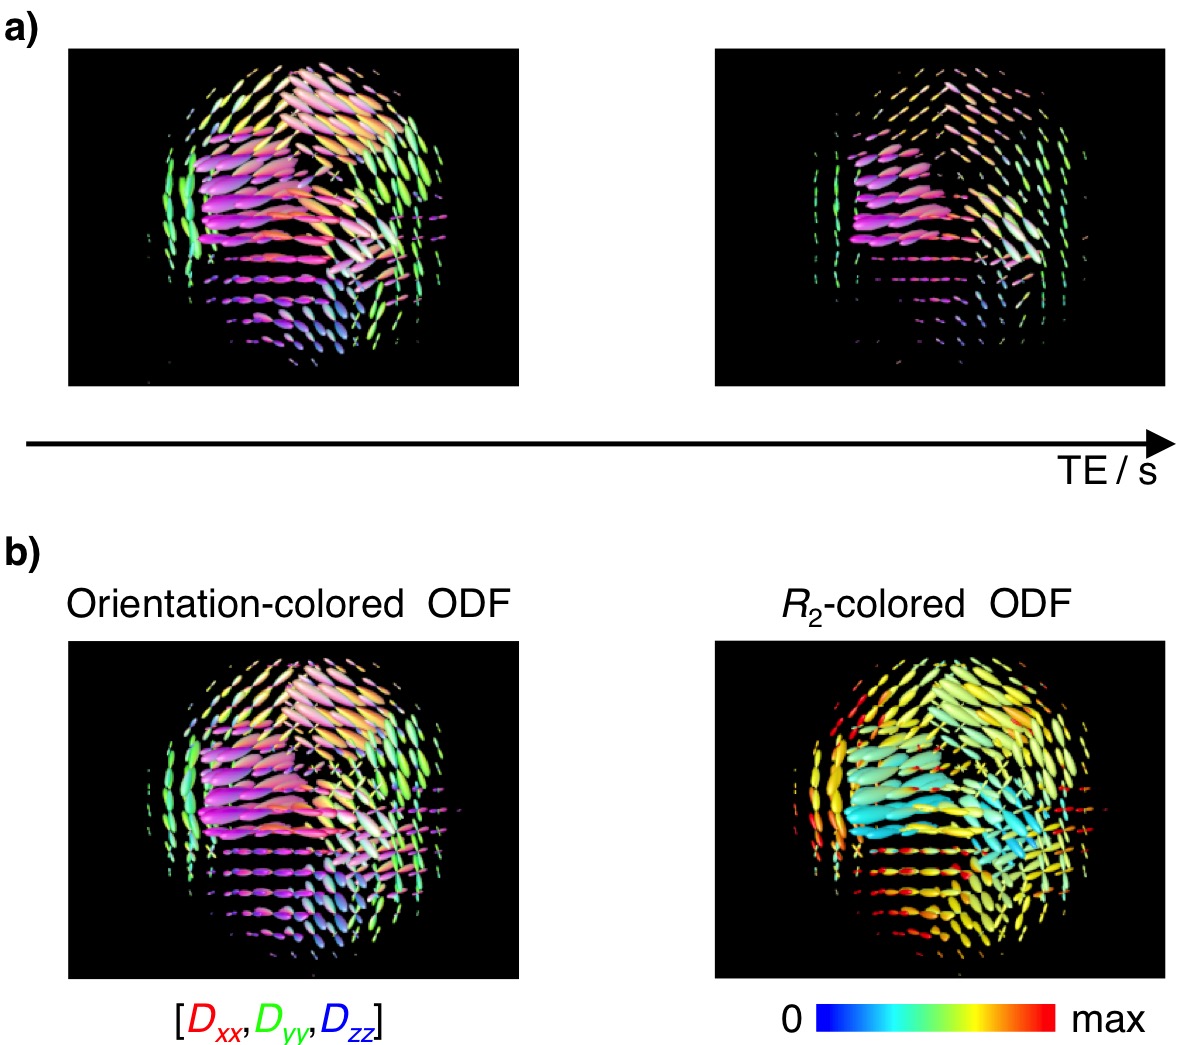
Phantom data: Data was acquired on a liquid crystalline sample featuring several microscopic domains wherein water diffusion is highly anisotropic11. The sample was prepared so that different domains have different orientations relative to the laboratory frame of reference. The liquid crystal was measured on an 11.7T Bruker micro-imaging system, using a single-shot RARE sequence allowing for R2 weighting, and diffusion encoding with arbitrary gradient waveforms12. Remaining settings were: voxel-size 37.5x37.5x600 μm3, 5 slices, and TR=1s. The phantom data was used to showcase the effects of R2-dispersion on the estimation of fibre-orientations, and to validate the proposed framework.
Relaxation-diffusion distributions: Spatially-resolved R2-D distributions were retrieved from the 5D datasets using an unconstrained Monte-Carlo algorithm13. Avoiding common regularisation metrics14, we estimate for each imaging voxel an ensemble of 96 plausible solutions, each of which consists of 10 (R2,DA,DR,θ,φ)i=1:10 nodes and their respective Pi=1:10(R2,DA,DR,θ,φ) weights.
ODF estimation: Binning the R2-D space separates the contributions from anisotropic tissue components (Fig. 1b). The corresponding sets of bin-resolved Pi=1:10(R2,DA,DR,θ,φ) weights were then convolved onto a sphere using a Watson distribution kernel15. Averaging the 96 sets of spherically convolved distributions results in smooth Orientation Distribution Functions (ODF), independently estimated for each voxel. Because each point of the smooth distributions is assigned to a specific (R2,DA,DR,θ,φ) coordinate, we can assign any individual dimension of the R2-D space to specific ODF-peaks. FiberNavigator16 was used to extract tracts connecting the three highest local maxima of the per-voxel ODFs.
Results & Discussion
Phantom experiments (Fig. 2a) show that diffusion-weighted data measured at a single TE may lead to an underestimation of signal fractions of high-R2 components. Even though the phantom possesses a homogeneous chemical composition, ODF maps computed at higher TE seem to indicate a non-uniform spatial distribution of water. In this case, this is attributed to a R2-dependency on domain orientation. Acquiring data at multiple TE and subsequent retrieval of R2-D distributions not only yields more accurate ODFs, but also allows mapping of peak-specific R2 contributions (Fig. 2b).
For human brain data, 5D R2-D distributions allow the quantification of
distinct cerebral tissues without relying on assumptions about the number or
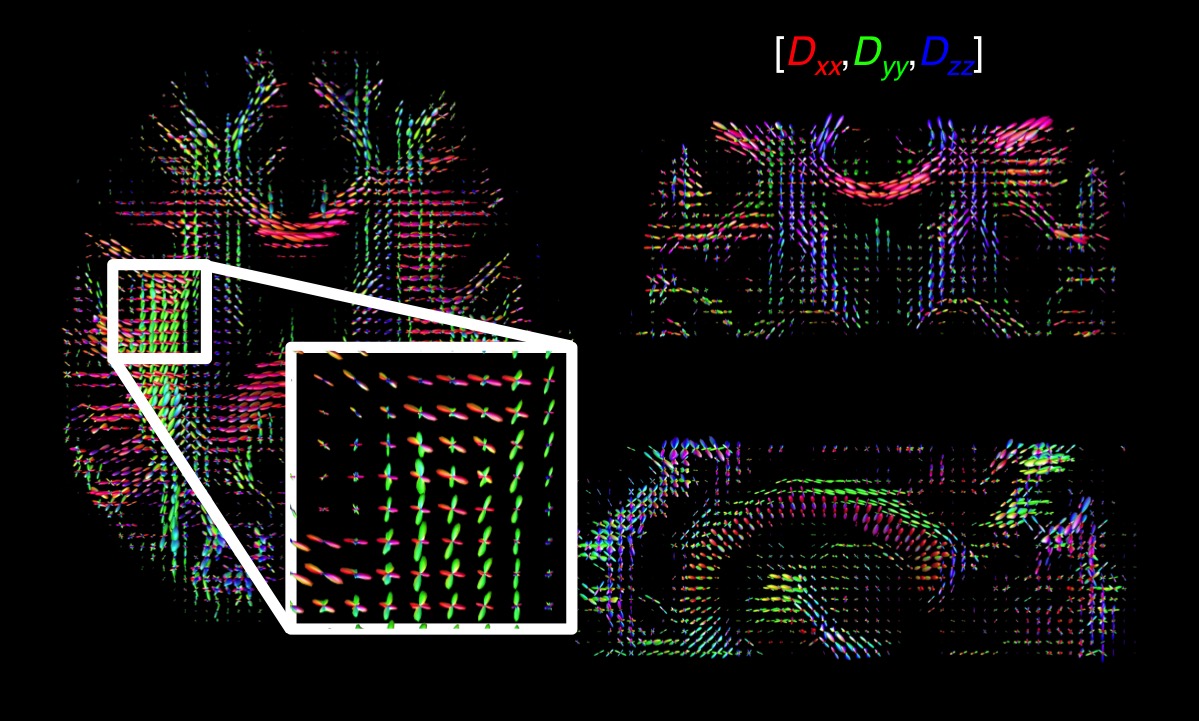
properties of individual components (Fig. 1b). The directionally-coloured
ODFs from anisotropic tissue components are displayed in Fig. 3.
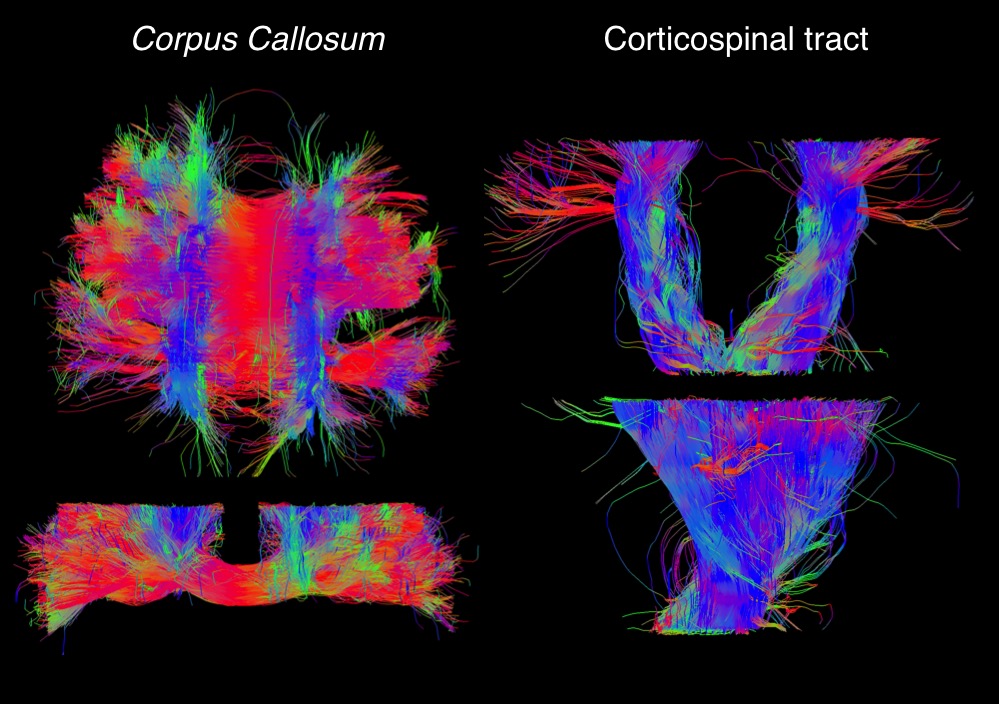
Anatomically-plausible fibre tracks were reliably extracted from the ODF maps
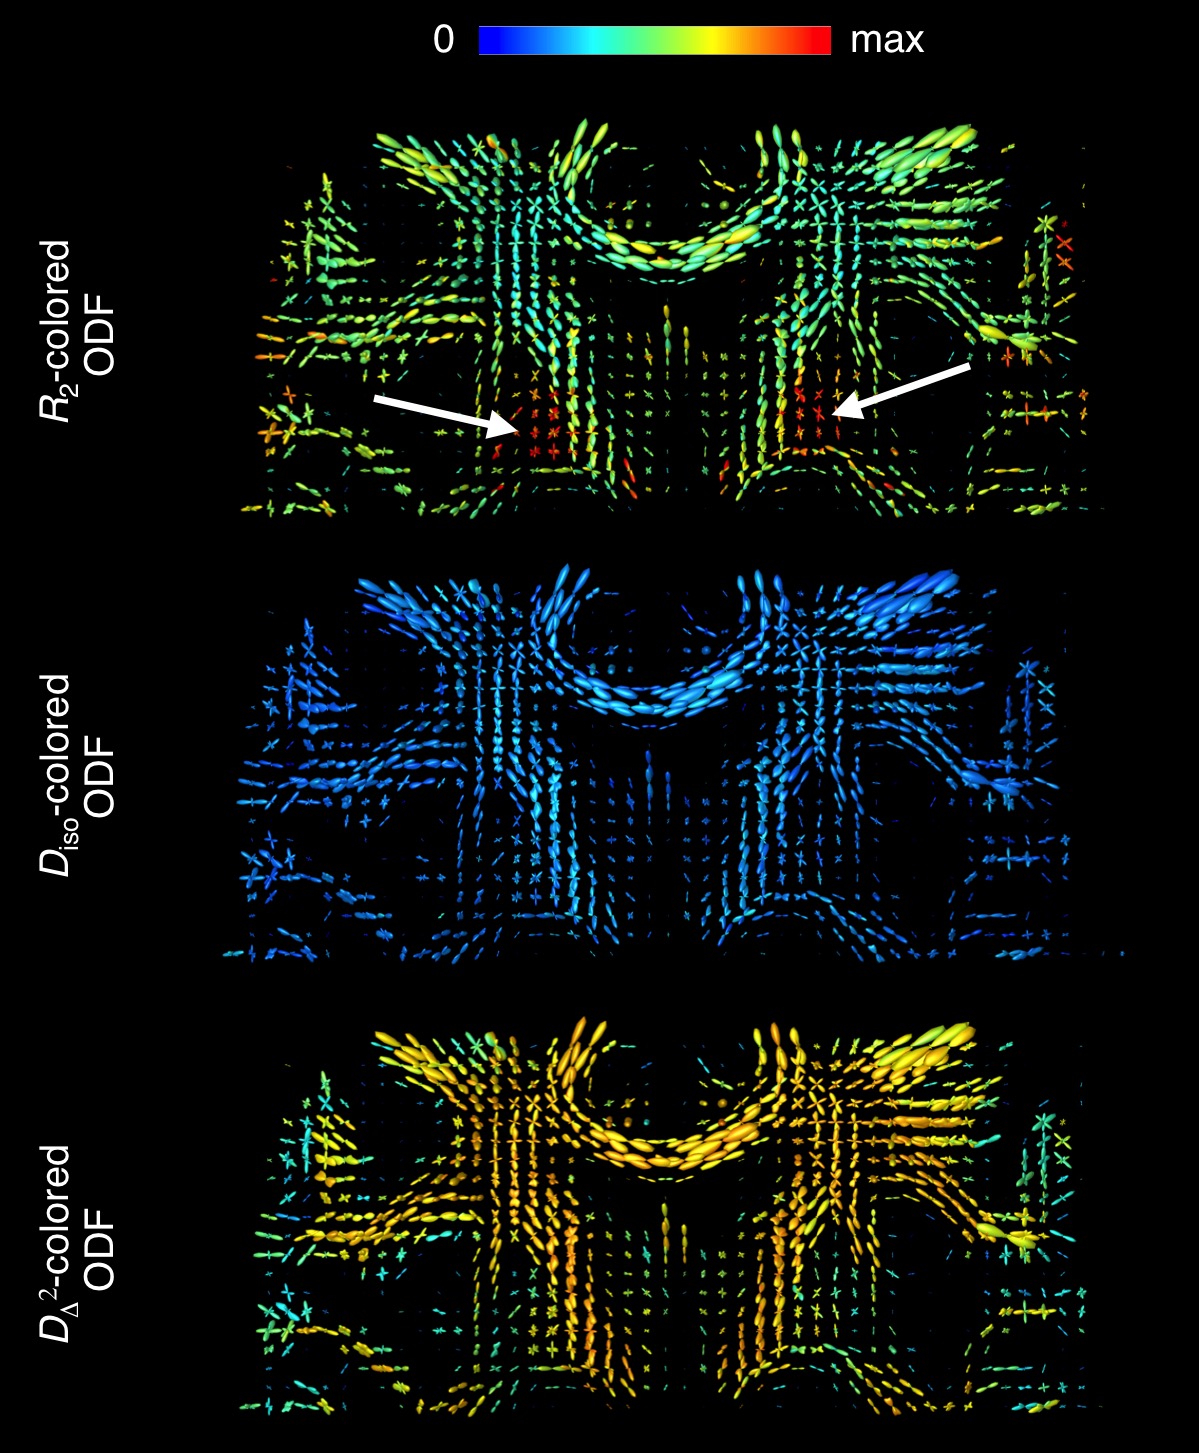
(Fig.4). Fig. 5 shows colouring of the ODF peaks according to the sub-voxel
values of R2, Diso = (DA+2DR)/3,
and DΔ2 = (DA–DR)2/9Diso2. Unlike the phantom-data,
no R2-orientational
dependence was discernible in the in vivo data. Nevertheless, correlating R2 with microscopic D leads to an improved mapping of
anisotropic tissue-compartments, for example in the caudate nucleus (white
arrows in Fig. 5).
Conclusion
Our image acquisition protocol and model-free data inversion separates tissue components based on their microscopic diffusion-relaxation properties. This provides a clean 3D mapping of the signal fractions from anisotropic components, that can then be used as an input in fibre tracking algorithms. The contributions from fibre bundles can be resolved in heterogeneous voxels without the need to a priori fix signal response functions. Furthermore, comprehensive correlations across the R2-D space provide peak-specific information on chemical composition and microstructure, and allow the investigation of R2-anisotropy effects.Acknowledgements
This work was financially supported by the Swedish Foundation for Strategic Research (AM13-0090) and the Swedish Research Council (2009–6794, 2014–3910). In vivo data was acquired at the UK National Facility for In Vivo MR Imaging of Human Tissue Microstructure funded by the EPSRC (grant EP/M029778/1), and The Wolfson Foundation. The authors are also grateful to the Netherlands Organisation for Scientific Research (NWO) (680-50-1527), the Wellcome Trust, UK (grants 096646/Z/11/Z and 104943/Z/14/Z), the Whitaker Fellowship, and the Natural Sciences and Engineering Research Council of Canada (NSWERC) (PDF-502385-2017) for supporting this research.
References
1. Jeurissen, B., Tournier, J.-D., Dhollander, T., Connelly, A. & Sijbers, J. Multi-tissue constrained spherical deconvolution for improved analysis of multi-shell diffusion MRI data. Neuroimage 103, 411-426 (2014).
2. Tax, C. M., Jeurissen, B., Vos, S. B., Viergever, M. A. & Leemans, A. Recursive calibration of the fiber response function for spherical deconvolution of diffusion MRI data. Neuroimage 86, 67-80 (2014).
3. Henkelman, R. M., Stanisz, G. J., Kim, J. K. & Bronskill, M. J. Anisotropy of NMR properties of tissues. Magn. Reson. Med. 32, 592-601 (1994).
4. Schmidt-Rohr, K. & Spiess, H. W. Multidimensional solid-state NMR and polymers. (Academic Press, 1994).
5. Topgaard, D. Multidimensional diffusion MRI. J. Magn. Reson. 275, 98-113 (2017).
6. Tax, C. M.W. et al. From physical chemistry to human brain biology: unconstrained inversion of 5-dimensional diffusion-T2 correlation data. in Proc. Intl. Soc. Mag. Reson. Med. 1101 (2018)
7. Westin, C.-F. et al. Q-space trajectory imaging for multidimensional diffusion MRI of the human brain. Neuroimage 135, 345-362 (2016).
8. Sjölund, J. et al. Constrained optimization of gradient waveforms for generalized diffusion encoding. J. Magn. Reson. 261, 157-168 (2015).
9. Lundell, H. M. H. et al. Microscopic anisotropy with spectrally modulated q-space trajectory encoding. in Proc. Intl. Soc. Mag. Reson. Med. 1086 (2017)
10. Szczepankiewicz, F. & Nilsson, M. Maxwell-compensated waveform design for asymmetric diffusion encoding. in Proc. Intl. Soc. Mag. Reson. Med. 207 (2018)
11. Nilsson, M. et al. Liquid crystal phantom for validation of microscopic diffusion anisotropy measurements on clinical MRI systems. Magn. Reson. Med. 79 1817-1828 (2017).
12. Lasič, S., Szczepankiewicz, F., Eriksson, S., Nilsson, M. & Topgaard, D. Microanisotropy imaging: quantification of microscopic diffusion anisotropy and orientational order parameter by diffusion MRI with magic-angle spinning of the q-vector. Front. Physics 2, 11 (2014).
13. de Almeida Martins, J. P. & Topgaard, D. Multidimensional correlation of nuclear relaxation rates and diffusion tensors for model-free investigations of heterogeneous anisotropic porous materials. Sci. Rep. 8, 2488 (2018).
14. Prange, M. & Song, Y.-Q. Quantifying uncertainty in NMR T2 spectra using Monte Carlo inversion. J. Magn. Reson. 196, 54-60 (2009).
15. Jones, D. K. Diffusion MRI. (Oxford University Press, 2010).
16. Chamberland, M., Whittingstall, K., Fortin, D., Mathieu, D. & Descoteaux, M. Real-time multi-peak tractography for instantaneous connectivity display. Front. Neuroinform. 8, 59 (2014).
Figures
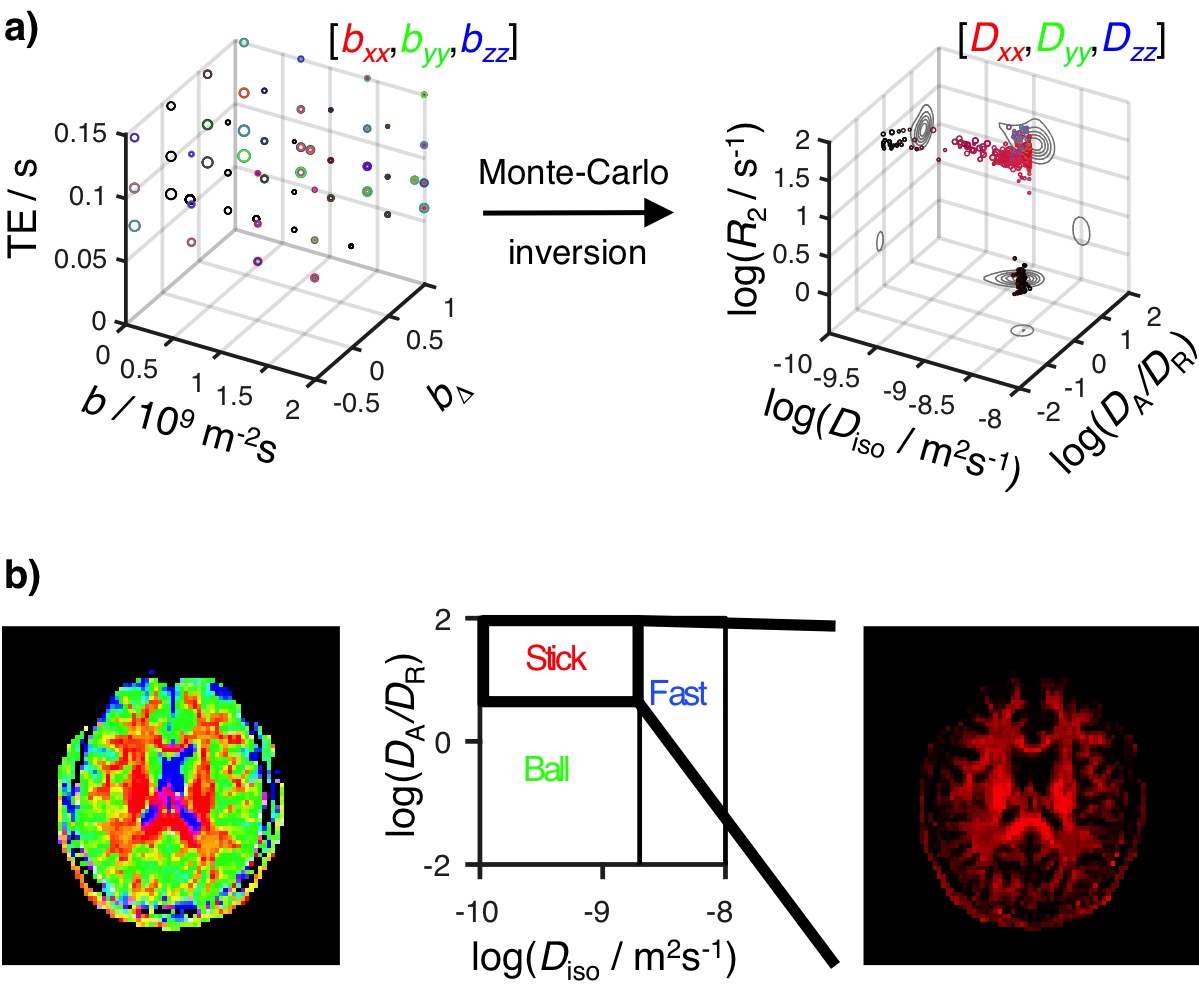
Fig. 1: Principles of 5D R2-D imaging. a) Acquired signal displayed as a scatter plot with the axes b-tensor trace (b), normalised b anisotropy (bΔ), and echo-time (TE), using colour-coding according to b-tensor orientation, and circle area given by signal intensity. Inversion of the acquired datasets yields 5D R2-D distributions shown as logarithmic plots of the isotropic diffusivity Diso, axial-radial ratio DA/DR, and R2, with circle area proportional to the weight of the corresponding (R2,Diso,DA/DR,θ,φ) coordinates. b) Colour-coded composite image of the fractional populations in the ‘Stick’ (red), ‘Ball’ (green), and ‘Fast’ (blue) bins in the R2-D space.