0161
In vivo mapping of liver microstructure using quantitative Temporal Diffusion Spectroscopy Imaging1Vanderbilt University Institute of Imaging Science, nashville, TN, United States
Synopsis
Architectural and morphological changes of hepatocytes (the major parenchymal cells carrying out most of the metabolic functions of the liver) are key diagnostic findings for liver diseases and are associated with important biological events. However, such information can currently only be assessed by liver biopsy. Quantitative temporal diffusion spectroscopy imaging (qTDSI), which uses different modulated gradient waveforms to measure ADC values equivalent to the use of multiple diffusion times (Δ), has been shown to provide accurate, high-resolution maps of cell size in solid tumors. In this study, we demonstrated that qTDSI can map hepatocyte sizes in mice in vivo.
Introduction
Hepatocytes are the major parenchymal cells carrying out most of the metabolic functions of the liver. Architectural and morphological changes of hepatocytes (e.g., hepatocellular ballooning, cell crowding, and small cell change of dysplasia) are key diagnostic findings for liver diseases (1,2) and are associated with important biological events (e.g., cell shrinkage during apoptosis (3) and cell swelling during hepatocyte polyploidy (4)). However, such information can currently only be assessed by liver biopsy. Recently, we have developed quantitative temporal diffusion spectroscopy imaging (qTDSI), which uses different modulated gradient waveforms to measure ADC values equivalent to the use of multiple diffusion times (Δ), and provides accurate, high-resolution maps of cell size and cell volume in tissues such as solid tumors (5). Most liver volume is occupied by tightly packed cells, so we hypothesize that the average cell size and cell volume of hepatocyte, can be estimated using an appropriate implementation of qTDSI. However, significant microcirculatory flow effects on conventional in vivo liver diffusion signals acquired at relatively long Δ (>20 ms) have been reported extensively (6), which bias the measured ADC values. Whether microcirculatory flow influences liver diffusion signals acquired at very short Δ is unknown. In this study, we i) investigated how microcirculatory flow effects on in vivo liver diffusion signals acquired over a wide range of Δ (2.5 – 40 ms) can be minimized; and ii) demonstrated that qTDSI can map hepatocyte sizes in mice in vivo.Methods
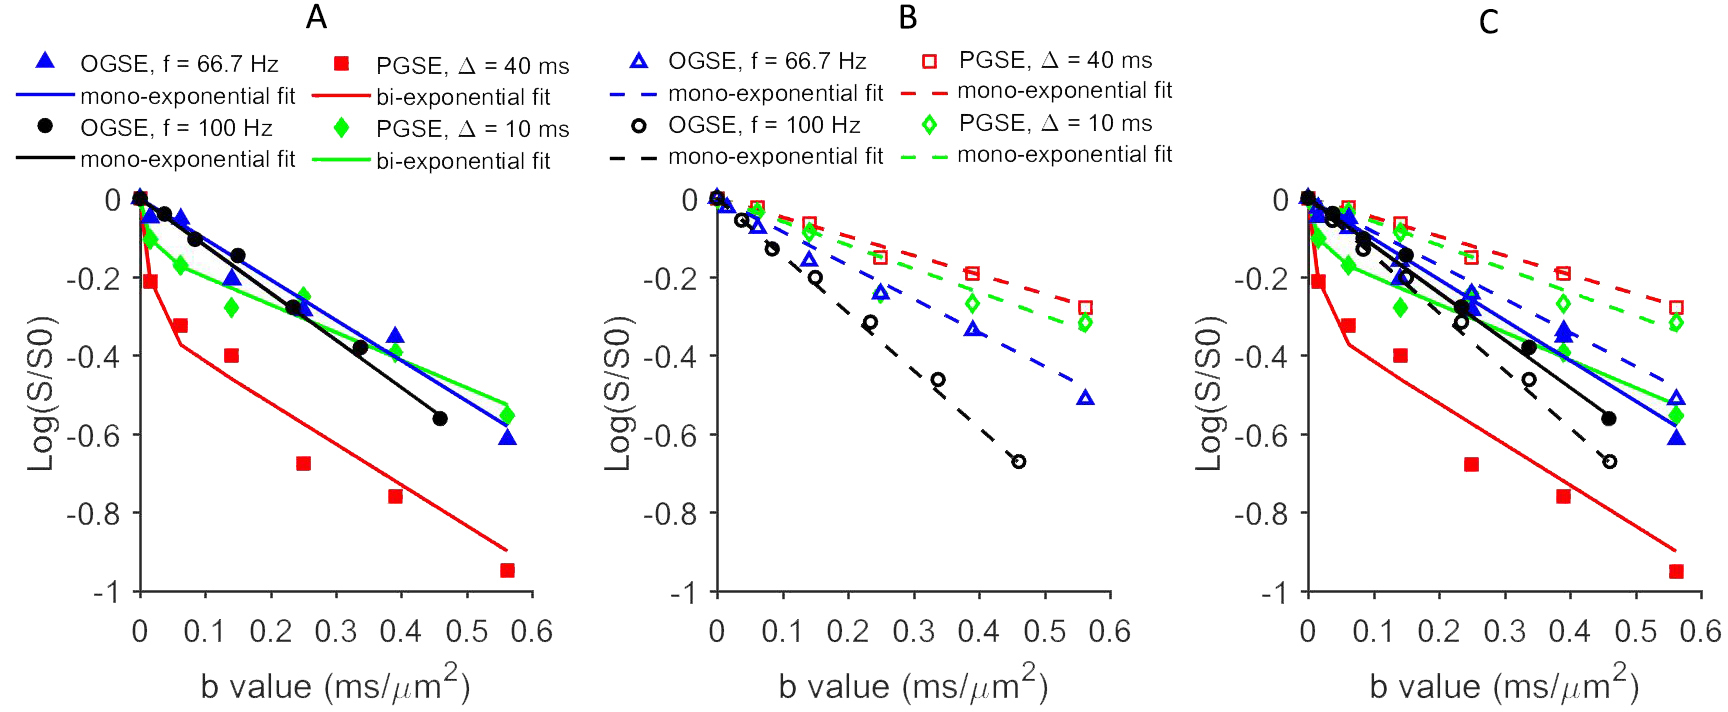
A) Six mouse livers were imaged in vivo and postmortem using a combination of oscillating gradient spin echo (OGSE) and pulsed gradient spin echo (PGSE) acquisitions covering diffusion times from 2.5 to 40 ms with seven b-values < 600 s/mm2. Diffusion signal behaviors were modeled as mono- or bi-exponential decays and statistically analyzed for best fits. Diffusion constants obtained from postmortem diffusion signals were assumed to represent ‘ground truth’ and to be unaffected by microcirculatory flow. We then evaluated the performance of different data processing strategies for suppressing perfusion effects. B) Three mouse livers were imaged in vivo using PGSE (Δ = 10 and 40 ms) and OGSE (f = 66.7 Hz and 100 Hz) acquisitions. Five b-values (0, 300, 500, 750, 1000 s/mm2) were used for PGSE and 66.7 Hz OGSE, and four b-values (0, 300, 450, 600 s/mm2) were used for 100 Hz OGSE. Signals with b-values > 200 s/mm2 were fit to a two compartmental model:
S=(S’b=0/Sb=0)[VinSin+(1-Vin)Sex]
where Sb=0 is the signal at b-value = 0, S’b=0 is calculated by extrapolating the diffusion data with b-values > 200 s/mm2 back to b-value = 0. Vin is the water volume fraction of intracellular space, and Sin and Sex are the diffusion-weighted signal magnitudes per volume from the intra- and extracellular extravascular spaces, respectively. The analytical expression of Sin for spherical cells has been derived previously (7,8), and depends on cell size d and intracellular diffusion rate Din. In liver tissues, cell size d is dominated by the size of hepatocyte. Sex depends on the extracellular diffusion rate at long diffusion times, and the manner in which the extracellular diffusion coefficient varies with respect to gradient frequency.
Results and Discussion
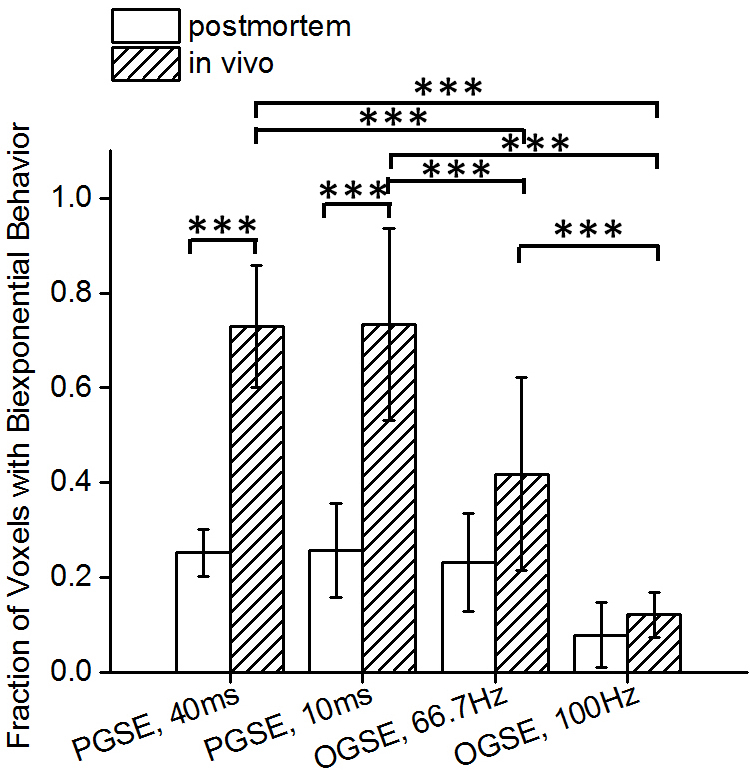
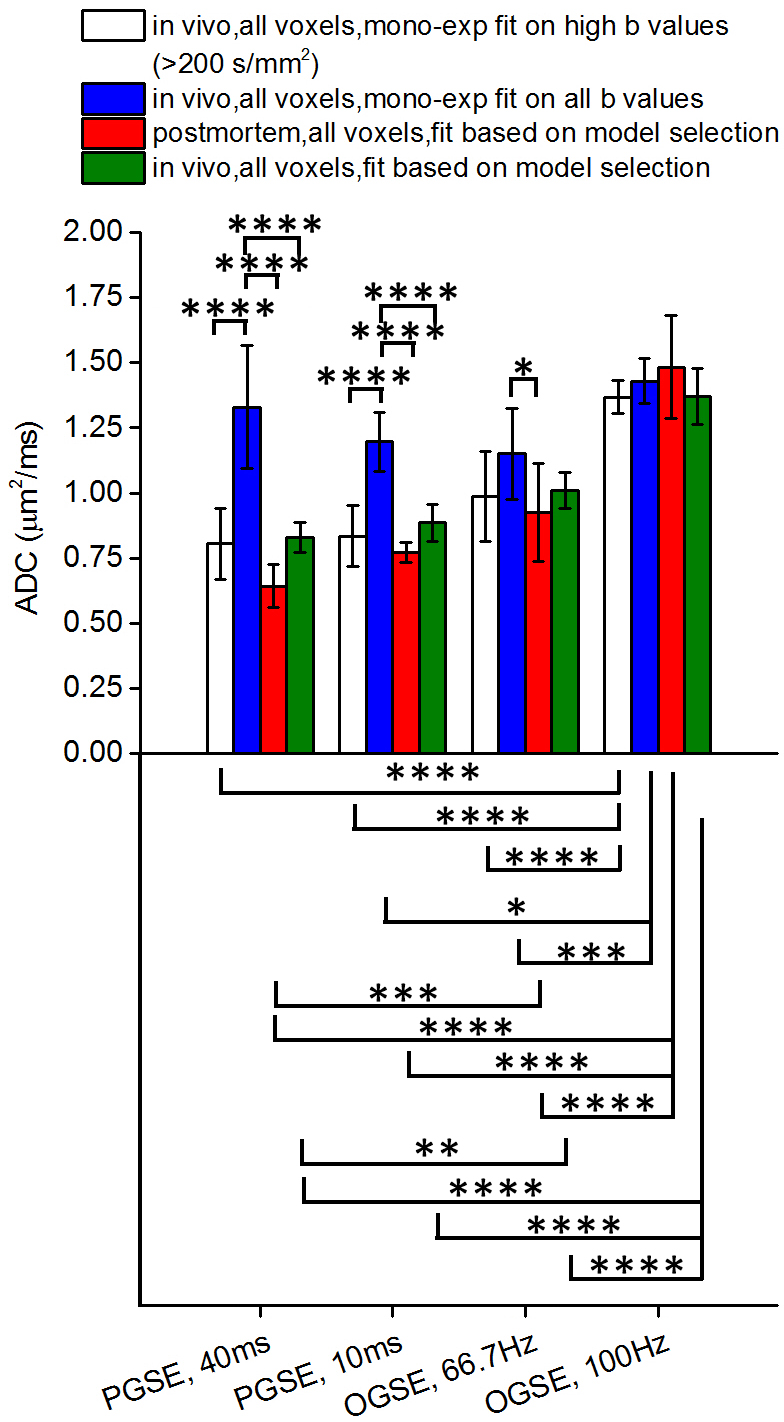
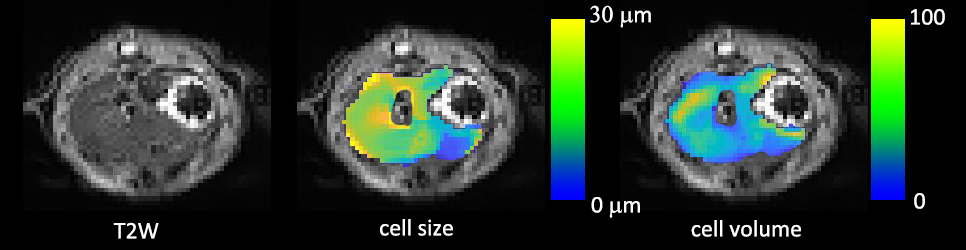
In Figure 1, in vivo OGSE signals showed similar mono-exponential behaviors as postmortem OGSE signals from the same voxel, while in vivo PGSE signal attenuations were better described by a bi-exponential rather than a mono-exponential model. A statistical summary of the fraction of liver voxels with bi-exponential behavior (Figure 2) shows that in vivo OGSE signals were less affected by microcirculatory flow. We evaluated the accuracy of three common ways for ADC estimation by fit diffusion signals to: a) a mono-exponential model; b) a mono-exponential model using b values >200 s/mm2; c) a bi-exponential model to separate tissue water diffusion from microcirculatory flow effect. In vivo liver ADCs obtained either by mono-exponential fitting on higher b-value signals or fitting all b-value signals to a statistical-determined model, showed no statistical significance with postmortem liver ADCs (Figure 3), suggesting that both metrics suppressed microcirculatory flow effects efficiently. By fitting PGSE and OGSE signals acquired at b-values > 200 s/mm2 to equation 1, maps of hepatocyte size and volume were generated (Figure 4). The mean hepatocyte size was found to be ~ 17 µm, which is consistent with literature values (9).Conclusion
This study demonstrated that qTDSI with b-values > 200 s/mm2 can provide in vivo mapping of hepatocyte size uninfluenced by the presence of microcirculatory flow. Efforts to validate the qTDSI-derived hepatocyte size by histology are ongoing.Acknowledgements
No acknowledgement found.References
1. Brunt EM. Pathology of nonalcoholic fatty liver disease. Nat Rev Gastro Hepat 2010;7(4):195-203.
2. Kudo M. Early hepatocellular carcinoma: definition and diagnosis. Liver cancer 2013;2(2):69-72. 3. Friis MB, Friborg CR, Schneider L, Nielsen MB, Lambert IH, Christensen ST, Hoffmann EK. Cell shrinkage as a signal to apoptosis in NIH 3T3 fibroblasts. J Physiol-London 2005;567(2):427-443. 4. Gentric G, Desdouets C, Celton-Morizur S. Hepatocytes polyploidization and cell cycle control in liver physiopathology. International journal of hepatology 2012;2012:282430.
5. Jiang X, Li H, Xie J, McKinley ET, Zhao P, Gore JC, Xu J. In vivo imaging of cancer cell size and cellularity using temporal diffusion spectroscopy. Magnetic resonance in medicine : official journal of the Society of Magnetic Resonance in Medicine / Society of Magnetic Resonance in Medicine 2017;78(1):156-164.
6. Mannelli L, Bhargava P, Osman SF, Raz E, Moshiri M, Laffi G, Wilson GJ, Maki JH. Diffusion-weighted imaging of the liver: a comprehensive review. Current problems in diagnostic radiology 2013;42(3):77-83.
7. Gore JC, Xu JZ, Colvin DC, Yankeelov TE, Parsons EC, Does MD. Characterization of tissue structure at varying length scales using temporal diffusion spectroscopy. NMR in biomedicine 2010;23(7):745-756.
8. Xu J, Does MD, Gore JC. Dependence of temporal diffusion spectra on microstructural properties of biological tissues. Magnetic resonance imaging 2011;29(3):380-390.
9. Morales-Navarrete H, Segovia-Miranda F, Klukowski P, Meyer K, Nonaka H, Marsico G, Chernykh M, Kalaidzidis A, Zerial M, Kalaidzidis Y. A versatile pipeline for the multi-scale digital reconstruction and quantitative analysis of 3D tissue architecture. Elife 2015;4.
Figures