0159
Feasibility Study of MRI IDEAL-IQ Sequence in Evaluating Liver Function of Patients with Liver Cirrhosis1The First Affiliated Hospital of Dalian Medical University, Dalian, China, 2GE Healthcare, BeiJing, China
Synopsis
Liver biopsy is the gold standard for the diagnosis of liver cirrhosis, but because the biopsy is invasive, and liver tissue sampling is insufficient and sampling error (puncture location) exists. IDEAL-IQ sequence can be used to analyze liver fat fraction and iron content (R2*) simultaneously, and it is easy to operate.
Purpose
To investigate the feasibility of assessing the liver function grading by IDEAL-IQ on 1.5T MR.Introduction
Cirrhosis of the liver is a chronic progressive disease found clinically, which severely threatens peoples health. Child-Pugh grading is a commonly used clinical standard for quantitative evaluation of liver reserve function in patients with liver cirrhosis[1]. It synthesizes the clinical and biochemical indexes of patients with liver cirrhosis[2], and evaluates the liver function before operation. The choice of operation mode and the prognosis estimate have important value. IDEAL-IQ sequence can be used to analyze liver fat fraction and iron content (R2*) simultaneously, and it is easy to operate.Materials and methods
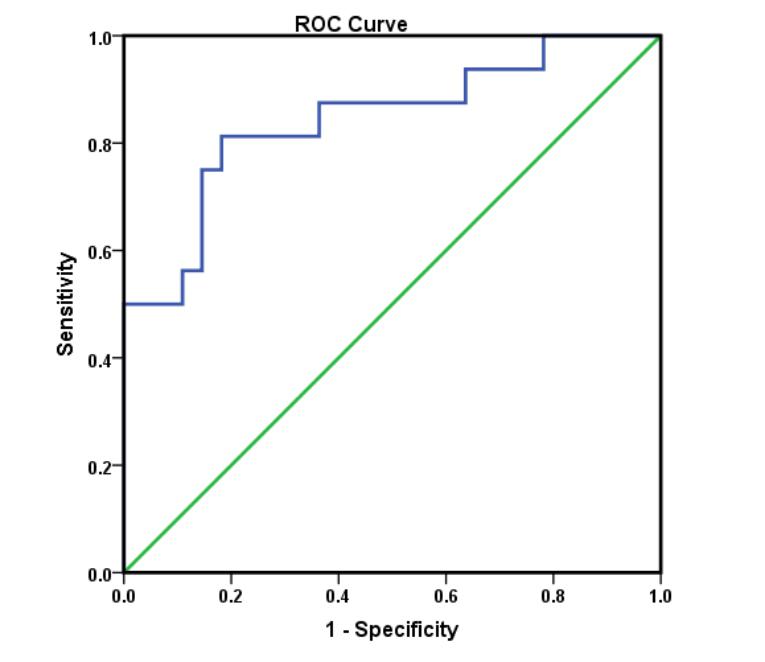
From February 2016 to December 2017, A total of 112 patients with liver cirrhosis were collected and respectively reviewed. All patients underwent the IDEAL-IQ sequence scan on 1.5T MR and were divided into 3 groups by Child-Pugh classification. Patients with massive hepatic carcinoma, suspected malignant occupied lesions, postoperative liver, multiple hepatic lesions, transfusion, anemia, hemorrhage of digestive tract, hemochromatosis were excluded, and 71 patients were enrolled , which included 30 Child-Pugh A, 25 Child-Pugh B and 16 Child-Pugh C. Final group: 30 Child-Pugh A, 25 Child-Pugh B, 16 Child-Pugh C. Fat ratio image, R2* relaxation rate image were used to measure fat fraction and R2* value of upper right anterior lobe of liver, right anterior lobe of liver and right posterior lobe of liver by two observers on AW4.6 workstation. As shown in figure 1-6. The mean value of the three liver samples was measured. The fat fraction and R2* value of the three groups were compared by Kruskal-Wallis H. The group A and B were combined, the combined fat fraction and R2* value were used to establish the predictive model of the group C, and the receiver operating characteristic was drawn to obtained the area under curve, then the Sensitivity and the specificity were calculated with the optimal threshold.Results
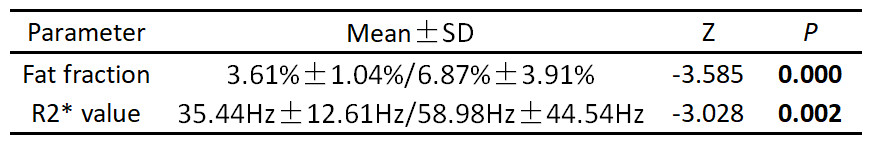
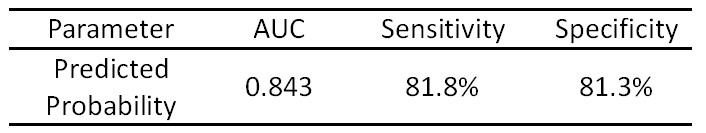
Two measurement data have good consistency (ICC>0.75). The liver fat fraction and R2* increased with the decrease of liver function. Fat fraction of Child-Pugh A, B and C groups were respectively (3.58±0.91)%, (3.64±1.20)%, and (6.87±3.91)%. R2* value of Child-Pugh A, B and C groups were(33.31±11.80)Hz, (38.00±13.31)Hz, (58.98±44.54)Hz, respectively. The AUC of combined fat fractiong and R2* value in the diagnosis of Child-Pugh C was 0.843. The sensitivity and the specificity were 81.8% and 81.3%. As shown in table 2 and figure 7.Discussion
With the exacerbation of liver cirrhosis, the fat fraction increased gradually, suggesting that hepatic steatosis was a synergistic factor of liver cirrhosis[3]. With the decrease of liver reserve function, the value of R2* increased gradually. The reason is that hepatic iron modulin synthesis is mainly affected by the number of liver cells and liver reserve function. The lower the liver reserve function is, the higher the child-pugh grade of liver function is, the less iron modulin synthesis is, and the easier the iron metabolism process is to deposit in the liver.Conclution
The 1.5T MRI IDEAL-IQ sequence can be used to evaluate the liver reserve function of patients with liver cirrhosis by fat fraction and R2* value, especially for the diagnosis of Child-Pugh C cirrhosis patients with high sensitivity and specificity.Acknowledgements
No acknowledgement found.References
[1] Yoon JH, Lee JM, Kang HJ, et al. Quantitative Assessment of Liver Function by Using Gadoxetic Acid-enhanced MRI: Hepatocyte Uptake Ratio[J]. Radiology: 2018, 30:180753.
[2] Turato C, Kent P, Sebastiani G, et al. Serpinb3 is overexpressed in the liver in presence of iron overload[J]. J Investig Med: 2018, 66(1): 32-38.
[3] Krishan S, Jain D, Bathina Y, et al. Non-invasive quantification of hepatic steatosis in living, related liver donors using dual-echo Dixon imaging and single-voxel proton spectroscopy[J]. Clin Radiol: 2016, 71(1): 58-63.
Figures
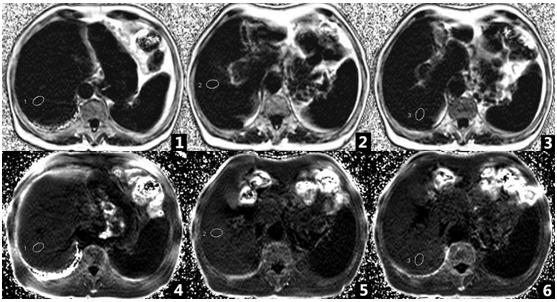
A 70 year-old female with Child-Pugh A
Figure. 1-3: The fat ratio image(3.6%, 3.4%, 3%)
Figure. 4-6: The R2*relaxation rate image(27.6Hz, 25.9Hz, 27.8Hz)