0158
Quantification and Repeatability of the Collagen Signal Fraction in the Healthy Liver Using Ultrashort Echo Time (UTE) MRI1Oxford Centre for Clinical Magnetic Resonance Research (OCMR), Division of Cardiovascular Medicine, Radcliffe Department of Medicine, University of Oxford, Oxford, United Kingdom
Synopsis
Liver injury can lead to fibrosis, i.e. an accumulation of collagen. Fibrosis is clinically assessed via biopsy. Due to the health risks and unrepresentative sampling associated with biopsy, a non-invasive method of quantifying collagen would be beneficial. Here, an ultrashort echo time (UTE) pulse sequence was employed to quantify the collagen signal fraction in 10 subjects with healthy livers in a test-retest study at 3 T. The collagen signal fraction was repeatable, with a mean of 14 ± 3 %.
Introduction
Liver fibrosis is characterized by an increase in collagen content. Causes may include alcohol abuse, viral disease, or use of hepatotoxic drugs. The percentage collagen area in the liver increases from ~ 2 % in healthy people to ~ 28 % in disease 1. Biopsy is the gold standard for quantification of liver fibrosis. However, this procedure carries health complications and sampling error 2. Ultrashort echo time (UTE) MRI allows for the sampling of short T2* species, such as collagen, which can be useful for detecting and quantifying fibrosis. Liver fibrosis has previously been imaged using UTE MRI, and demonstrates differences in T2* 3, 4 and short-T2* signal fraction 4 as a result of fibrosis. Direct detection and quantification of collagen content via UTE would be beneficial for the assessment of the severity of fibrosis. The collagen signal fraction was measured from a multi-exponential T2* model of the liver, involving signal components from collagen, fat, and free water, assuming an isotropic distribution of collagen fibres. Our objectives were to quantify and determine the repeatability of the collagen signal fraction in the healthy liver in vivo using UTE MRI.Methods
A multi-exponential T2* signal model was developed for the liver, involving global parameters ($$$_{g}$$$), signal components due to bound water from isotropic collagen ($$$S_{0c}$$$) with k collagen fibres, 6 spectral peaks of fat ($$$S_{0p}$$$) 5, and free water ($$$S_{0w}$$$):
$$S(TE,\theta)=(e^{i(2\pi f_{g}\cdot TE+\varphi_{g})})(S_{0c}\sum_k\rho(\theta_{k})e^{i2\pi f_{c}(\theta_{k})\cdot TE}e^{-TE \cdot R_{2}{^{*}}_{c}(\theta_{k})}+\sum_{p=1}^{6}S_{0p}e^{-TE \cdot R_{2}{^{*}}_{p}}e^{i2\pi f_{p}\cdot TE}e^{i\varphi_{p}}+S_{0w}e^{-TE\cdot R_{2}{^{*}}_{w}})$$
$$ Eq. (1)$$
$$$R{_{2}}^{*}{_{c}}(\theta)=R{_{2}}^{*}{_{c}}(55^\circ)+\frac{R{_{2}}^{*}{_{c}}(0^\circ)-R{_{2}}^{*}{_{c}}(55^\circ)}{4}(3\cos^{2}\theta-1)^{2}$$$ 6, where $$$R{_{2}}^{*}{_{c}}(0^\circ) = 1046\,s^{-1}$$$ and $$$R{_{2}}^{*}{_{c}}(55^\circ) = 114\,s^{-1}$$$, as measured in ex vivo tendon (A.G. Siu, unpublished data).
$$$f_{c}(\theta)=(\frac{\gamma{B_{0}}}{2\pi} )[\frac{\Delta\chi}{2}(\cos^{2}\theta-\frac{1}{3})+f_{0}]$$$, where $$$B_{0} = 2.89\,T$$$, $$$\Delta\chi = -2.17\,ppm$$$, and $$$f_{0} = 0.67\,ppm$$$ from the modelling of the frequency of fresh tendon 7.
For fat, the CH2 peak was fitted and the remaining 5 peaks were scaled relative to it, based on the signal contributions, R2*s, and frequencies of the 6 peaks of peanut oil 8.
For free water, $$$R{_{2}}^{*}{_{w}} = 14\,s^{-1}$$$.
The livers of 10 healthy subjects (7 male, age 28 ± 5 years) were scanned on a Tim Trio 3 T system (Siemens, Germany) with a 32-channel cardiac coil (Invivo, USA) in a test-retest study. Between the test and retest, the subjects removed themselves from the scanner bed for ~ 5 mins. A 2D-UTE pulse sequence with cardiac gating and gradient spoiling was used (TR 7 ms, slice thickness 8 mm, flip angle 10⁰, FOV 300 mm × 300 mm, matrix 256 pixels × 256 pixels, number of averages 2, bandwidth 980 Hz/pixel, readouts/heartbeat 60, breath hold duration ~ 10 s). Two saturation bands with gap 10 mm and thickness 110 mm were employed for outer-volume suppression, reducing the fat signal arising from poor slice selection in UTE. 14 TEs were acquired in 7 dual-echo acquisitions. TEs ranged from 0.23 to 5.45 ms. Rigid body image registration was performed to correct motion between TEs (MATLAB R2015b). Modelling of the signal decay as a function of TE was performed over a 10 pixel × 10 pixel ROI (avoiding vessels) in the liver using Eq. (1), via a non-linear least-squares fitting algorithm (MATLAB R2015b).
The collagen signal fraction was calculated as: $$\frac{{S_{0c}}}{{S_{0c}}+\sum_{p=1}^6{S_{0p}}+{S_{0w}}}\times100\:\%$$.
Results and Discussion
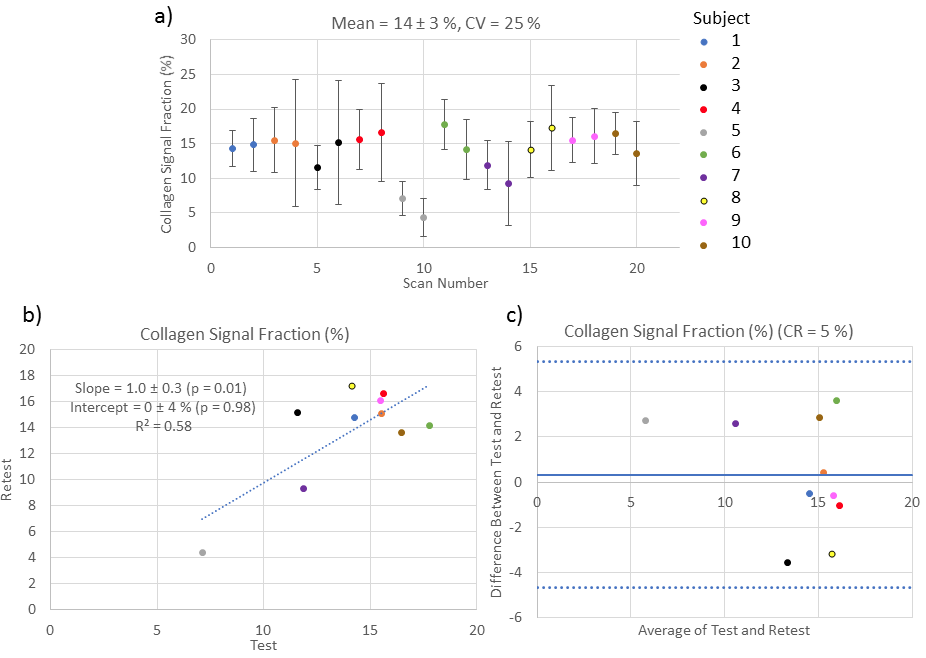
Figure 1 is an example UTE image of a subject’s liver and the UTE signal decay. Figure 2 illustrates results from the test-retest study. For the collagen signal fraction in the liver, the coefficient of variation was 25 % and the coefficient of repeatability was 5 %.
The mean collagen signal fraction was 14 ± 3 % and refers to the fraction of protons in collagen-bound water over the total number of protons in the liver. The mean collagen signal fraction was higher than the expected collagen content in the healthy liver, assuming ~ 2 % collagen by area 1. Reasons for the discrepancy in the mean collagen signal fraction may include trade-off between the fat and collagen signal components in the fitting process, and intermediate or fast exchange between the collagen and free water components. The multi-exponential T2* signal model and the collagen signal fraction hold for slow exchange between components with dissimilar relaxation rates; this applies to collagen in tendon, but may not apply to fibrotic tissue where collagen fibres are finer and varied in orientation.
Conclusion
In the healthy in vivo liver, a repeatable collagen signal fraction was found, of mean 14 ± 3 %. Future studies will investigate whether the collagen signal fraction as evaluated in this work is sensitive to fibrosis.Acknowledgements
The research was supported by the National Institute for Health Research (NIHR) Oxford Biomedical Research Centre (BRC). AGS holds a Doctoral Postgraduate Scholarship from the National Sciences and Engineering Research Council of Canada (NSERC).References
1. Standish RA. An appraisal of the histopathological assessment of liver fibrosis. Gut. 2006;55(4):569-578.
2. Bataller R, Brenner D. Liver fibrosis. J Clin Invest. 2005;115(2):209-218.
3. Chappell KE, Patel N, Gatehouse PD, et al. Magnetic Resonance Imaging of the Liver with Ultrashort TE (UTE) Pulse Sequences. J Magn Reson Imaging. 2003;18(6):709-713.
4. Kim H, Robson M, Qiu M, et al. Characterization of Liver Fibrosis Using Fat-Suppressed Ultrashort TE (FUTE) Imaging and Multipoint Water-Fat Separation MRI in Patients with Hepatitis C Virus (HCV)-Induced Liver Fibrosis. Proc 16th Sci Meet Int Soc Magn Reson Med. 2008;16(c):3715.
5. Hamilton G, Yokoo T, Bydder M, et al. In vivo characterization of the liver fat 1H MR spectrum. NMR Biomed. 2011;24(7):784-790.
6. Chappell KE, Robson MD, Stonebridge-Foster A, et al. Magic Angle Effects in MR Neurography. Am J Neuroradiol. 2004;25(3):431-440.
7. Siu AG, Biasiolli L, Robson MD. Analysis of the Orientation-Dependent Frequency of Tendon via Ultrashort Echo Time (UTE) MRI. Proc Intl Soc Mag Reson Med. 2018;26:1414.
8. Mozes FE, Tunnicliffe EM, Moolla A,
et al. Mapping tissue water T1 in the liver using the MOLLI T1 method in the
presence of fat, iron and B0 inhomogeneity. 2018:In print.
Figures