0157
Evaluating the clinical efficacy of magnetic resonance elastography in patients with Budd-Chiari syndrome1Affiliated Hospital of Xuzhou Medical University, Xuzhou, China, 2GE Healthcare, MR Research China, Beijing, China, 3GE Healthcare, MR Enhanced Application China, Beijing, China
Synopsis
Budd-Chiari syndrome (BCS) is a rare disorder with an obstruction of the hepatic venous outflow tract. Previous studies reported that liver stiffness (LS) was associated with liver function in some chronic liver diseases. In this study, magnetic resonance elastography was for the first time applied to investigate the LS levels of BCS patients staged with different Child-Pugh grades. As a result, significant correlation between LS levels and liver function properties was shown in BCS patients. In addition, higher LS levels were found in BCS patients with higher grades and lower LS levels were observed for patients after receiving treatment.
Introduction
MR elastography (MRE) has been increasingly used as a non-invasive tool to measure liver stiffness (LS) for patients with chronic liver diseases.1,2 The measured LS was also reported to be associated with liver function of these patients.3,4 Primary Budd-Chiari syndrome (BCS) is a rare disorder caused by the obstruction of the hepatic venous outflow tract.5 Liver function plays a crucial role in BCS treatment and prognostic evaluation.6 It is however, still unknown if LS can also be used as a clinical marker to evaluate BCS patients. Therefore, this study mainly aimed to for the first time use MRE technique to measure LS of BCS patients and then to firstly investigate the relationship between LS levels and liver function properties and secondly analyze the LS values of these BCS patients staged with different severities before treatment. In addition, their LS levels were also compared before and after clinical treatment.Materials and Methods
This clinical study was approved by the local Institution Review Board. Written informed consent was obtained from all patients.
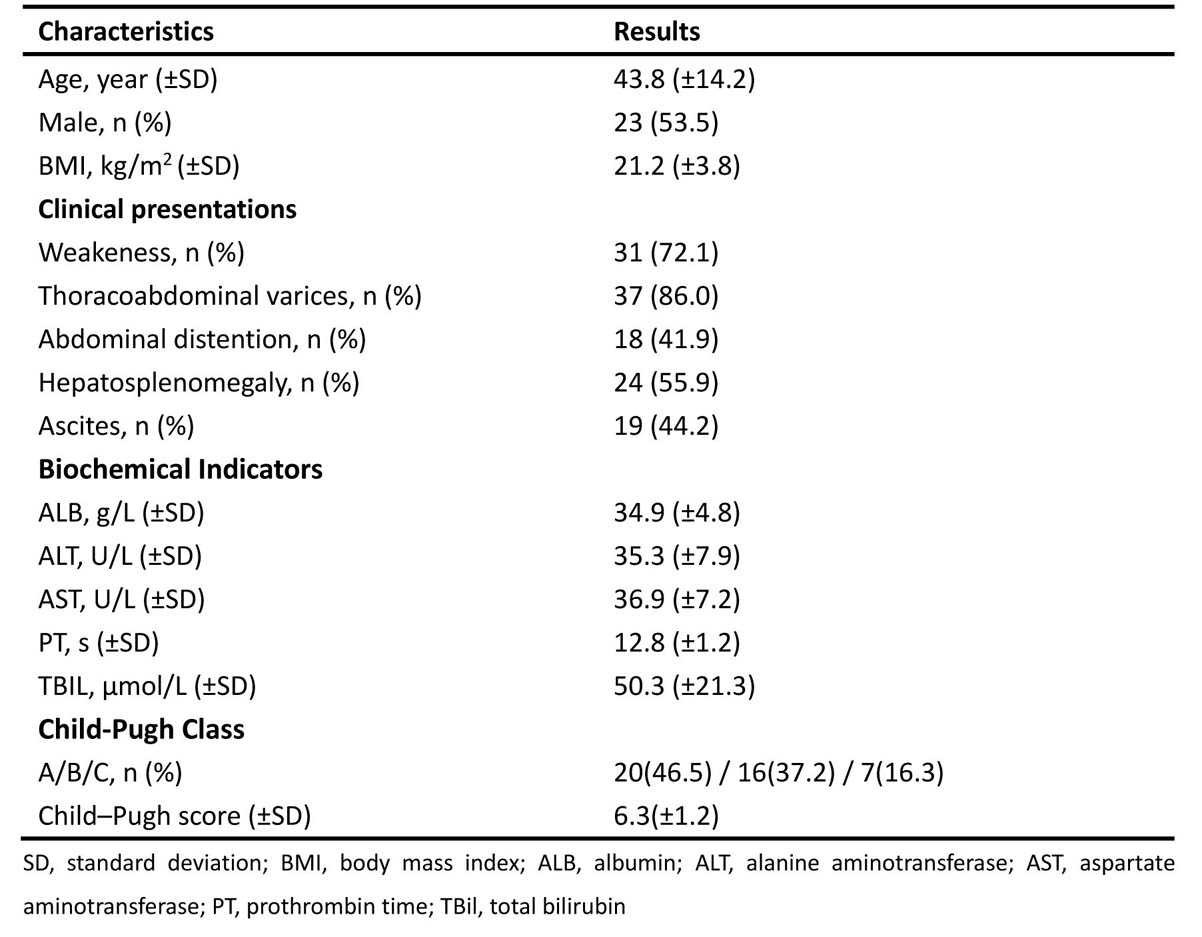
Subjects Forty-six BCS patients, confirmed with ultrasonography exams, were enrolled in this study. Among them, 43 patients (23 males and 20 females) were finally included by fulfilling the following criteria: 1) primary BCS, 2) no liver tumor. The mean levels of age and body mass index (BMI) were 43.8 ± 14.2 years old and 21.2 ± 3.8kg/m2 respectively (Table 1).The liver function of these patients was classified according to the Child-Pugh grading standard before treatment. As a result, 20 cases were graded as Child-Pugh A, 16 as Child-Pugh B and 7 as Child-Pugh C. Furthermore, clinical liver function parameters were also recorded, including albumin (ALB), alanine aminotransferase (ALT), aspartate aminotransferase (AST), prothrombin time (PT), and total bilirubin (TBIL).
MRE All patients were measured with MRE before and after BCS treatment. The corresponding time interval between scans was 2-7 days. The experiments were performed on a 3.0-T clinical unit (Discovery 750w, GE Healthcare, USA) along with a 32-element phased-array coil. A 19-cm-diameter, 1.5-cm-thick passive pneumatic driver was placed over the right rib cage at the level of the xiphoid process to generate 60Hz shear waves. A 2D spin-echo echo-planar MRE sequence was employed to acquire magnitude and unwrapped phase difference wave images using the following parameters: repetition time /echo time = 1,000/59ms, motion sensitive gradient = 80Hz, matrix size = 64×64, 8mm thickness with no gap, and 42cm field-of-view. Four transverse slices placed through the largest transverse dimension of the liver were obtained with 24-second breath-hold at the end of expiration. Wave images and elastograms for stiffness distributions were automatically computed after MRE measurement.
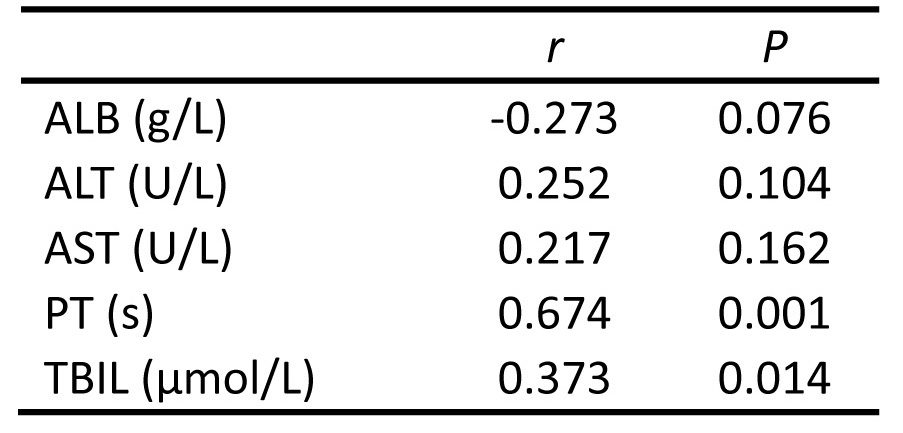
Data analysis All statistical analyses were performed using SPSS 16.0 (IBM, Chicago, IL). Pearson correlation analysis was performed to measure the correlation between LS and clinical liver function-related parameters (i.e., ALB, ALT, AST, PT and TBIL). Univariate analysis of variance test with a post hoc least significant difference test was used to compare LS of patients in three different Child-Pugh categories. Additionally, a paried t-test with a significant threshold of p=0.05 was used to compare LS of these patients before and after treatment.
Results
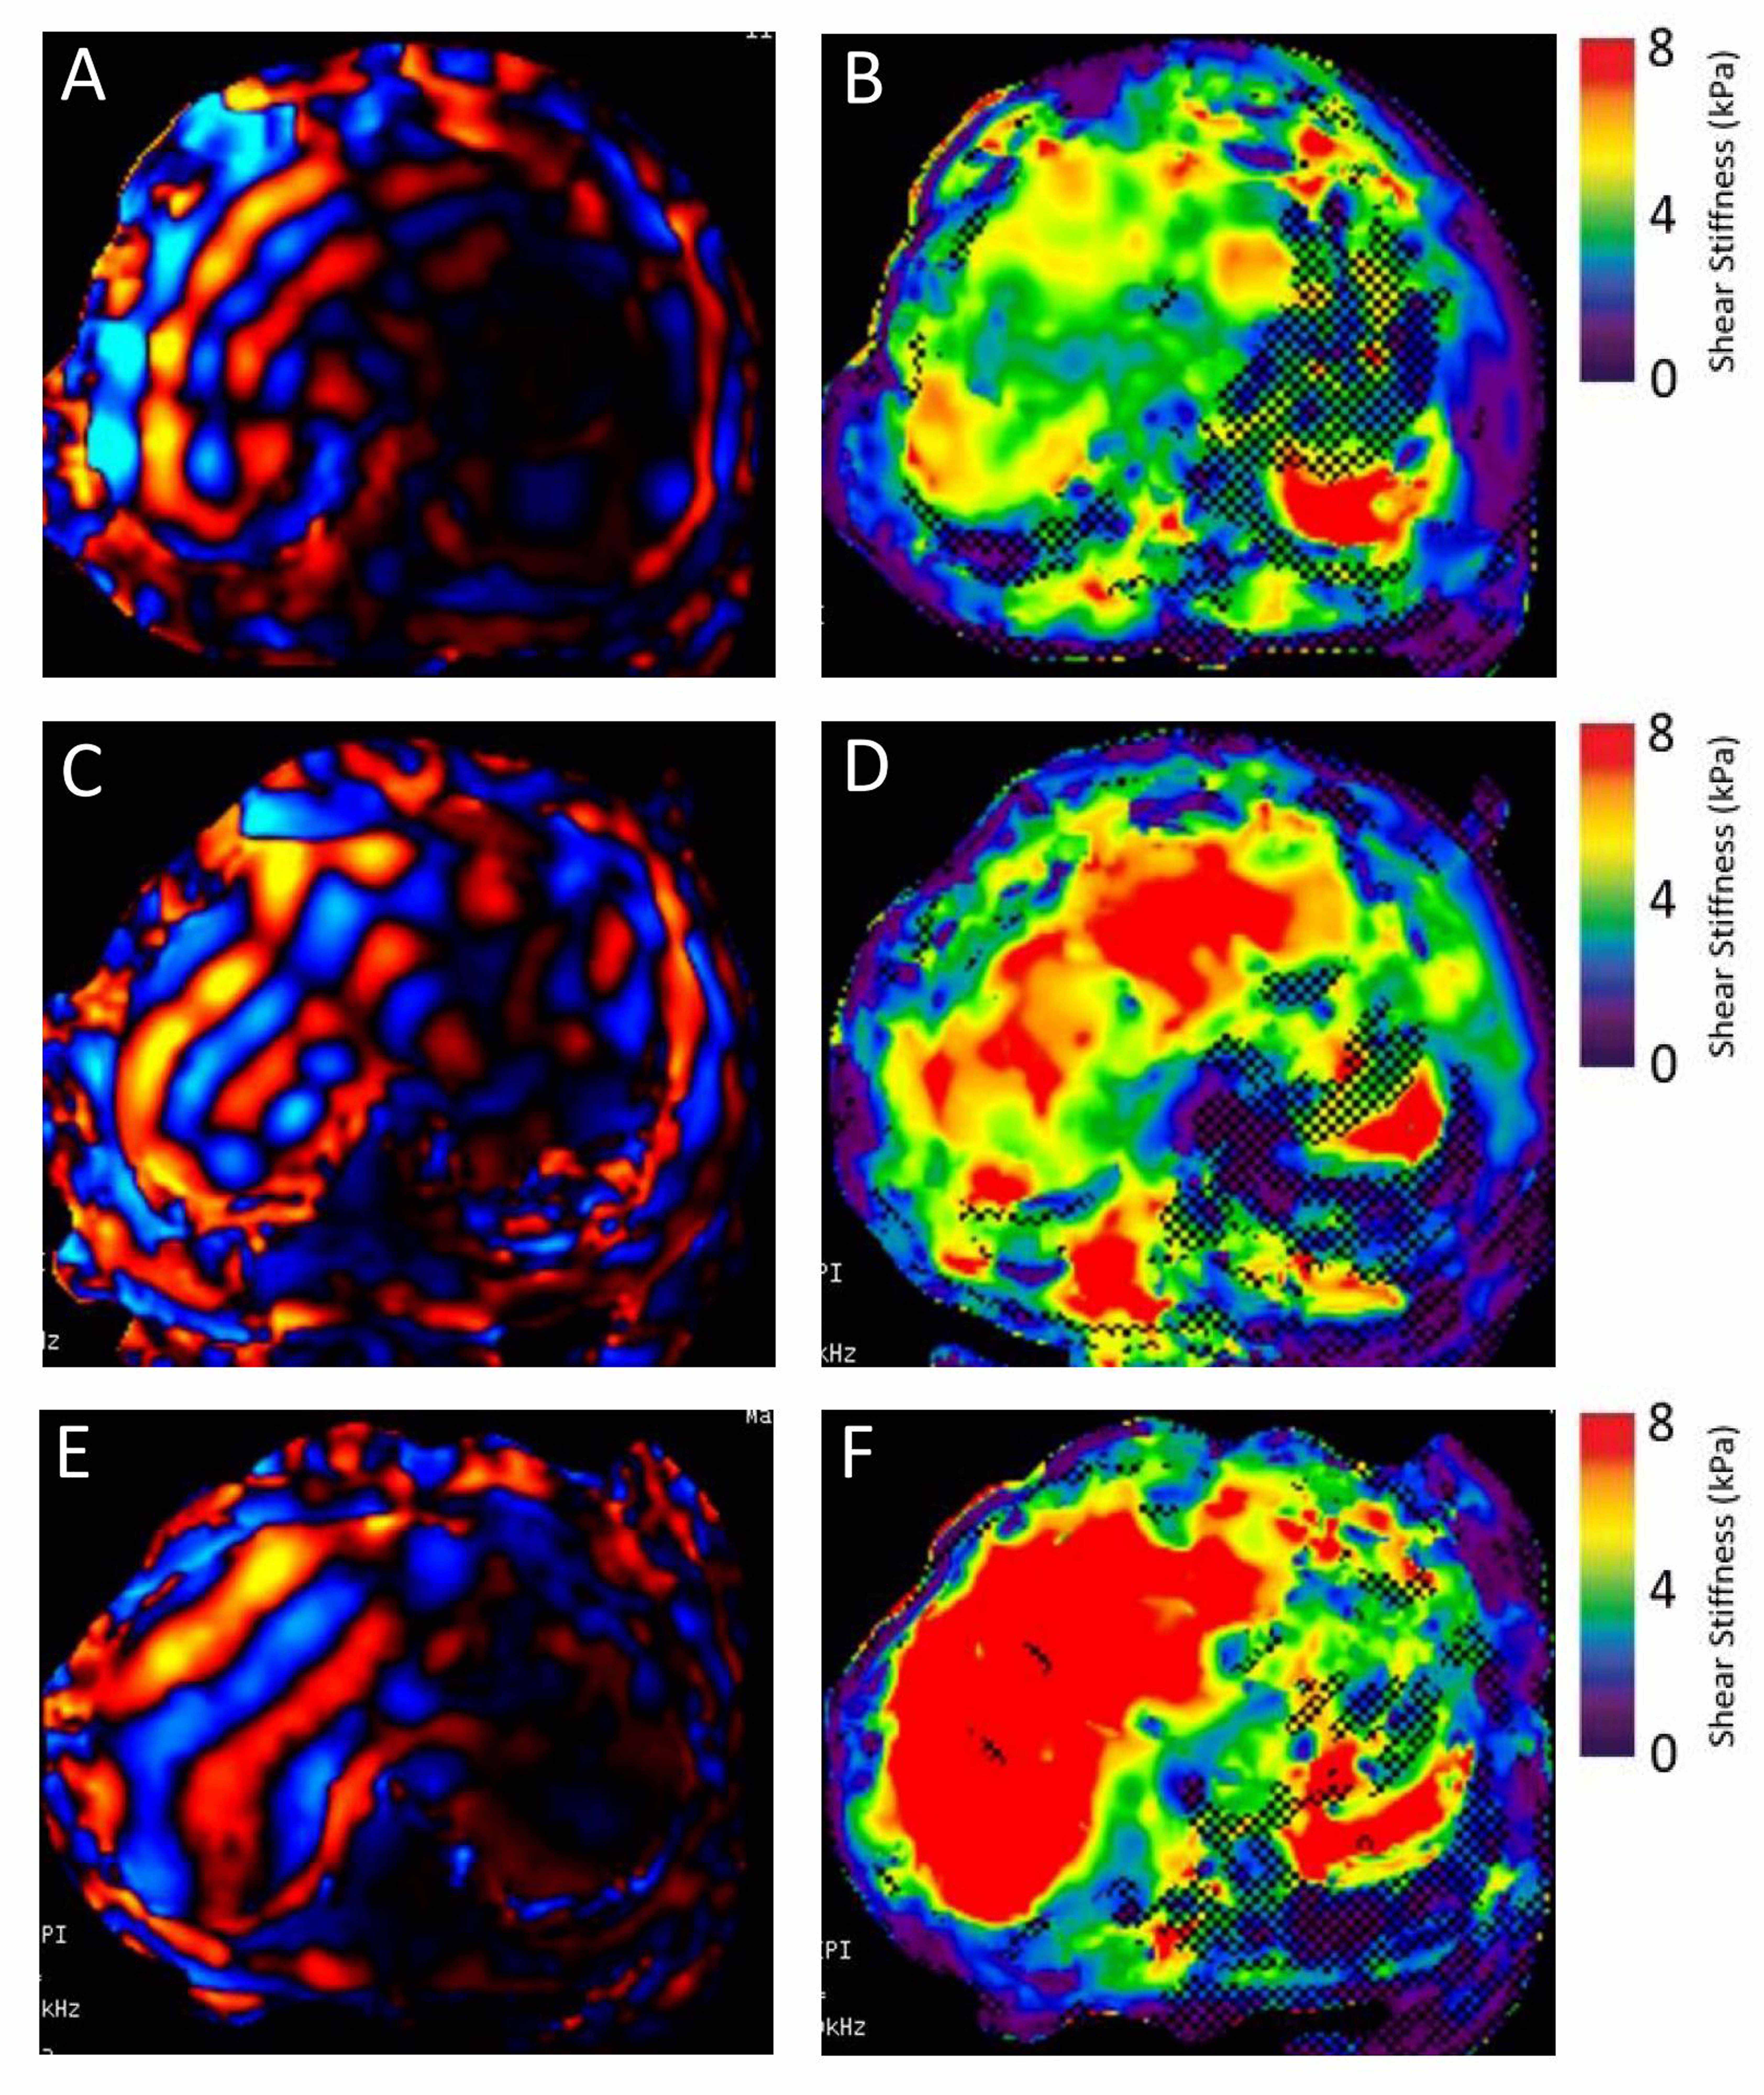
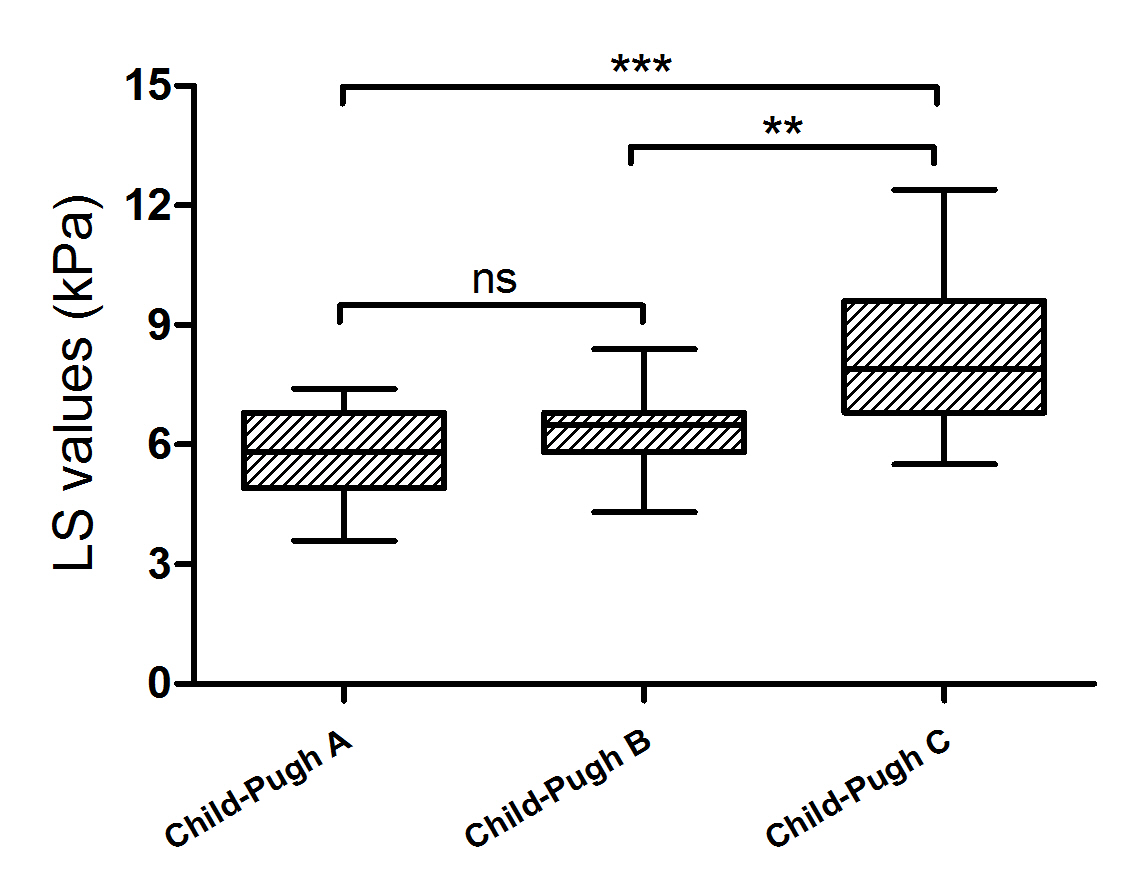
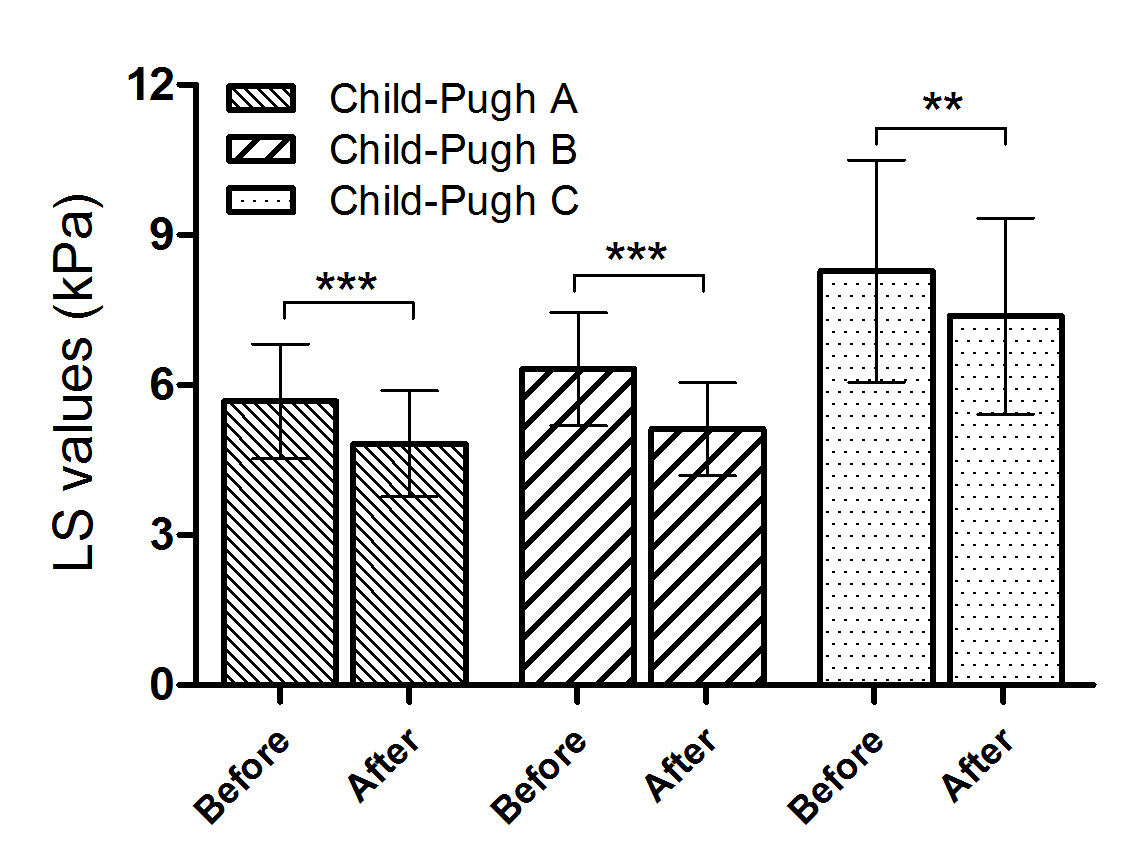
Significant correlations were, respectively, found between PT and LS (p=0.001), and between TBIL and LS (p=0.014) (Table 2). Liver stiffness also showed significant difference for patients with three different Child-Pugh grades (F=9.536, p<0.001) (Figs.1, 2). Relative to Child-Pugh C group, significantly decreased liver stiffness was found in Child-Pugh groups A (p < 0.001) and B (p=0.003), respectively (Fig.2). Comparable liver stiffness was observed between Child-Pugh groups A and B (p=0.166) (Fig.2). In addition, comparing the liver stiffness before and after treatment, a significantly decreased liver stiffness was found in all three Child-Pugh grades (Fig.3), including for Child-Pugh A: 5.67 ± 1.15kPa vs. 4.83 ± 1.06kPa, p<0.001; for Child-Pugh B: 6.31 ± 1.13kPa vs. 5.12 ± 0.93kPa, p<0.001; for Child-Pugh C: 8.27 ± 2.22kPa vs. 7.37 ± 1.96kPa, p=0.009.Discussion and conclusion
In this study, MRE technique was for the first time used to systematically measure the LS of BCS patients with different Child-Pugh grades. Significant correlation was revealed between LS and clinical liver function related parameters. In addition, measured LS also showed larger values at patients with higher Child-Pugh grades. Moreover, significant decrease of LS values was also found for the patients in all BCS grades after receiving clinical treatment.
In conclusion, MRE for LS measurement has been demonstrated to act as an effective tool to evaluate liver function, and to monitor the BCS patients in follow-up treatments.
Acknowledgements
No acknowledgement found.References
1. Yin M, Chen J, Glaser KJ, et al. Abdominal magnetic resonance elastography. Top Magn Reson Imaging. 2009;20(2):79–87.
2. Venkatesh SK, Wang G, Lim SG, et al. Magnetic resonance elastography for the detection and staging of liver fibrosis in chronic hepatitis B. Eur Radiol. 2014;24(1):70–78.
3. Recio E, Macias J, Rivero-Juarez A, et al. Liver stiffness correlates with Child-Pugh-Turcotte and MELD scores in HIV/hepatitis C virus-coinfected patients with cirrhosis. Liver Int. 2012;32(6):1031-1032.
4. Wang J, Wang Q, Yu G, et al. Correlation between liver stiffness measured by shear wave elastography and Child-Pugh classification. J Ultrasound Med. 2018;37(9): 2191-2199.
5. Plessier A, Rautou PE, Valla DC. Management of hepatic vascular diseases. J Hepatol. 2012;1(Suppl 1):25-38.
6. Su L, Hu L, Liang P, et al. Clinical efficacy of spectral computed tomography for evaluating liver function in patients with Budd-Chiari Syndrom. Acad Radiol. 2018(In Press).
Figures