0156
Glucose Uptake in Mouse Brain Detected by MRI Frequency Shifts with a Jump-Return Sequence1Russell H. Morgan Department of Radiology and Radiological Science, The Johns Hopkins University, Baltimore, MD, United States, 2F.M. Kirby Research Center for Functional Brain Imaging, Kennedy Krieger Research Institute, Baltimore, MD, United States, 3Department of Biomedical Engineering, City University of Hong Kong, Hong Kong, China
Synopsis
Neuronal activity relies on glucose metabolism for energy maintenance and abnormalities in glucose uptake and metabolism constitute a potential biomarker for many disorders, including neurodegenerative diseases. Existing MRI techniques for monitoring glucose uptake and transportation often suffer from insufficient detection sensitivity. Here, we demonstrate a jump-return MRI (JR-MRI) method with high sensitivity for monitoring glucose uptake via tracing the water-frequency shift induced by chemical exchange. Conventional MRS was performed to validate the delivery of glucose to the brain.
Introduction
Glucose metabolism is the major energy-producing pathway in the brain1 and abnormalities in glucose uptake and metabolism constitute a potential biomarker for many disorders, including neurodegenerative diseases. Hence, a noninvasive molecular imaging approach to reveal the glucose transportation and utilization is highly desirable. Traditional in vivo 13C- and 1H-magnetic resonance spectroscopy (MRS) approaches2-4 have proven successful in studying fundamental metabolic processes during glucose infusion. However, their clinical applications are constrained by the extremely low detection sensitivity. More recently, chemical exchange saturation transfer (CEST)5-8 T2 relaxation9, and T1ρ techniques10-12 have received broad interests for monitoring glucose uptake. A remaining issue lies in the relatively low sensitivity for those techniques, particularly at clinical field strengths. Therefore, we developed a sensitive MRI sequence to monitor cerebral glucose uptake using chemical shift “displacement” of the water resonance induced by the exchange process.Methods
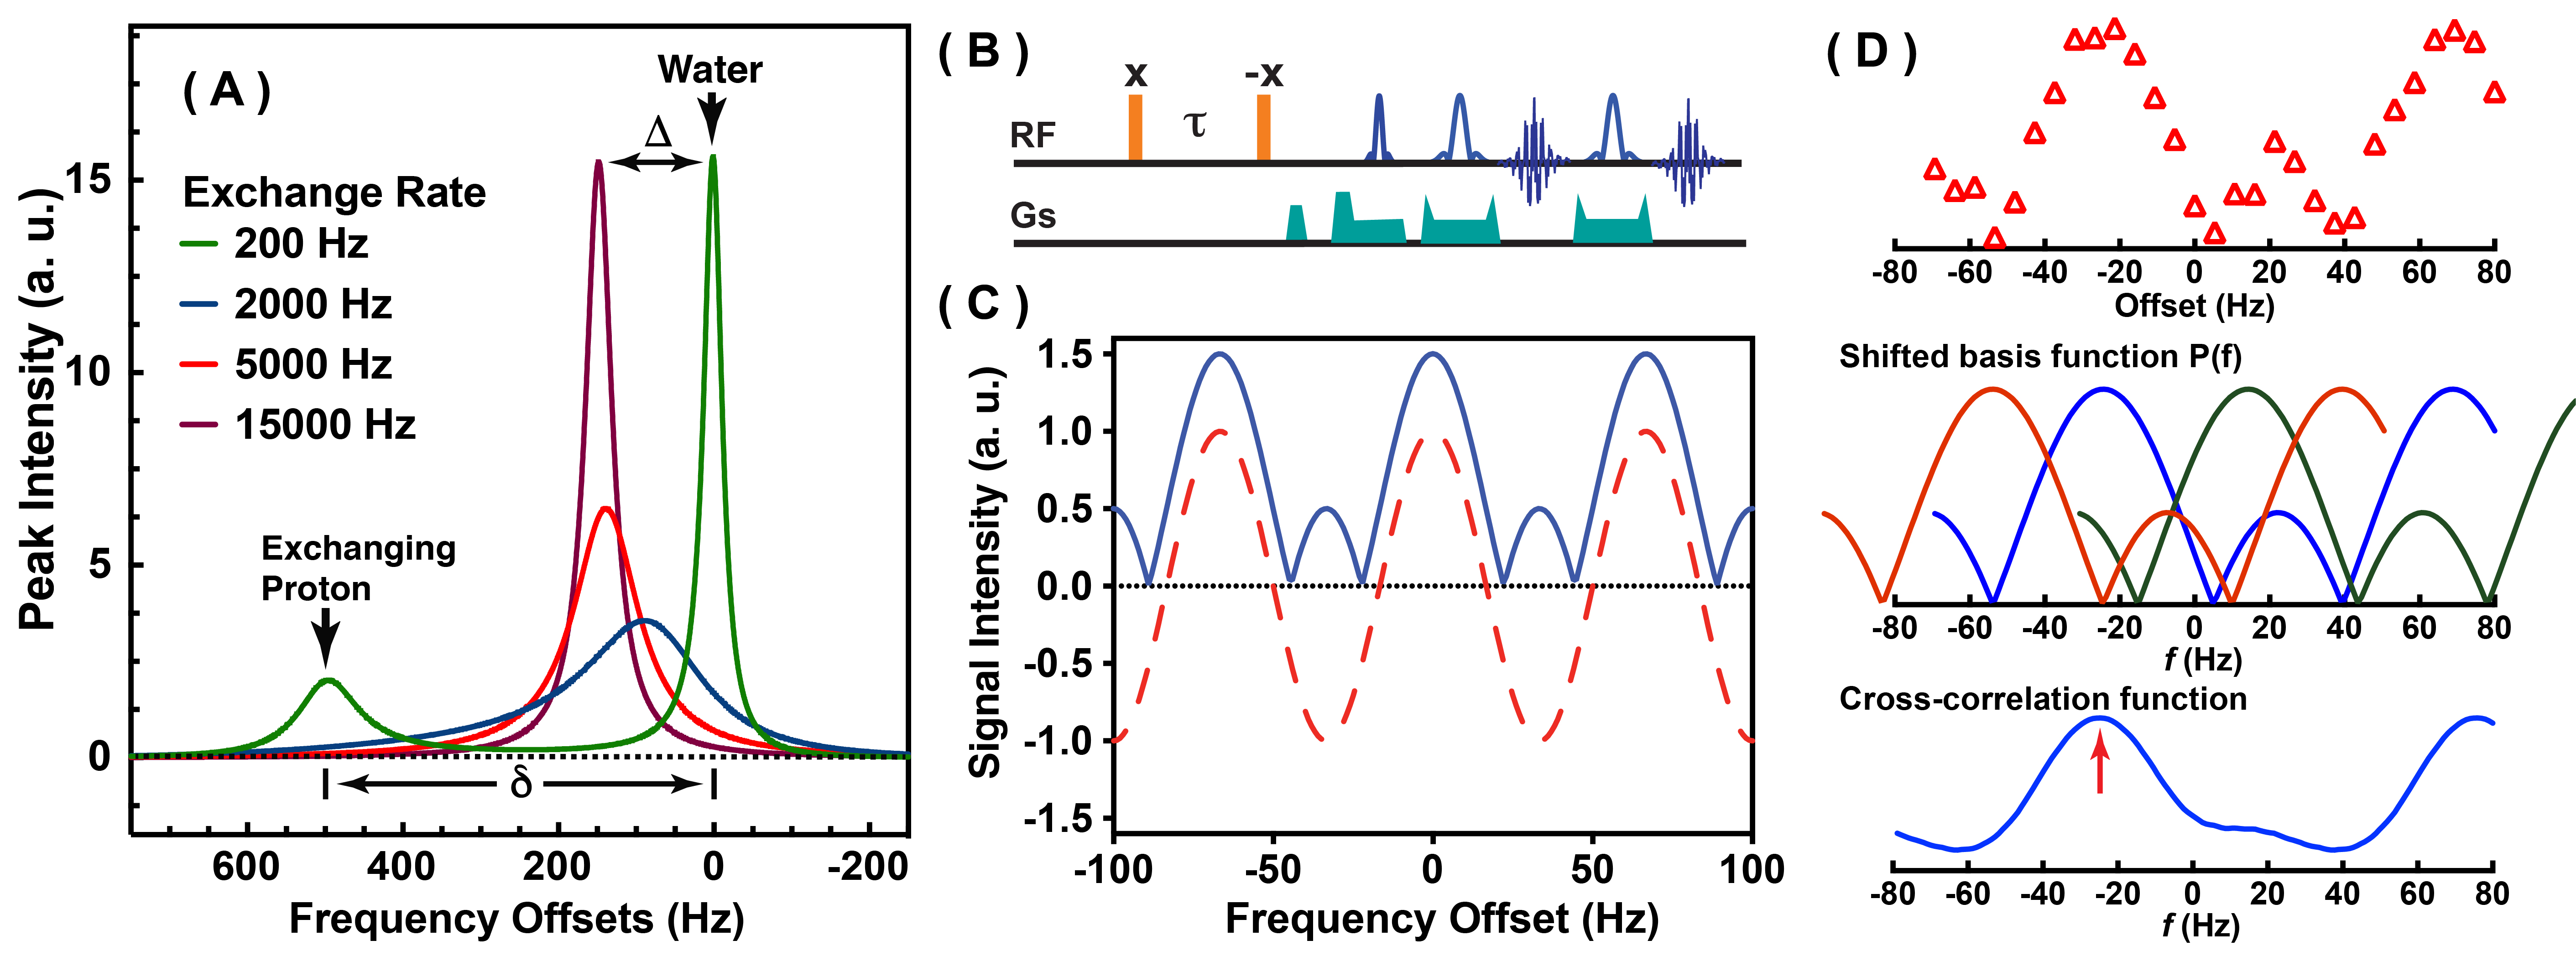
As shown in Fig. 1A, the water frequency can be shifted by the chemical-exchange process in the fast-exchanging limit13,14. Water frequency shift Δ is determined by the population fraction f of the exchangeable protons with respect to the water protons and resonance frequency offset δ of exchangeable protons, namely,
Δ=f·δ (1)
Although phase imaging with gradient-echo MRI15-17 can be used to detect frequency shifts, here we focus on a highly sensitive technique based on the Jump-Return (JR) sequence (Fig. 1B) to improve the detectability. When using a series of frequency offsets, water magnetization will not always fully recover after the second 90-degree pulse due to the off-resonance evolution during the JR module. Consequently, MRI signal exhibits an amplitude-mode sinusoidal pattern that can be mathematically described as
P(f)=a|(1-b)+b·sin[2π(f-f0)τ]| (2)
where τ is the inter-pulse delay, a is the intensity of the JR oscillation curve and b the factor reflecting the intensity offset of the JR function due to the T1 and T2 relaxation times. This function is plotted in Fig. 1C with Eq. 2 and a sample JR-MRI data of mouse brain (11.7T) is shown in Fig. 1D (τ=10ms). Fitting procedures are as follows: first, a cross-correlation function (CCF) P*D(f0) was calculated between experimental data D(f) and shifted basis function P(f). Maximum cross-correlation leads to identification of water offset f0. Other parameters can then be obtained by fitting f0 and D(f) to Eq. (2). Water offset differences linearly correspond to the glucose uptake concentration.
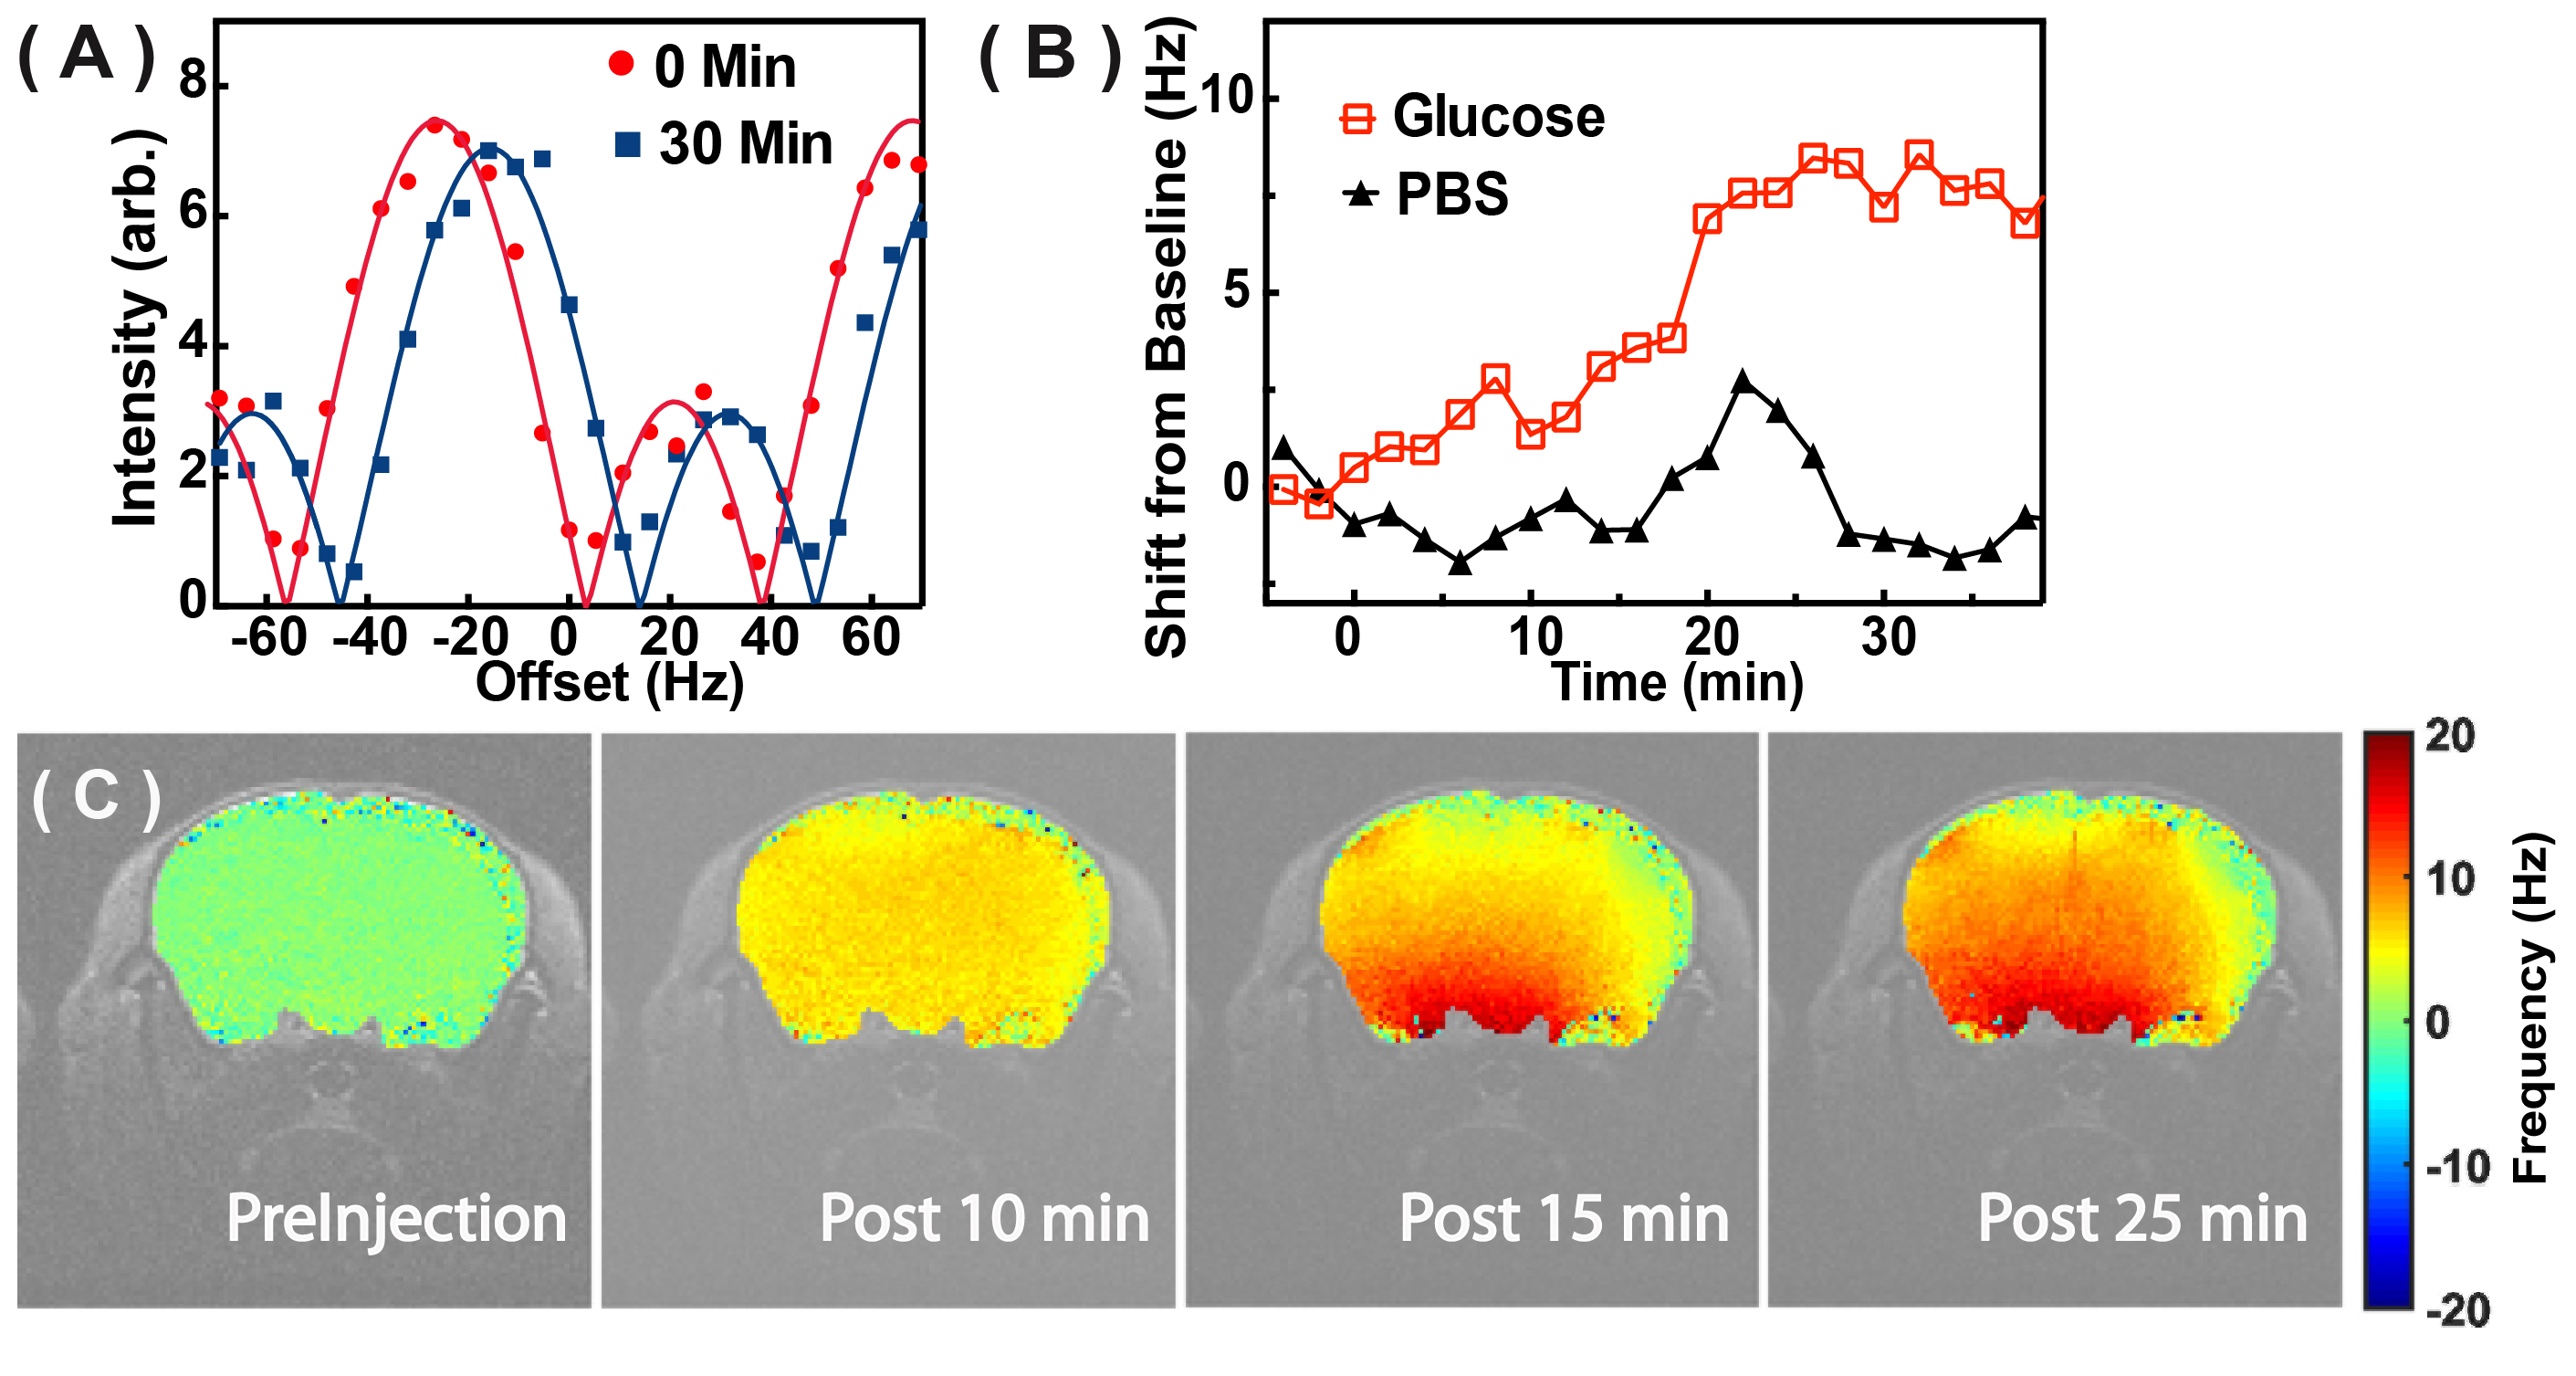
Experiments were performed at 11.7T. Experiments were approved by the local IACUC. We first observed wild type mice (n=3) with JR-MRI (inter-pulse delay τ=10 ms, 31 uniformly-distributed offsets sweeping from -80.0 to 80.0 Hz, single-slice, matrix=128×128, thickness=0.5 mm, turbo spin-echo acquisition, scan time=2 min) after intravenous administration of 0.15 mL 50% dextrose following a procedure described previously18,19. As a control, 0.15 mL of phosphate-buffered saline (PBS) was administered similarly in other mice (n=2). Otherwise, in vivo 1H- MRS (STEAM, 2×2×2 mm3, TE=3.0 ms, TR=2.5 s) was collected with glucose infusion as a reference for glucose uptake. JR-MRI was repeated for dynamic observation across 40 min with the first 3 scans as baseline.
Results and Discussion
Dynamic evolution of Δ with glucose infusion of a representative pixel is plotted in Fig. 2B. It can be observed that the frequency quickly increases during the first 20 minutes after glucose injection and reaches a plateau afterward (7.5 Hz). By contrast, dynamic evolution of Δ after PBS infusion does not show clear variation (< 2.0 Hz). Pixel-wise Δ maps for several typical time points before and after the glucose infusion are presented in Fig. 2C. In the initial 5 min, glucose uptake is uniform across the brain. After that, brain regions around the anterior cerebral artery show high levels of glucose uptake, which then spread to other regions of the brain.
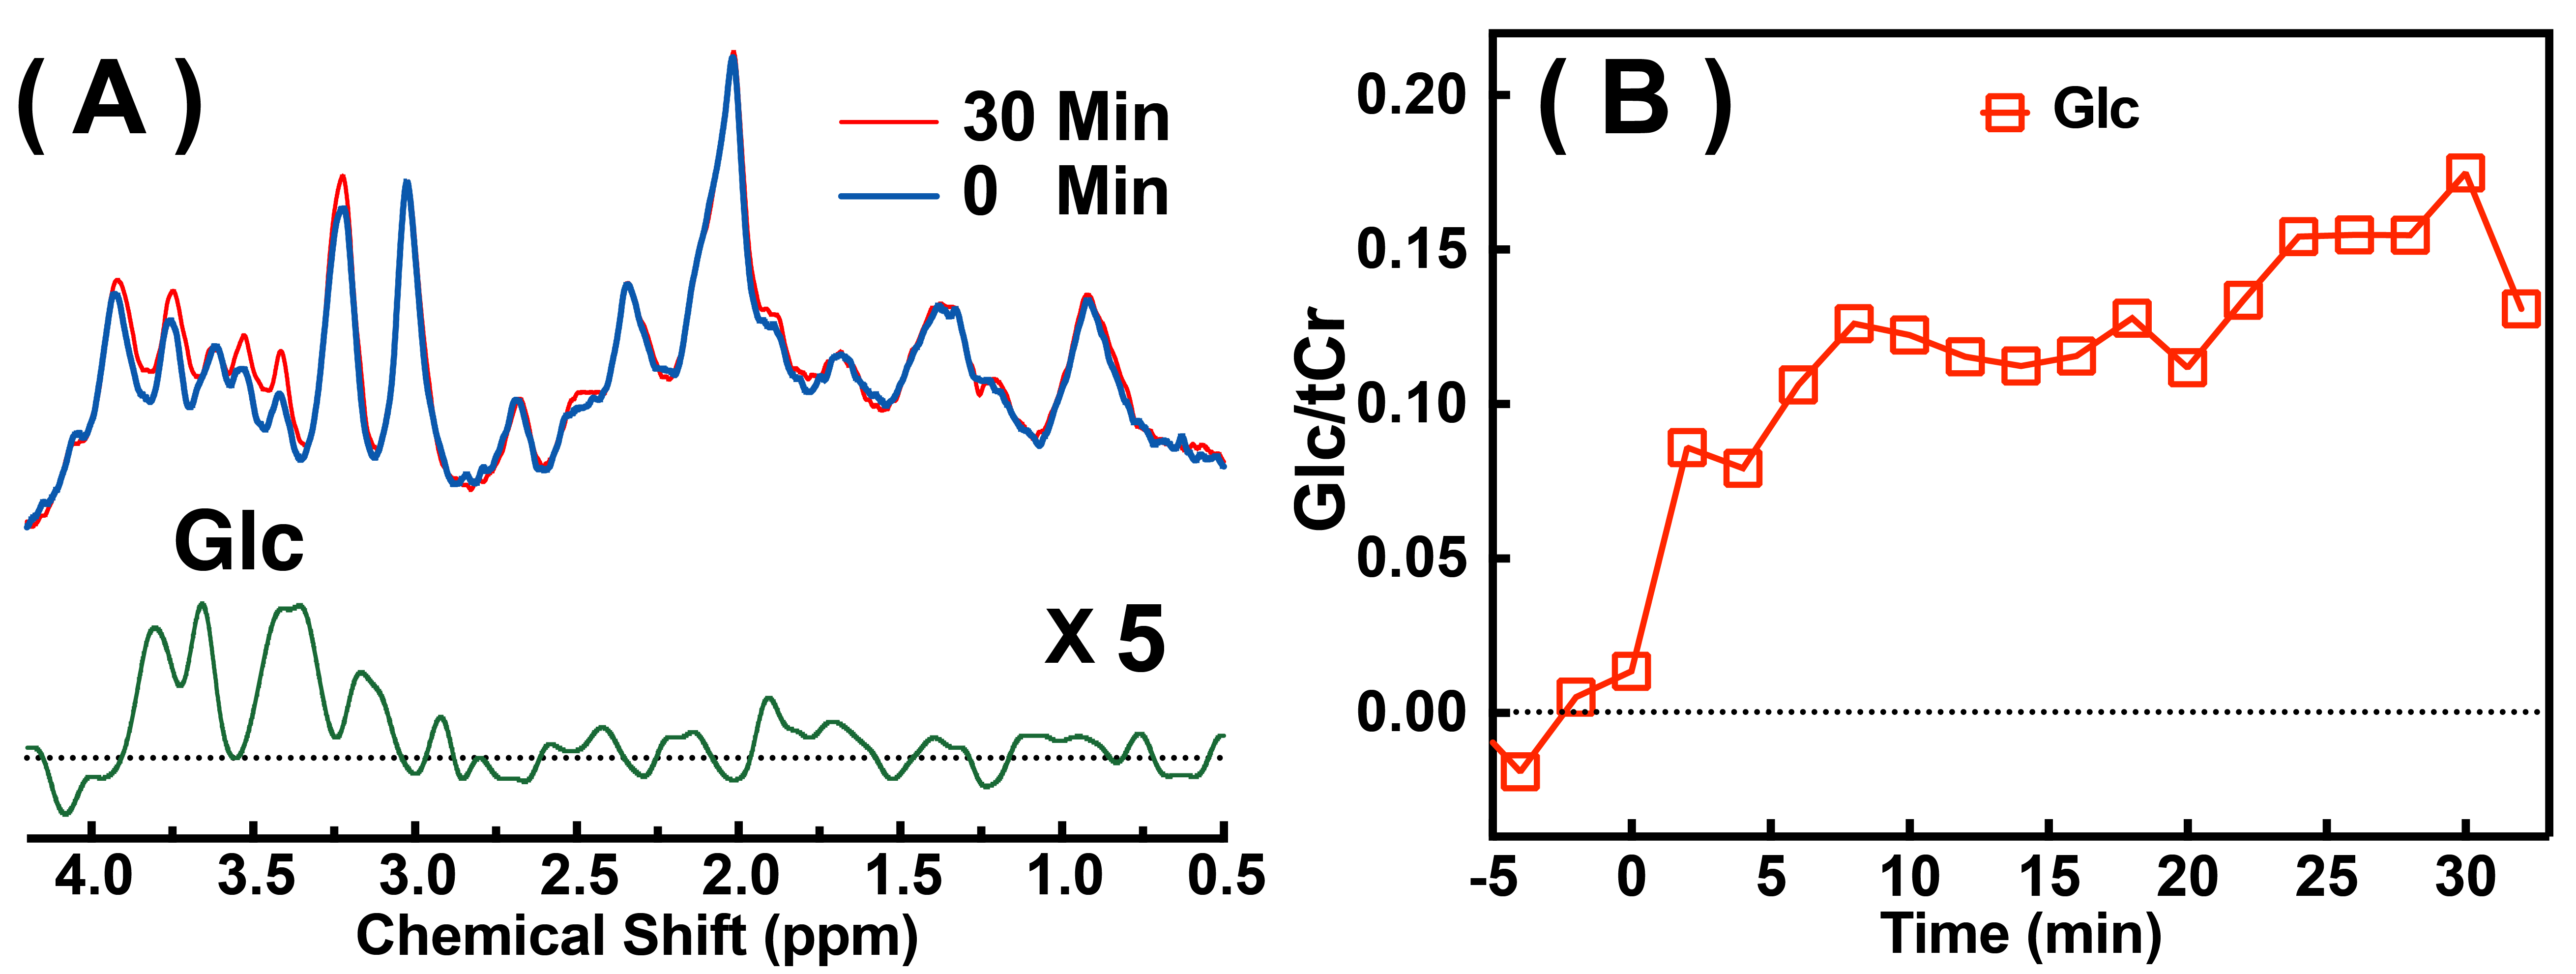
Typical MRS spectra of mouse brain before and after (30 min) glucose infusion, as well as the difference spectrum, are plotted in Fig. 3. The aliphatic glucose resonance peaks, in the chemical shift range of 3.0-4.0 ppm, increased substantially and are clearly evident in the difference spectrum. The dynamic change in the glucose concentration (Fig. 3B) shows a similar intensity curve shape as that measured via the JR-MRI method (Fig. 2B).
Conclusion
We demonstrate that the water frequency shift can be used as a sensitive method to study glucose uptake after intravenous glucose infusion. More studies are needed to interpret the glucose uptake quantitatively.Acknowledgements
Funding Support: NIH: R01EB015032, P41EB015909, R03NS109664 and DOD CDMRP AZ170028. Z. Wei and H. Zeng contributed equally.References
1. Siesjo B. Brain energy metabolism. New York: Wiley; 1978.
2. Mason GF, Rothman DL, Behar KL, et al. NMR determination of the TCA cycle rate and alpha-ketoglutarate/glutamate exchange rate in rat brain. J Cereb Blood Flow Metab. 1992; 12(3):434-47.
3. Gruetter R, Adriany G, Merkle H, et al. Broadband decoupled, H-1 localized C-13 MRS of the human brain at 4 tesla. Magn Reson Med. 1996; 36:559-664.
4. Gruetter R, Novotny EJ, Boulware SD, et al. 1H NMR studies of glucose transport in the human brain. J Cereb Blood Flow Metab. 1996; 16(3):427-38.
5. Chan KWY, McMahon MT, Kato Y, et al. Natural D-glucose as a biodegradable MRI contrast agent for detecting cancer. Magn Reson Med. 2012; 68(6):1764-73.
6. Walker-Samuel S, Ramasawmy R, Torrealdea F, et al. In vivo imaging of glucose uptake and metabolism in tumors. Nat Med. 2013; 19(8):1067-72.
7. Xu X, Chan KWY, Knutsson L, et al. Dynamic glucose enhanced (DGE) MRI for combined imaging of blood–brain barrier break down and increased blood volume in brain cancer. Magn Reson Med. 2015; 74(6):1556-63.
8. Kentrup D, Bovenkamp P, Busch A, et al. GlucoCEST magnetic resonance imaging in vivo may be diagnostic of acute renal allograft rejection. Kidney Int. 92(3):757-64.
9. Yadav NN, Xu J, Bar-Shir A, et al. Natural D-glucose as a biodegradable MRI relaxation agent. Magn Reson Med. 2014; 72(3):823-8.
10. Jin T, Mehrens H, Hendrich KS, et al. Mapping brain glucose uptake with chemical exchange-sensitive spin-lock magnetic resonance imaging. J Cereb Blood Flow Metab. 2014; 34(8):1402-10.
11. Zu Z, Spear J, Li H, et al. Measurement of regional cerebral glucose uptake by magnetic resonance spin-lock imaging. Magn Reson Imag. 2014; 32(9):1078-84.
12. Jin T, Mehrens H, Wang P, et al. Chemical exchange-sensitive spin-lock MRI of glucose analog 3-O-methyl-d-glucose in normal and ischemic brain. J Cereb Blood Flow Metab. 2018; 38(5):869-880.
13. Zhong K, Leupold J, von Elverfeldt D, et al. The molecular basis for gray and white matter contrast in phase imaging. NeuroImage. 2008; 40(4):1561-6.
14. Shmueli K, Dodd SJ, Li TQ, et al. The contribution of chemical exchange to MRI frequency shifts in brain tissue. Magn Reson Med. 2011; 65(1):35-43.
15. Haacke EM, Liu S, Buch S, et al. Quantitative susceptibility mapping: current status and future directions. Magn Reson Imag. 2015; 33(1):1-25.
16. Lim IA, Li X, Jones CK, et al. Quantitative magnetic susceptibility mapping without phase unwrapping using WASSR. Neuroimage. 2014; 86:265-79.
17. Duyn JH, van Gelderen P, Li TQ, et al. High-field MRI of brain cortical substructure based on signal phase. Proc Natl Acad Sci U S A. 2007; 104(28):11796-801.
18. Xu X, Xu J, Chan KWY, et al. GlucoCEST imaging with on-resonance variable delay multiple pulse (onVDMP) MRI. Magn Reson Med. 2018; doi:10.1002/mrm.27364.
19. Xu X, Chan KW, Knutsson L, et al. Dynamic glucose enhanced (DGE) MRI for combined imaging of blood-brain barrier break down and increased blood volume in brain cancer. Magn Reson Med. 2015; 74(6):1556-63.
20. Zhang XY, Xie J, Wang F, et al. Assignment of the molecular origins of CEST signals at 2 ppm in rat brain. Magn Reson Med. 2017; 78(3):881-7.
Figures