0155
Quantitative assessment of the degeneration of the superior cerebellar peduncle in Friedreich’s ataxia at 7 T: susceptibility, diffusion anisotropy, and T2 and T1 relaxometry1Division of Medical Physics in Radiology, German Cancer Research Center, Heidelberg, Germany, 2Faculty of Physics and Astronomy, Heidelberg University, Heidelberg, Germany, 3Department of Neuroradiology, Medical University Innsbruck, Innsbruck, Austria, 4Department of Neurology, Medical University Innsbruck, Innsbruck, Austria, 5Faculty of Medicine, Heidelberg University, Heidelberg, Germany
Synopsis
Friedreich’s ataxia is a rare disease involving degenerative processes within white matter fiber tracts, spinal nerves and the cerebellum. A correlation of patients’ clinical status and superior cerebellar peduncle atrophy has been shown in MR volumetry studies. The ongoing ultra-high field study presented here assesses the degeneration of the superior cerebellar peduncle in Friedreich’s ataxia with quantitative MR parameters – susceptibility, diffusion anisotropy, and T2 and T1 relaxometry. Statistically significant differences between fractional anisotropy as well as T2 values in patients and healthy controls could be observed, indicating that these quantitative MRI methods potentially provide valuable biomarkers to assess the course of Friedreich’s ataxia.
INTRODUCTION
Despite the fact that Friedreich’s ataxia is a rare disease, it is the most common inherited ataxia with early onset of clinical manifestations.1 A correlation of superior cerebellar peduncle (SCP) atrophy and patients’ clinical status has been shown in magnetic resonance imaging (MRI) studies assessing SCP volume.2,3 However, pathological white matter changes in Friedreich’s ataxia have not been assessed using quantitative MRI methods such as relaxometry, susceptibility mapping and diffusion tensor imaging. Moreover, assessing fine fiber structures, such as the superior cerebellar peduncle, benefits from ultra-high field MRI due to the higher resolution and higher contrast-to-noise ratios achievable, thereby minimizing partial volume effects and facilitating better structural delineation.METHODS
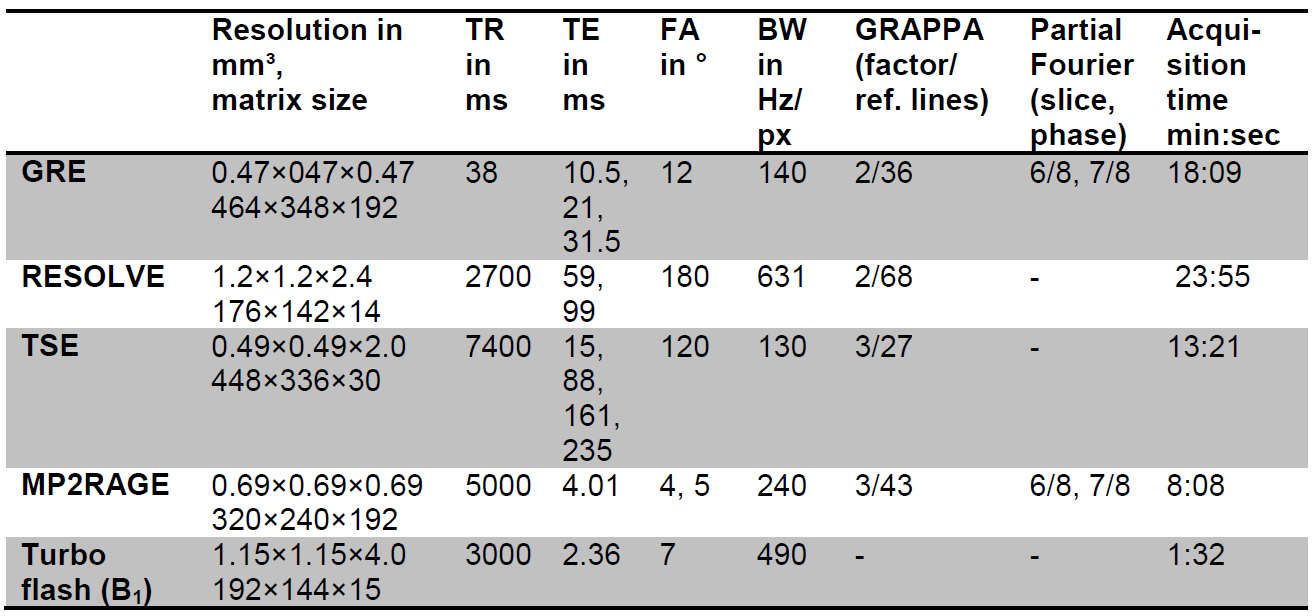
The study was conducted in accordance with the Declaration of Helsinki. Institutional review board approval was obtained and all subjects provided written informed consent. Eight Friedreich’s ataxia patients (mean age 38 ± 15 years; four female) and six healthy controls (mean age 46 ± 16 years; four female) were scanned on a 7 T whole-body MR system (Magnetom 7 T, Siemens Healthcare, Germany) with a 8Tx/32Rx-channel head coil (Nova Medical Inc., Wakefield, MA, USA) driven in CP+ mode by use of an in-house-constructed Butler matrix. The following sequences were acquired: a monopolar 3D gradient-echo (GRE), a multi-echo turbo spin echo (ME-TSE) with turbo factor 5, a 2D readout segmentation of long variable echo-trains (RESOLVE)4,5 in stimulated echo acquisition mode (STEAM)6,7 with two diffusion weightings (b = 50 s/mm2, b = 800 s/mm2) and 20 diffusion directions, a MP2RAGE with inversion times of 900 ms and 2750 ms, and a pre-saturation‐based 2D turbo flash for B1 mapping. All other sequence parameters are shown in Table 1.
For susceptibility map generation, phase data were combined on the scanner using ASPIRE8, and brain masks were generated from the first echo of the magnitude images using FSL-BET9. Phase images were unwrapped using Laplacian-based phase unwrapping10-12, and the background field was removed with V-SHARP11,12 with kernel size up to 12 mm. Susceptibility maps were calculated in Matlab (R2017b, MathWorks, Natick, USA) using the STAR-QSM algorithm13. Susceptibility maps were referenced to cerebrospinal fluid in the atrium of the lateral ventricles.
T2 maps were generated form the ME-TSE data and the B1 map using a dictionary-based method14. For T1 mapping and diffusion fractional anisotropy, vendor-provided maps were used.
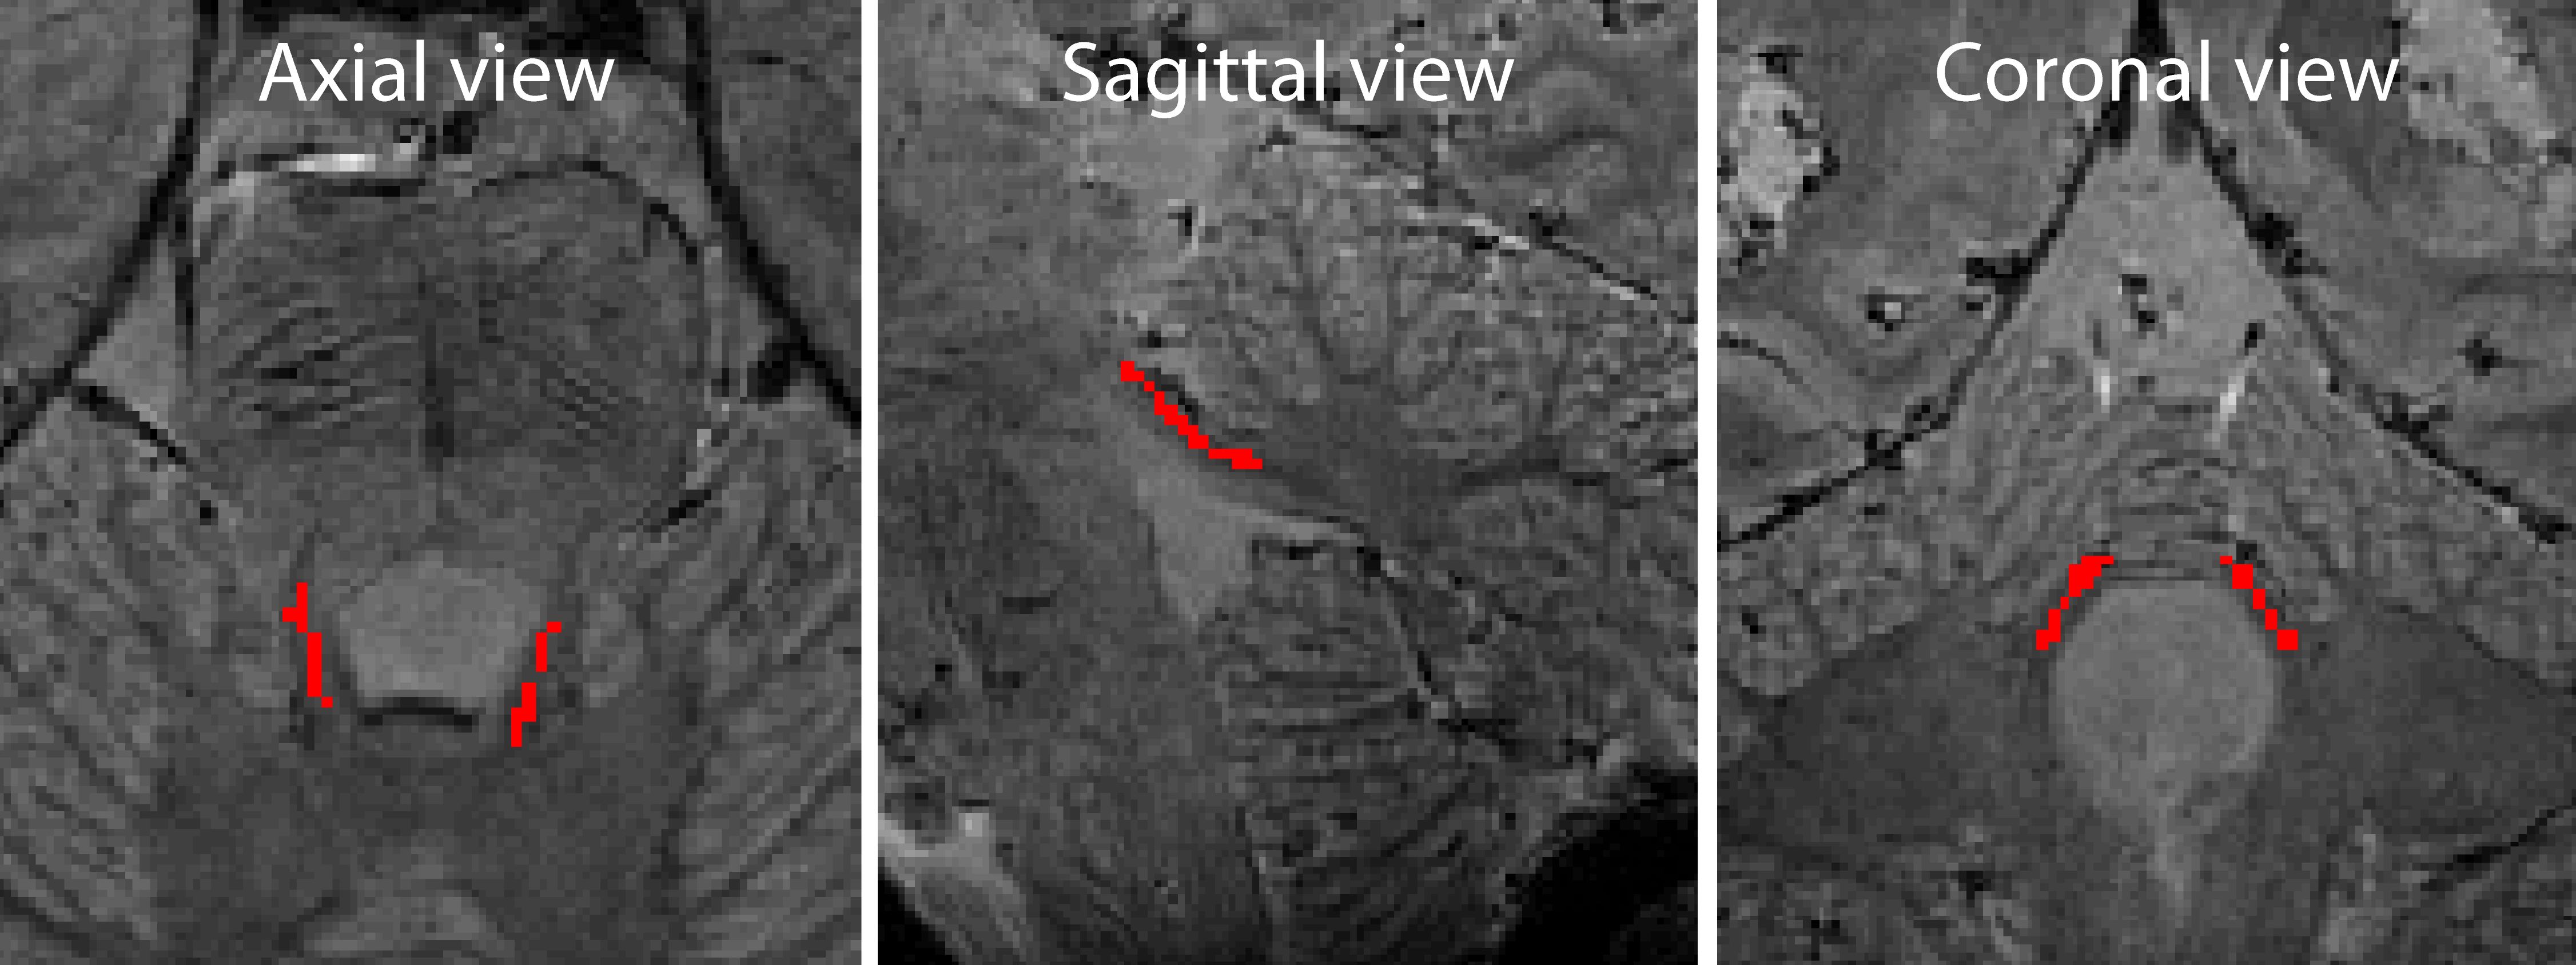
Volumes of interest (VOIs) (see Figure 1) in the superior cerebellar peduncle were manually drawn on each contrast using the Medical Imaging Interaction Toolkit (MITK)15,16. Differences observed for susceptibility values, diffusion fractional anisotropy, and T2 and T1 values were assessed using a two sample t-test in Matlab. A p-value of less than 0.05 was considered statistically significant.
RESULTS
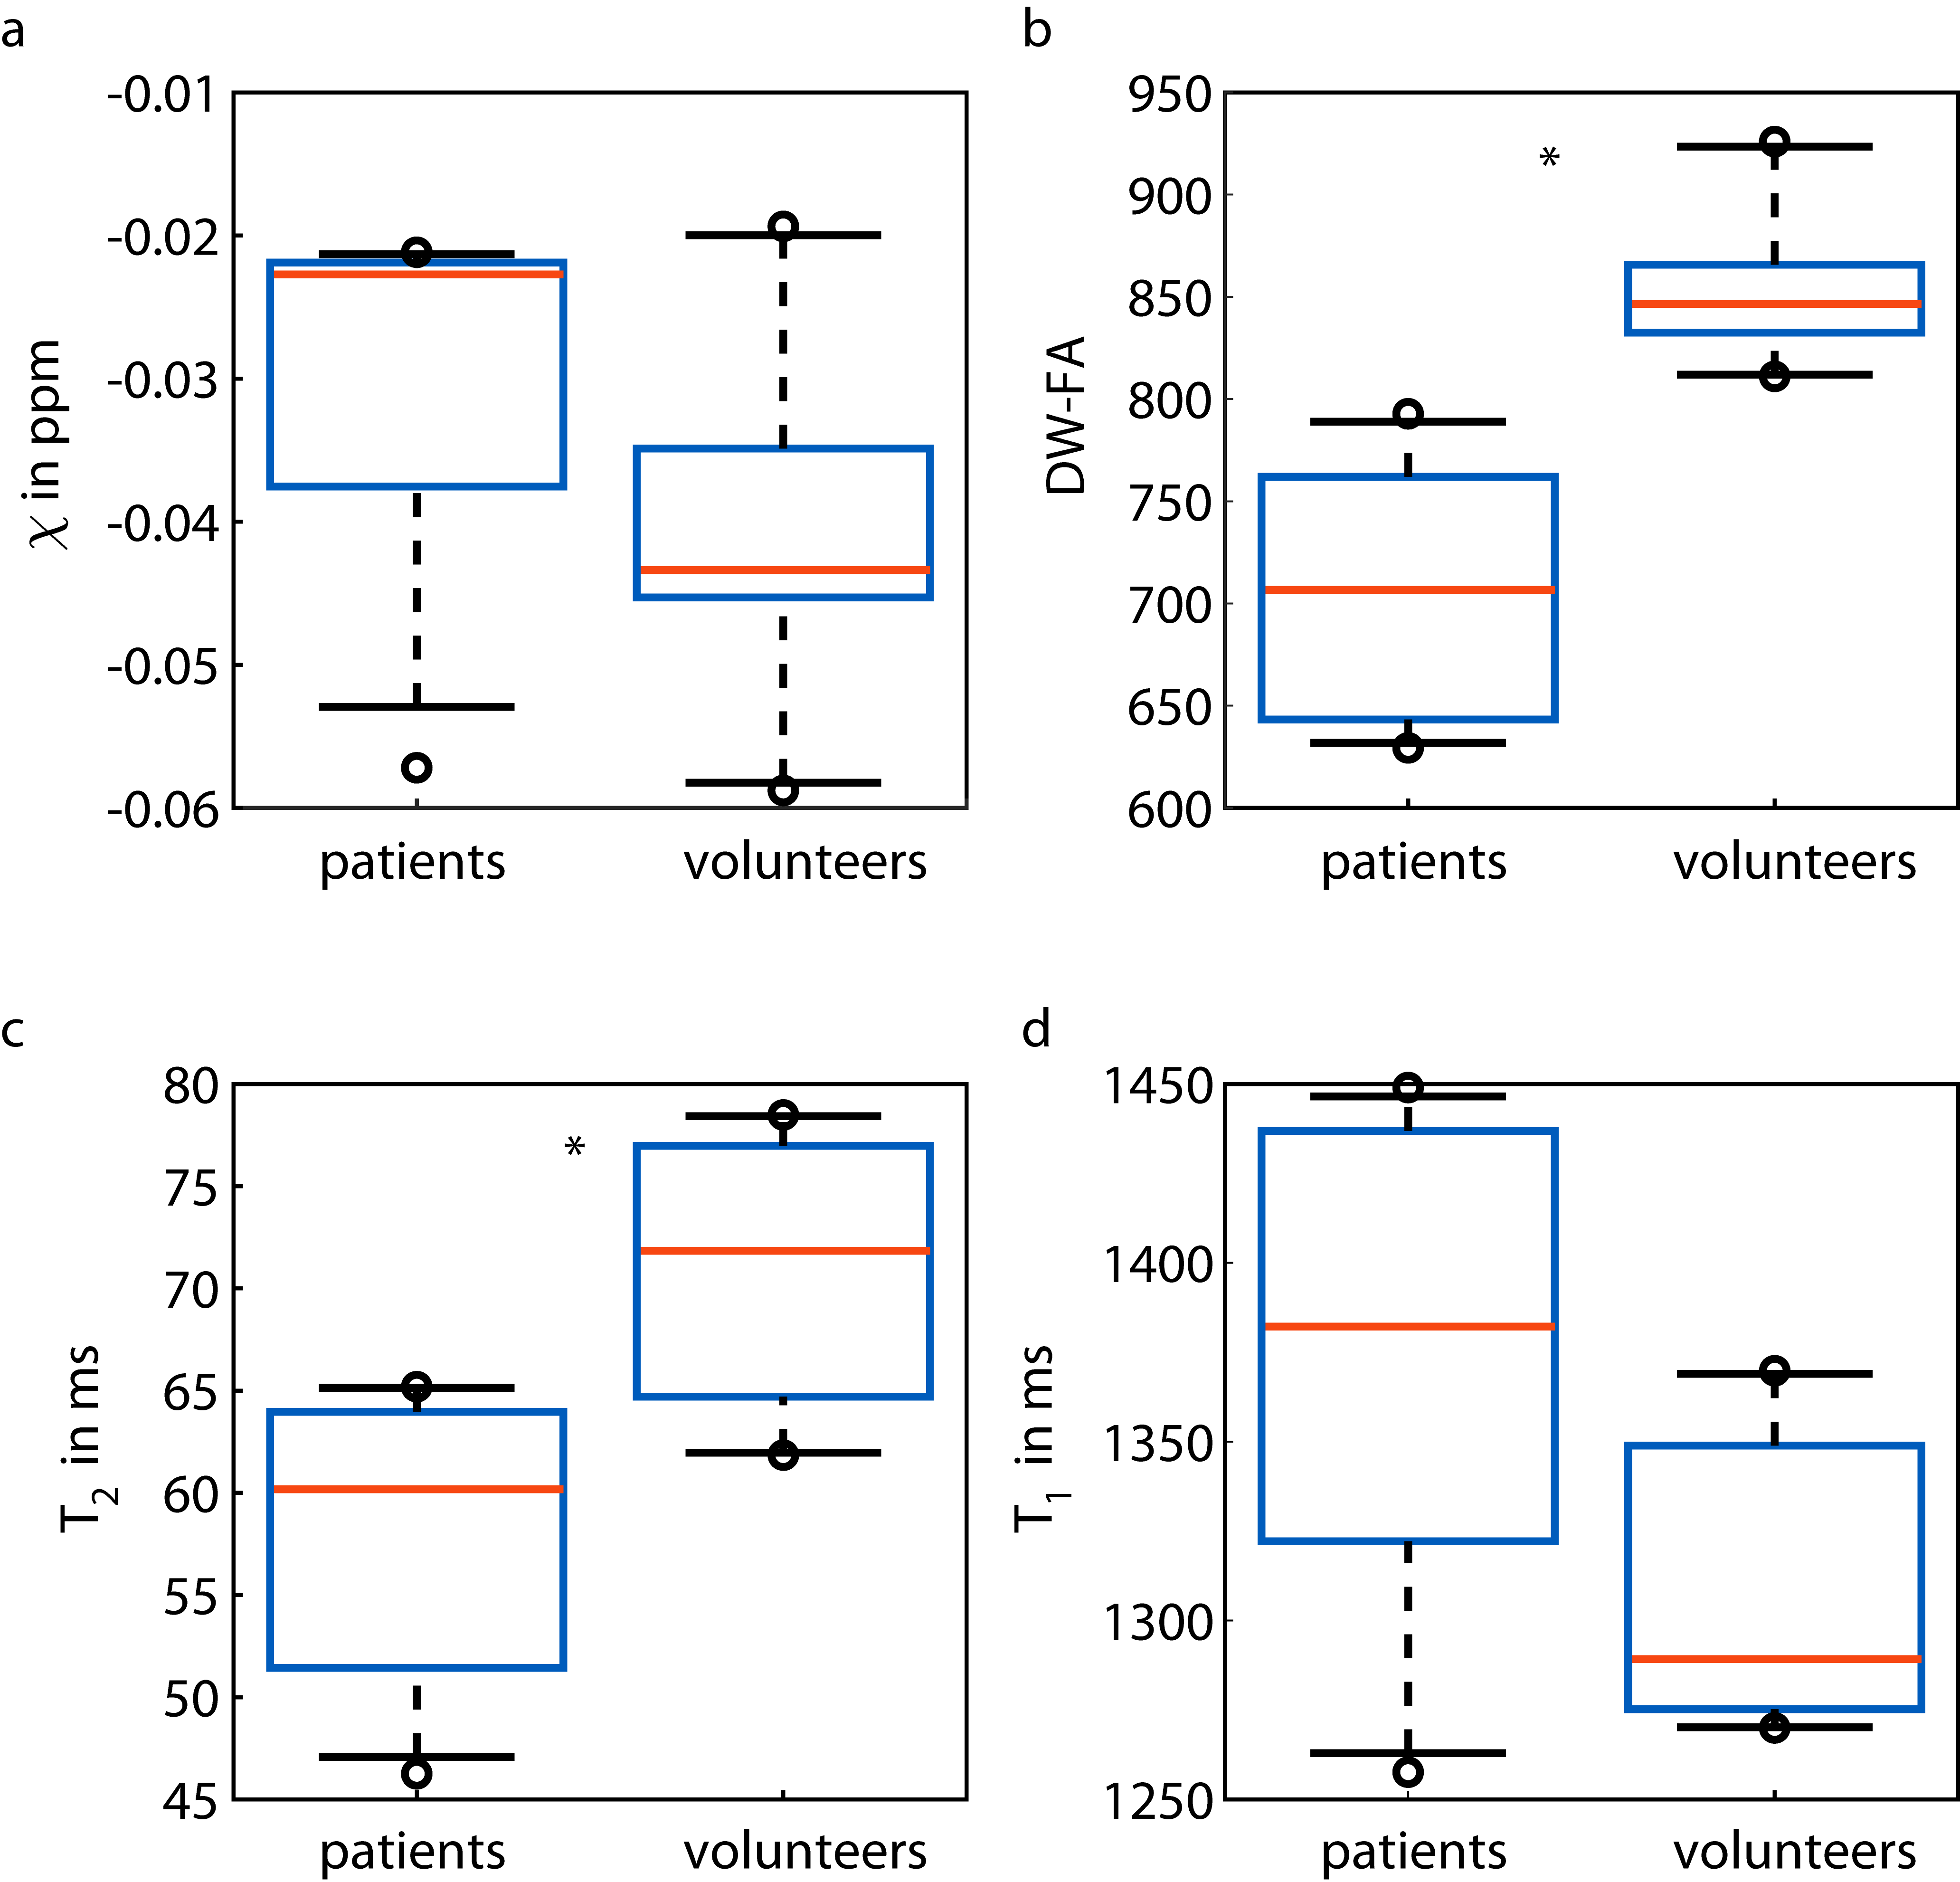
Figure 2 shows box plots of susceptibility values, diffusion fractional anisotropy values, and T2 and T1 values of the superior cerebellar peduncle in Friedreich’s ataxia patients and healthy controls. The SCP had a median susceptibility of −0.023 ppm for patients and −0.043 ppm for controls, median diffusion fractional anisotropy of 0.71/ 0.85 for patients/ controls, median T2 values of 60/ 72 ms for patients/ controls, and median T1 values of 1382/ 1289 ms for patients/ controls. For diffusion anisotropy (p=0.0003) and for T2 values (p=0.005) the differences between healthy controls and patients were statistically significant; for susceptibility values (p=0.067) and T1 values (p=0.160) the differences were not statistically significant.
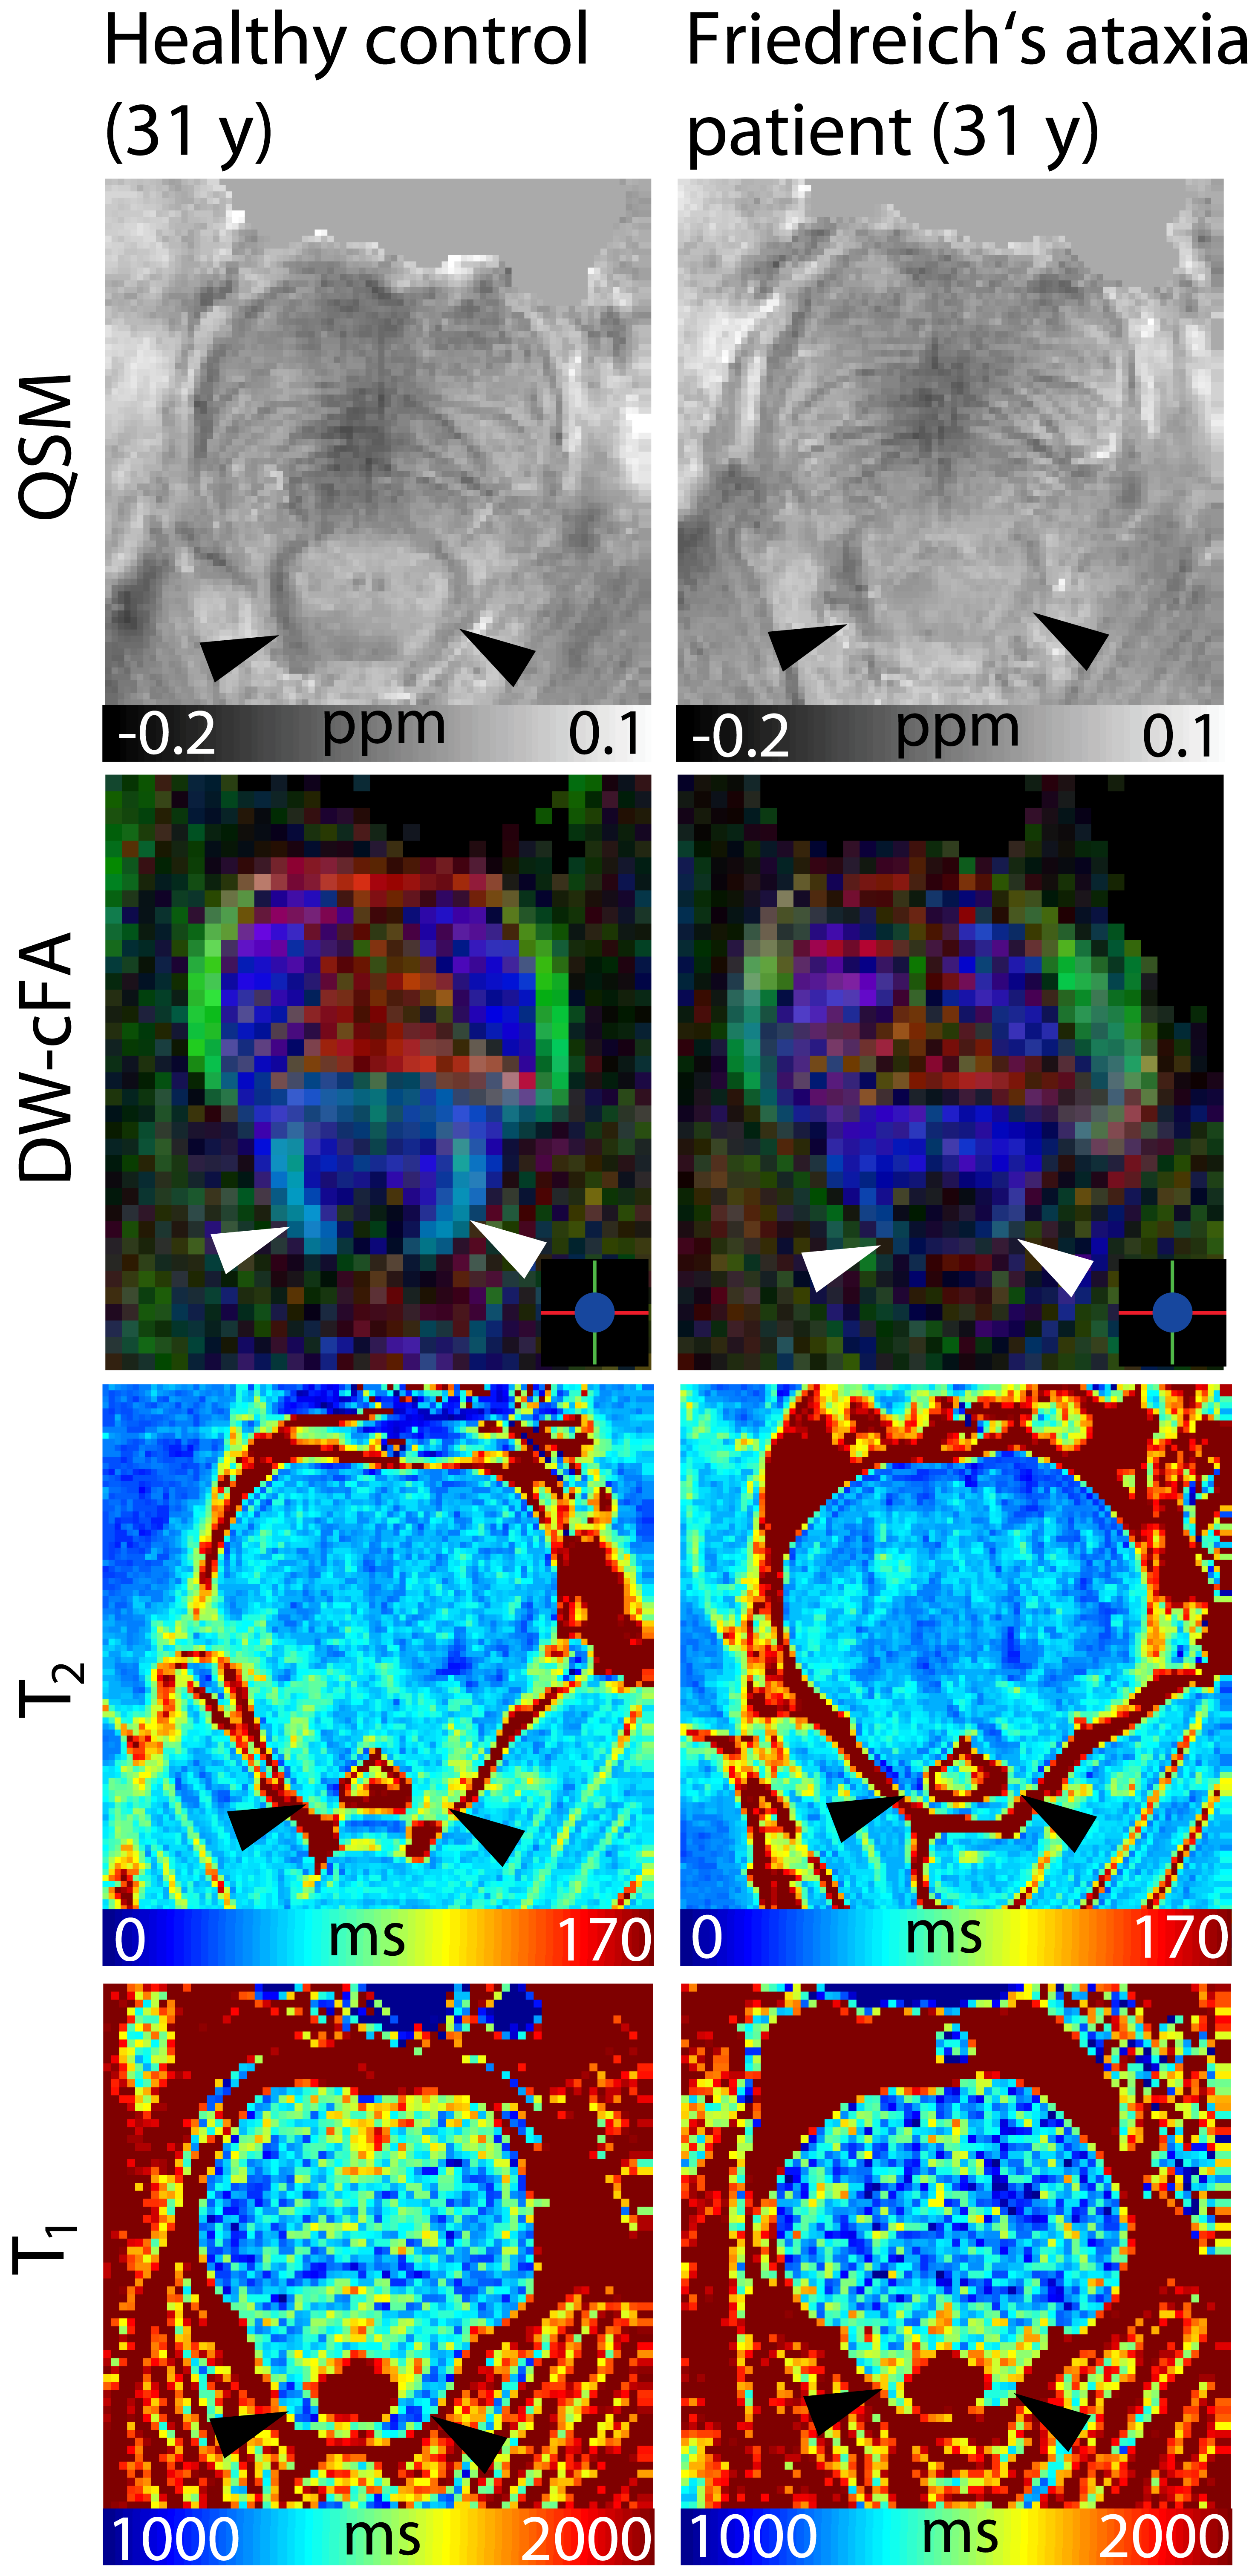
In Figure 3, representative slices of susceptibility maps, color-coded diffusion fractional anisotropy maps, and T2 and T1 maps of one healthy control and one patient of the same age and same sex are shown. An atrophy of the superior cerebellar peduncles can be observed in all patient images (second column). In QSM and in diffusion images, SCP (arrow heads) can be clearly depicted in the healthy control showing more diamagnetic susceptibility and higher fractional anisotropy than in the patient. In T2 maps, higher values can be observed in the heathy control than in the patient as well as lower T1 values in T1 maps.
DISCUSSION AND CONCLUSION
MRI can not only visualize the degeneration of the superior cerebellar peduncle in Friedreich’s ataxia but can also quantitatively assess its degeneration. In this ongoing study, already at a rather early stage with a relatively small number of participants, diffusion fractional anisotropy and T2 values were statistically significantly different between Friedreich’s ataxia patients and healthy controls. In future, these methods could become reliable biomarkers for the assessment of disease stage in Friedreich’s ataxia, for example in the evaluation of therapy efficiency.Acknowledgements
The provision of the ASPIRE gradient echo sequence and corresponding ICE program for coil combination of the 7 T GRE data by Korbinian Eckstein and Simon D. Robinson is kindly acknowledged.References
- Koeppen AH. Friedreich’s ataxia: Pathology, pathogenesis, and molecular genetics. J Neurol Sci. 2011;303(1-2): 1–12.
- Pagani E, Ginestroni A, Della Nave R, Agosta F, Salvi F, De Michele G, Piacentini S, Filippi M, Mascalchi M. Assessment of brain white matter fiber bundle atrophy in patients with Friedreich ataxia. Radiology. 2010;255(3):882-9.
- Akhlaghi H, Corben L, Georgiou-Karistianis N, Bradshaw J, Storey E, Delatycki MB, Egan GF. Superior Cerebellar Peduncle Atrophy in Friedreich’s Ataxia Correlates with Disease Symptoms. Cerebellum 2011;10:81-87.
- Porter DA, Heidemann RM. High resolution diffusion-weighted imaging using readout-segmented echo-planar imaging, parallel imaging and a two-dimensional navigator-based reacquisition. Magnetic resonance in medicine. 2009;62(2):468-75.
- Heidemann RM, Porter DA, Anwander A, Feiweier T, Heberlein K, Knosche TR, et al. Diffusion imaging in humans at 7T using readout-segmented EPI and GRAPPA. Magnetic resonance in medicine. 2010;64(1):9-14.
- Tanner JE. Use of Stimulated Echo in Nmr-Diffusion Studies. J Chem Phys. 1970;52(5):2523.
- Merboldt KD, Hanicke W, Frahm J. Diffusion Imaging Using Stimulated Echoes. Magnetic resonance in medicine. 1991;19(2):233-9.
- Computationally Efficient Combination of Multi-channel Phase Data From Multi-echo Acquisitions (ASPIRE). Eckstein K, Dymerska B, Bachrata B, Bogner W, Poljanc K, Trattnig S, Robinson SD. Magn Reson Med. 2018;79(6):2996-3006.
- Smith SM. Fast robust automated brain extraction. Human Brain Mapping 2002;17(3):143-155.
- Li W, Wu B, Liu CL. Quantitative susceptibility mapping of human brain reflects spatial variation in tissue composition. Neuroimage 2011;55(4):1645-56.
- Li W, Avram AV, Wu B, Xiao X, Liu CL. Integrated Laplacian-based phase unwrapping and background phase removal for quantitative susceptibility mapping. NMR Biomed. 2014;27(2):219-227.
- Wu B, Li W, Guidon A, Liu CL. Whole brain susceptibility mapping using compressed sensing. Magn Reson Med 2012;67(1):137-147.
- Wei HJ, Dibb R, Zhou Y, Sun YW, Xu JR, Wang N, Liu CL. Streaking artifact reduction for quantitative susceptibility mapping of sources with large dynamic range. NMR Biomed 2015;28:1294-1303.
- Emmerich J, Flassbeck F, Schmidt S, Bachert P, Ladd ME, Straub S. Rapid and accurate dictionary‐based T2 mapping from multi‐echo turbo spin echo data at 7 Tesla. J. Magn. Reson. Imaging 2018. doi:10.1002/jmri.26516.
- Maleike D, Nolden M, Meinzer HP, Wolf I. Interactive segmentation framework of the Medical Imaging Interaction Toolkit. Comput Meth Prog Bio 2009;96(1):72-83.
- Nolden M, Zelzer S, Seitel A, Wald D, Müller M, Franz AM, Maleike D, Fangerau M, Baumhauer M, Maier-Hein L, Maier-Hein KH, Meinzer HP and Wolf I, The Medical Imaging Interaction Toolkit: challenges and advances, Int J Comput Assist Radiol Surg. 2013;8(4):607-620.
Figures