0154
Impact of unilateral carotid artery stenosis on white matter fiber orientation effects of mq-BOLD derived oxygen extraction fraction1Department of Neuroradiology, Technical University of Munich, Munich, Germany, 2MRRC, Yale University, New Haven, CT, United States, 3Clinic for Radiology, Technical University of Munich, Munich, Germany, 4Philips Healthcare, Hamburg, Germany, 5Clinic for Neurology, Technical University of Munich, Munich, Germany
Synopsis
Assessment of relative oxygen extraction fraction (rOEF) in white matter (WM) by multiparametric quantitative-BOLD (mq-BOLD) has highest clinical relevance, but was so far limited due to known WM anisotropy effects. Here, we present data from a clinical study in 29 internal carotid artery stenosis (ICAS) patients and 30 age-matched healthy controls (HC). The major aim was to characterise the ICAS impact on T2*, T2, R2’, rCBV and rOEF orientation dependencies in WM. Our results show very similar rOEF orientation dependencies for ICAS-patients compared to HC and low average rOEF orientation errors of 4.5% indicating potentially meaningful rOEF evaluations in WM.
Purpose
Severe internal carotid-artery stenosis (ICAS) is a major public health issue, as it accounts for approximately 10% of all strokes.1 Even though related hemodynamic changes have been investigated intensively,2-7 oxygen metabolism changes are not well understood yet. The relative oxygen extraction fraction (rOEF) is therefore an important biomarker and assessable by the multi-parametric quantitative BOLD (mq-BOLD) approach.8,9 Gaining WM rOEF values has highest clinical relevance as perfusion territory border zones in white matter (WM)10 are known to be most vulnerable to hemodynamic changes.11 But so far, mq-BOLD was restricted to gray matter (GM) as the model assumptions are supposed to be violated in the highly oriented WM.8,14 WM structures are known to cause anisotropy effects,12,13 which primarily arise from oriented myelin structures12,15 and partially oriented vessels16.17 Recent work pointed to comparably low anisotropy driven variations of rOEF in WM for healthy controls (HC).18,19 The aim of this study was therefore to characterize the impact of anisotropy effects of rOEF in ICAS-patients.Methods
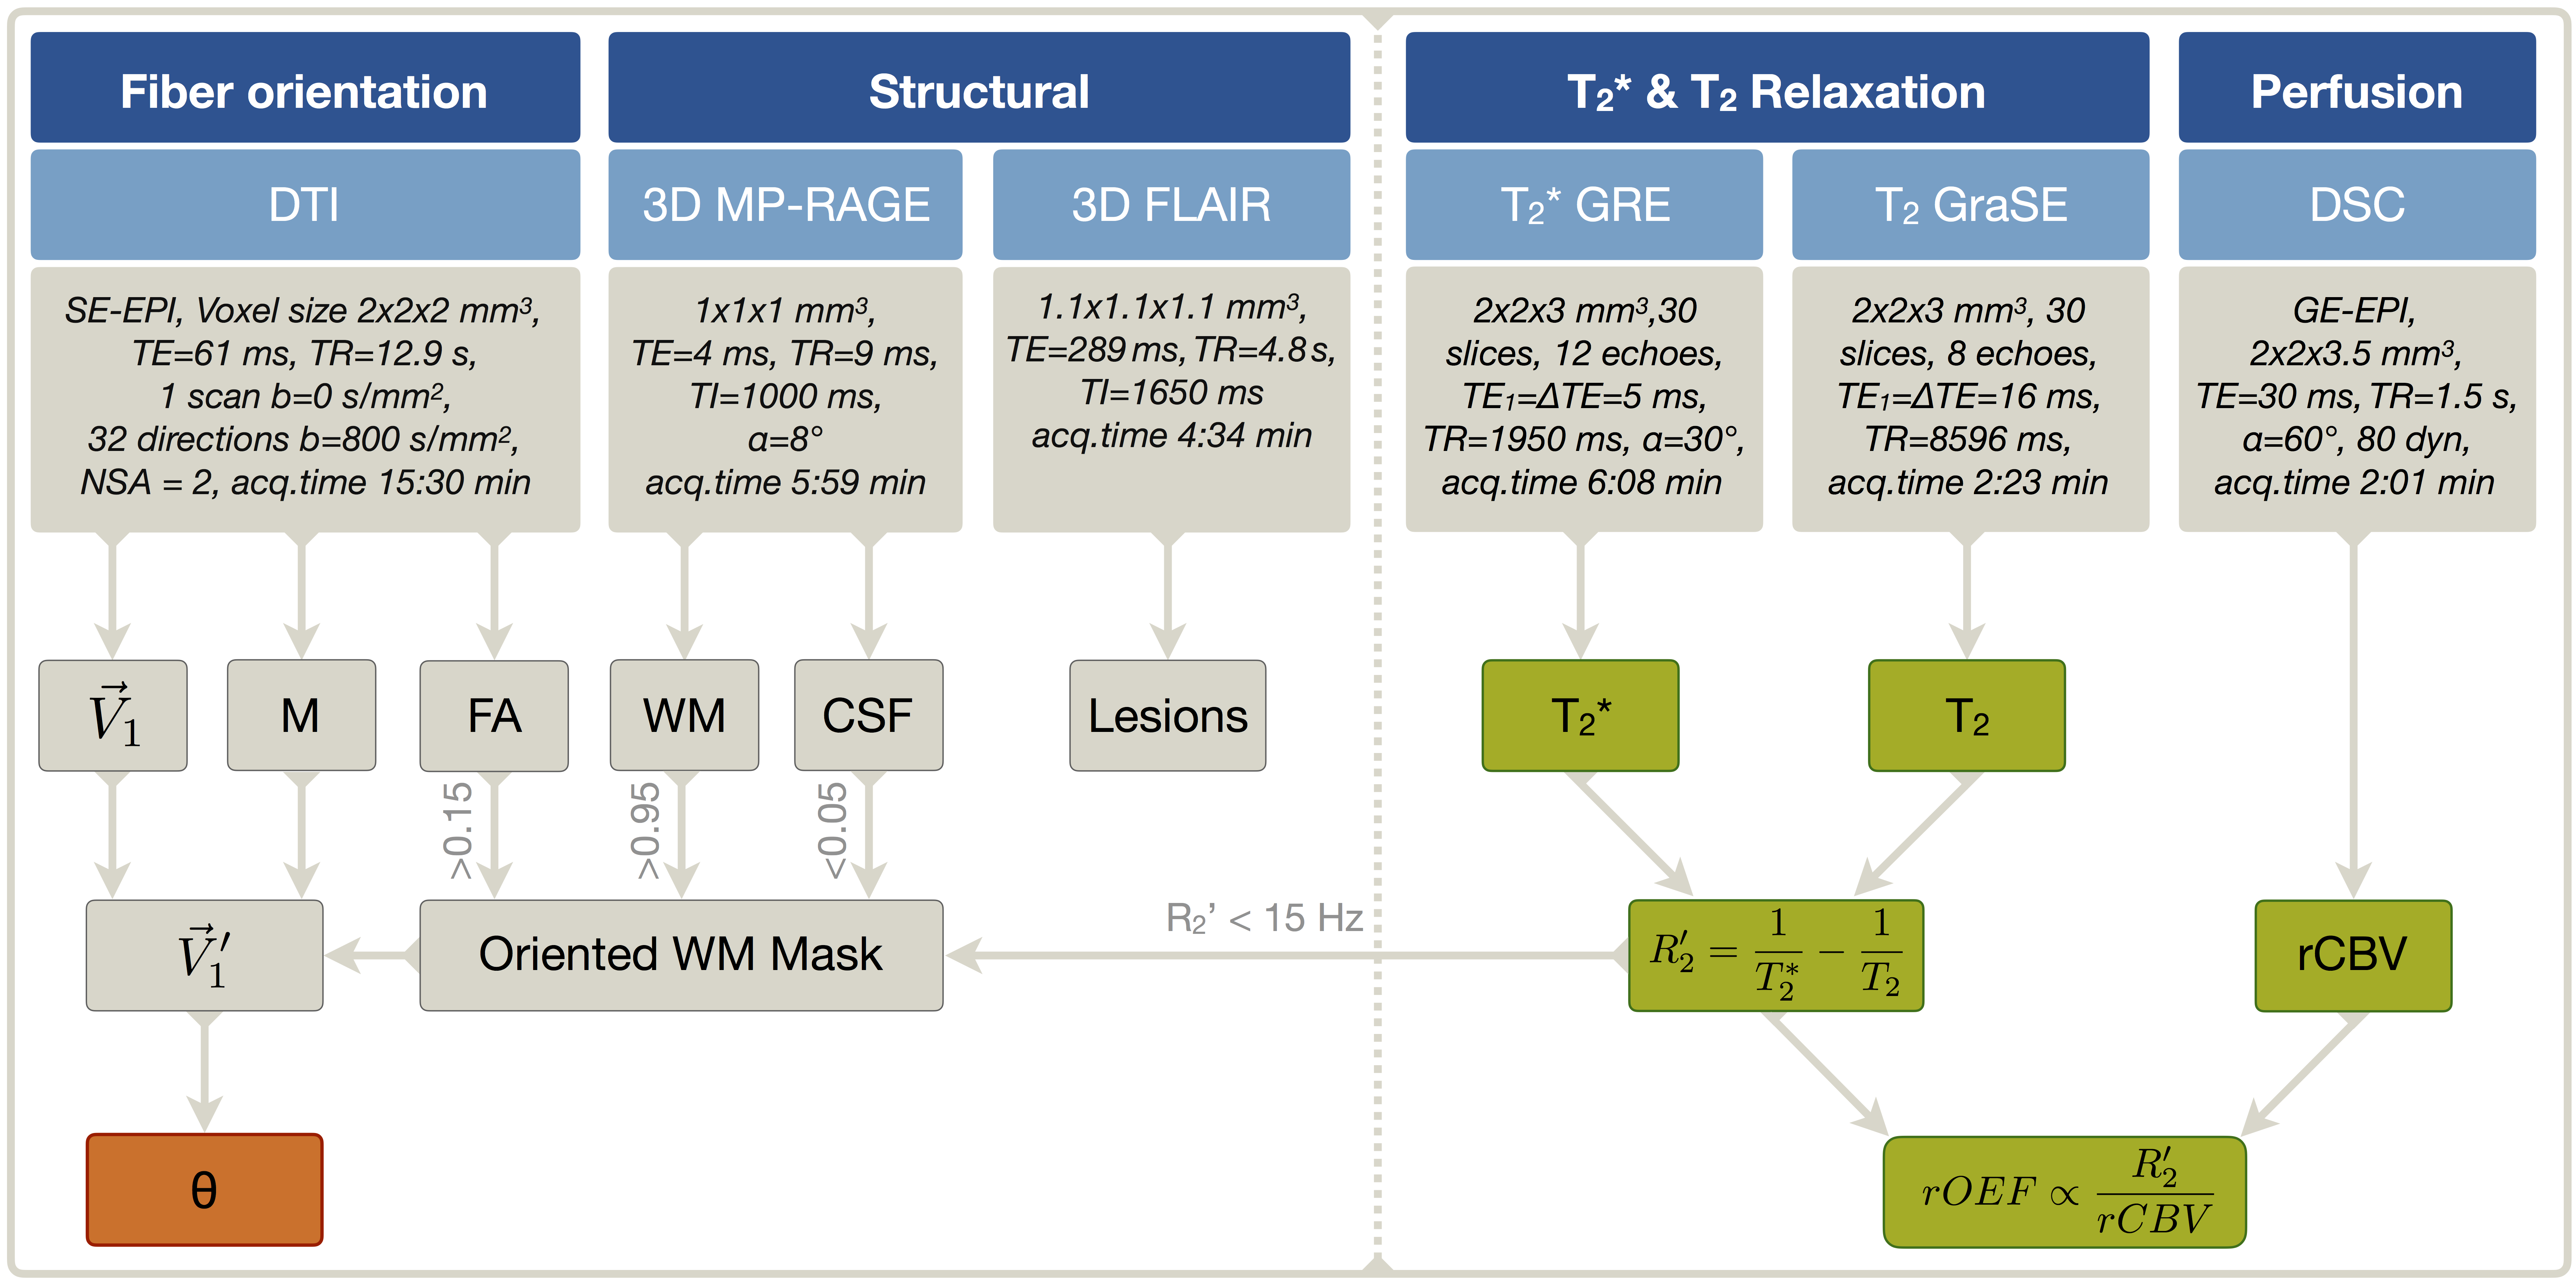
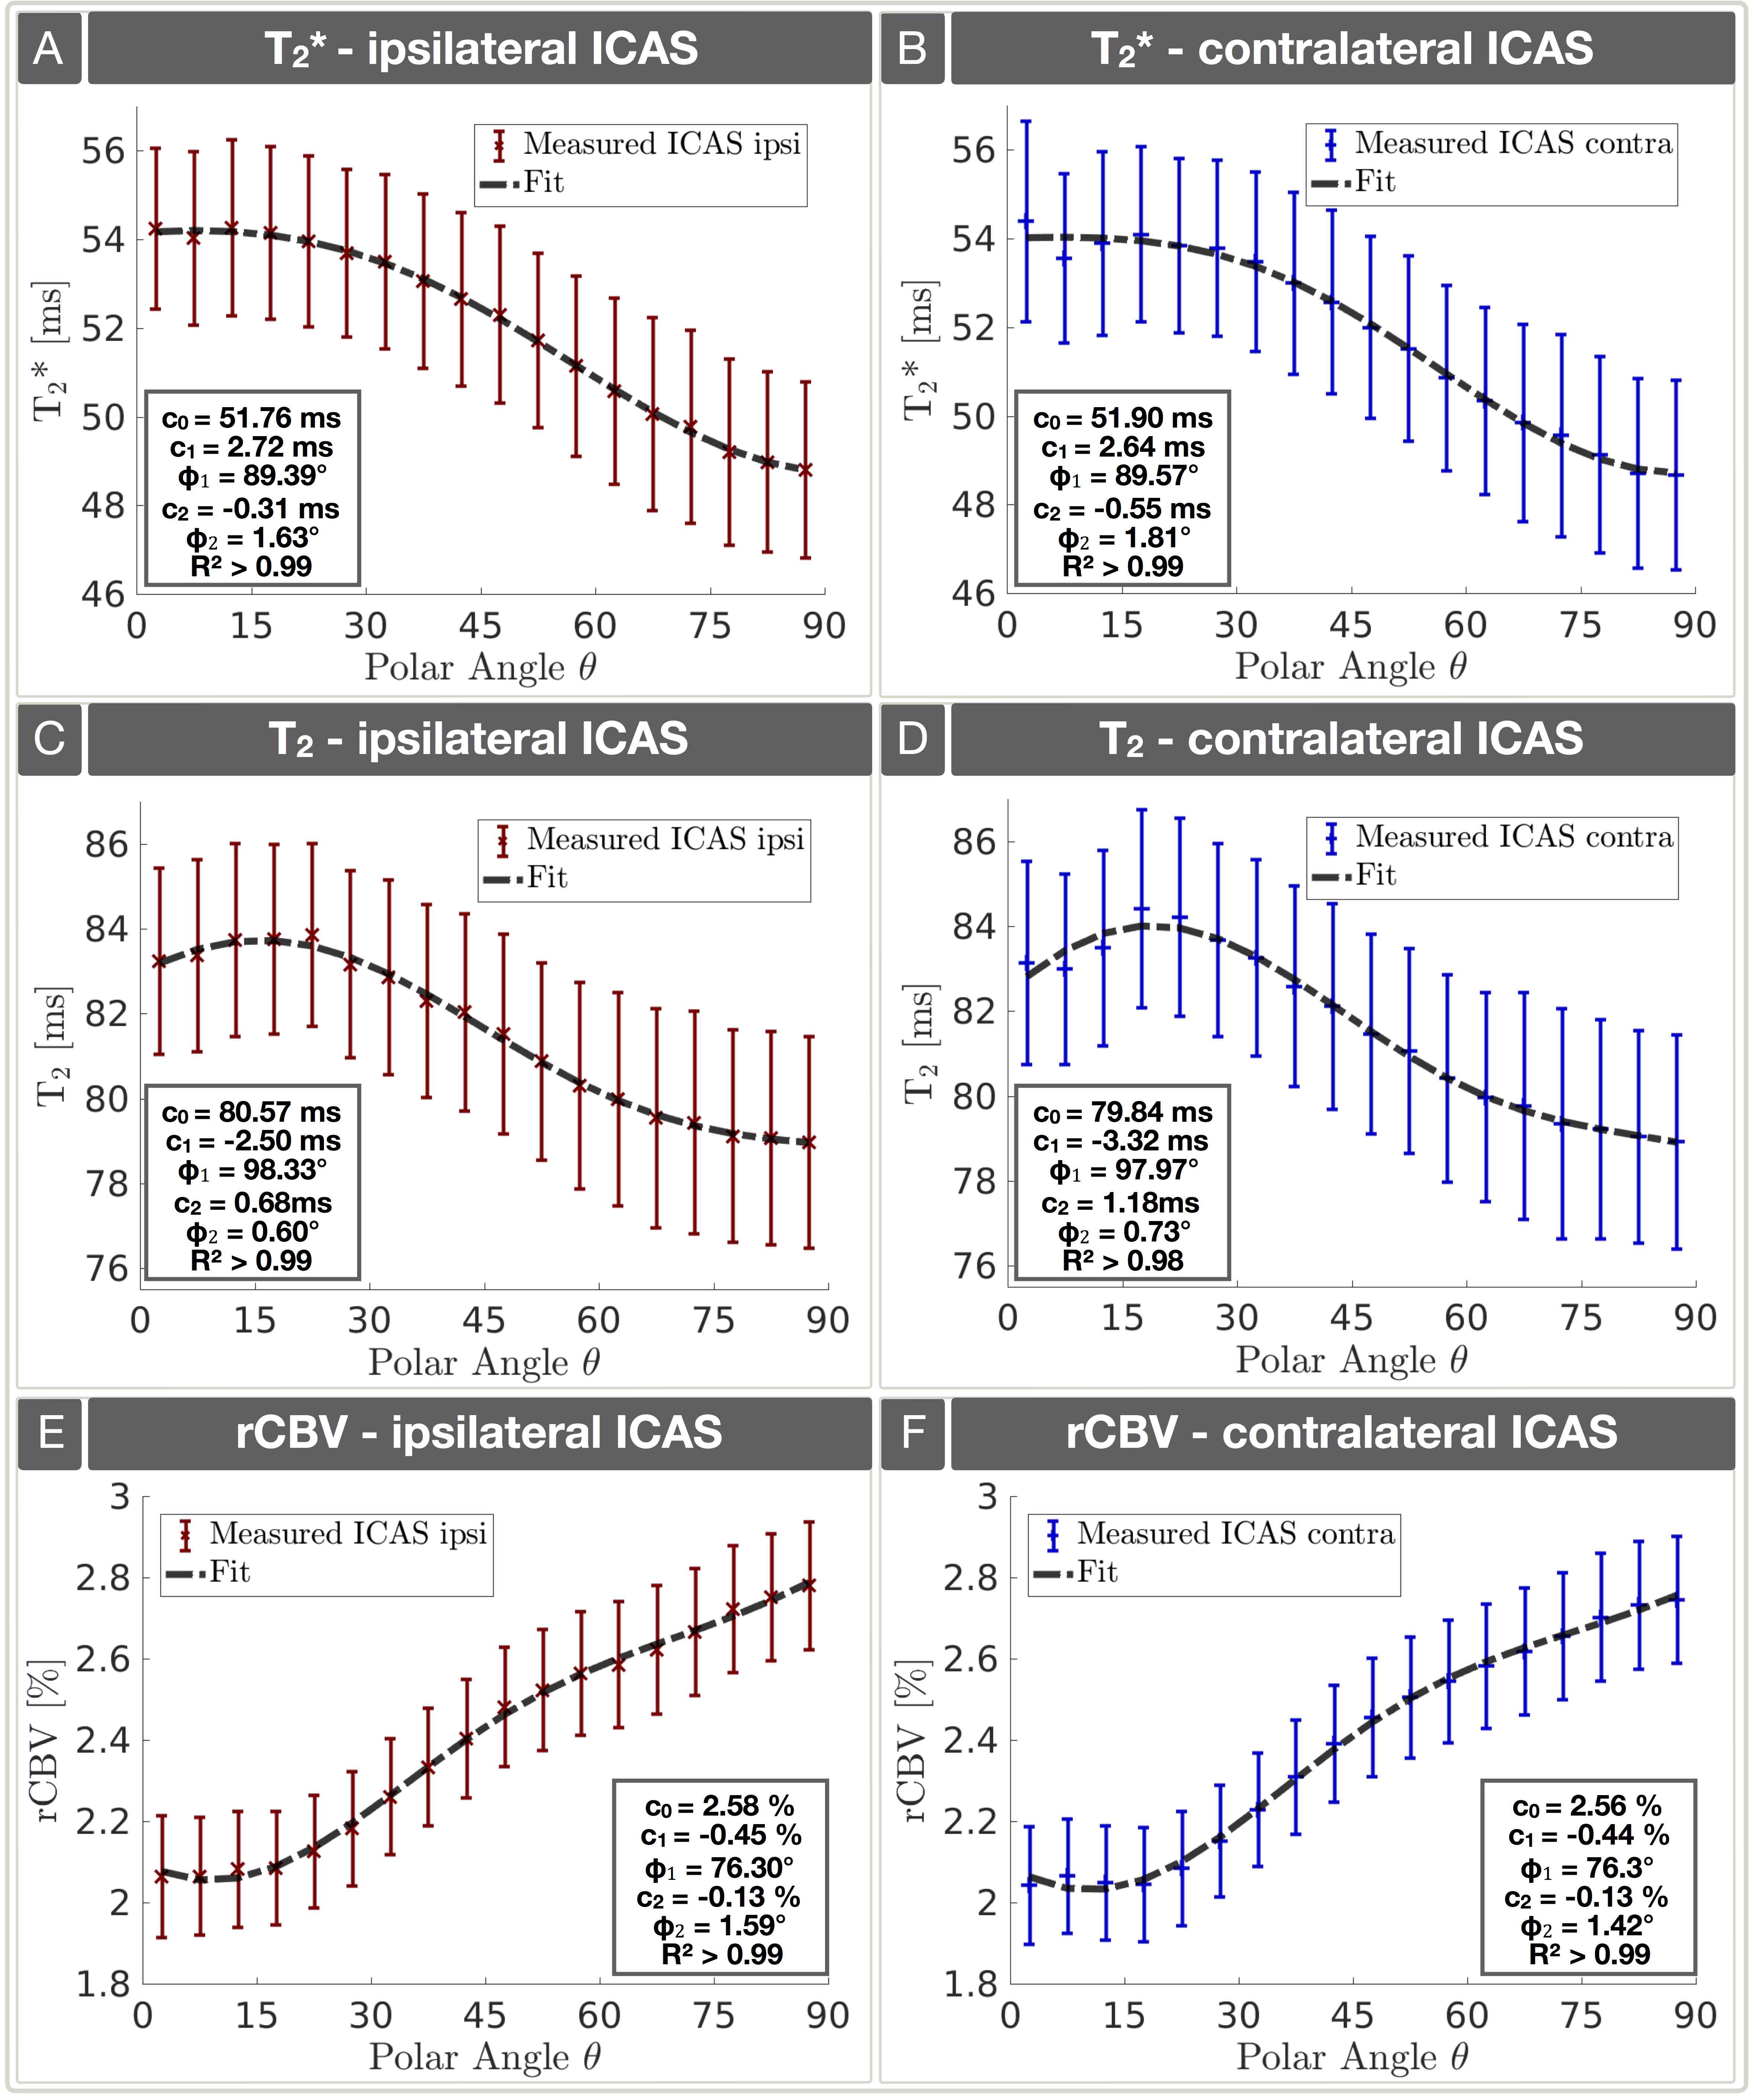
Fifty-nine participants (29 asymptomatic, unilateral ICAS-patients, age=70.1±4.8y and 30 age-matched HC, age=70.3±7.3y) underwent MRI on a Philips 3T Ingenia MR-Scanner (Philips Healthcare, Best, Netherlands) using a 16-channel head-neck-coil. Eight participants were excluded based on visual motion artefact ratings (CP, SK). The imaging protocol and sequence parameters are summarized in Fig.1. For mq-BOLD, separate acquisitions of T2*, T2 and dynamic susceptibility contrast (DSC) based rCBV (bolus-injection of 15ml Gd-DOTA, 4ml/s) were obtained to calculate rOEF by $$rOEF=\frac{R_2’}{c\cdot rCBV}\qquad[Eq.1]$$ with $$$c=\frac{4}{3}\cdot\pi\cdot\gamma\cdot\Delta\chi\cdot B_0$$$.8 Processing was performed with SPM1220, FSL21 and custom Matlab22 programs. Fiber orientations were assessed by DTI using FSL to yield FA values and main nerve fiber orientation vectors $$$\vec {V_1’}$$$ voxelwisely for each participant (Fig. 1). Each voxel's nerve fiber orientation $$$\vec {V_1’}$$$ relative to the main magnetic field B0 was transformed to a polar angle θ (range 0°-90°).18,19 Analysis was restricted to oriented WM-voxels (Fig. 1 & 2H). Within those subject specific masks, anisotropy effects of T2*(θ), T2(θ), R2'(θ), rCBV(θ) and rOEF(θ) were evaluated by histogram analysis of median values on group level in 5° angle-bins.18,19 Data of HC was compared to ICAS-patients - the hemispheres ipsilateral and contralateral to the stenosis were analyzed separately. The tissue-model by Lee et al.,23 which excellently fits HC-data,18,19 was now applied to our ICAS-data: $$S(\theta)=c_0+c_1\cdot sin\left(2\theta+\varphi_1)\right)+c_2\cdot sin\left(4\theta+\varphi_2\right)\qquad[Eq.2].$$Results
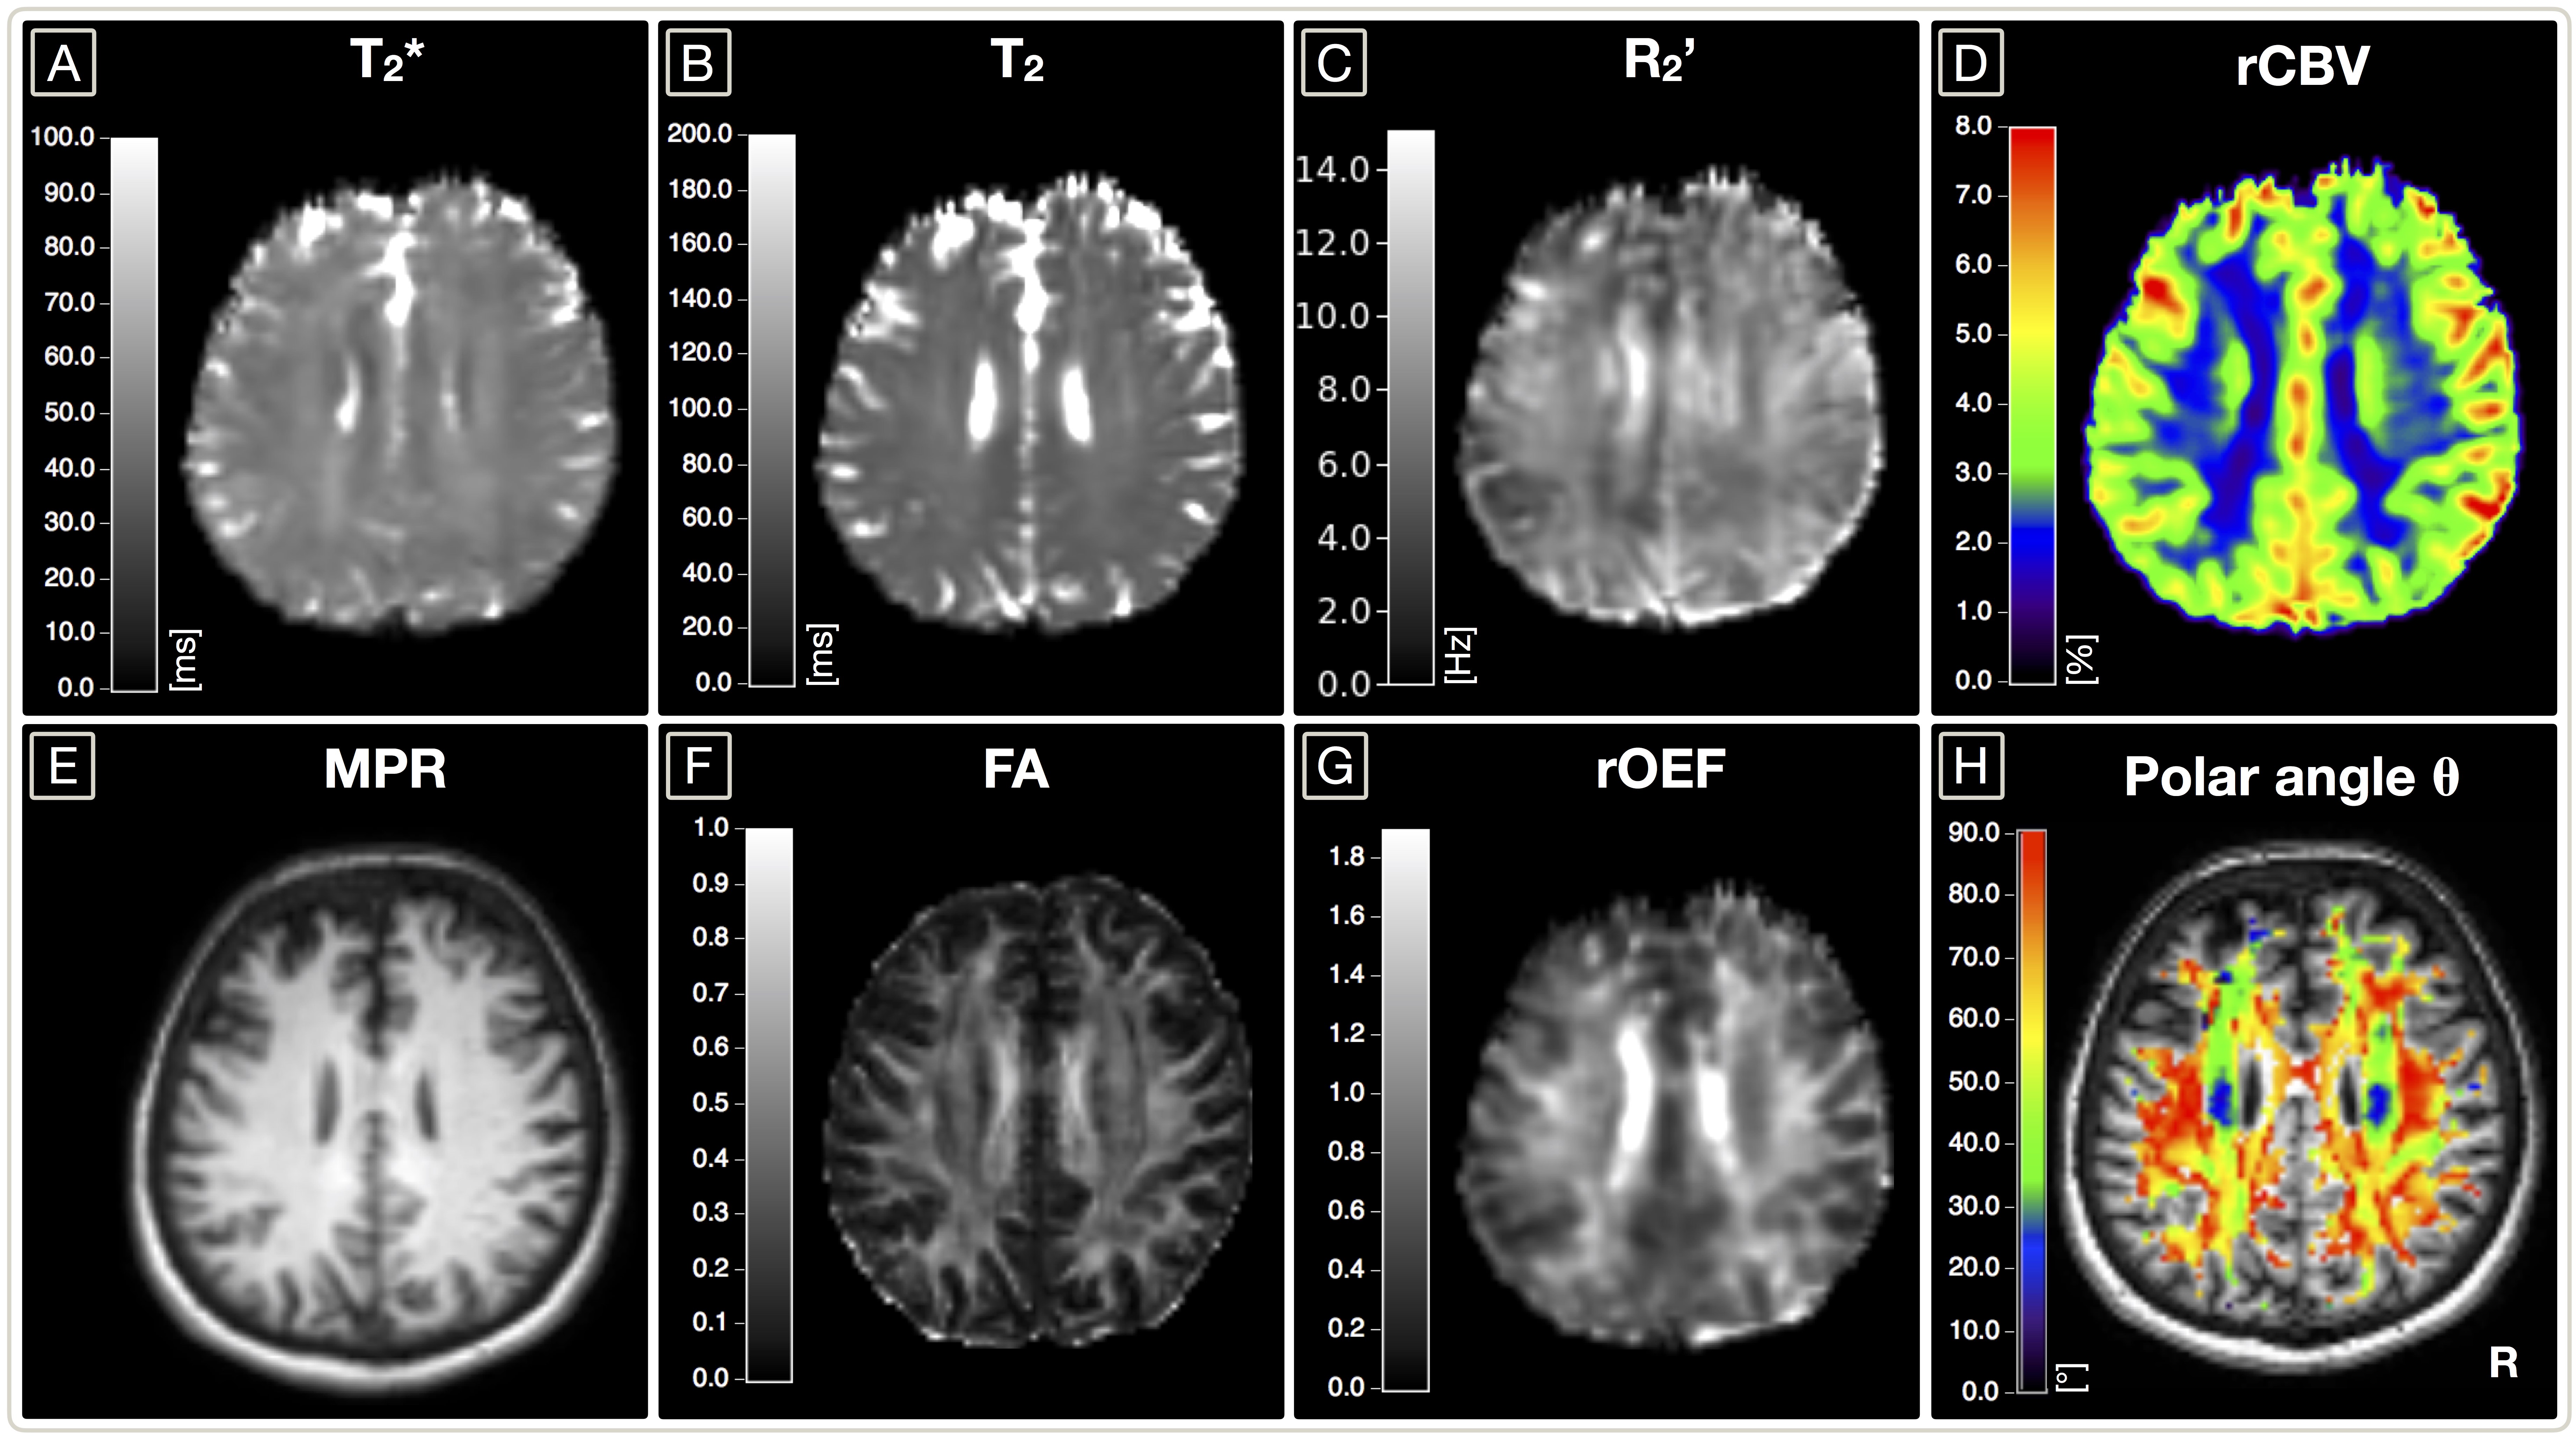
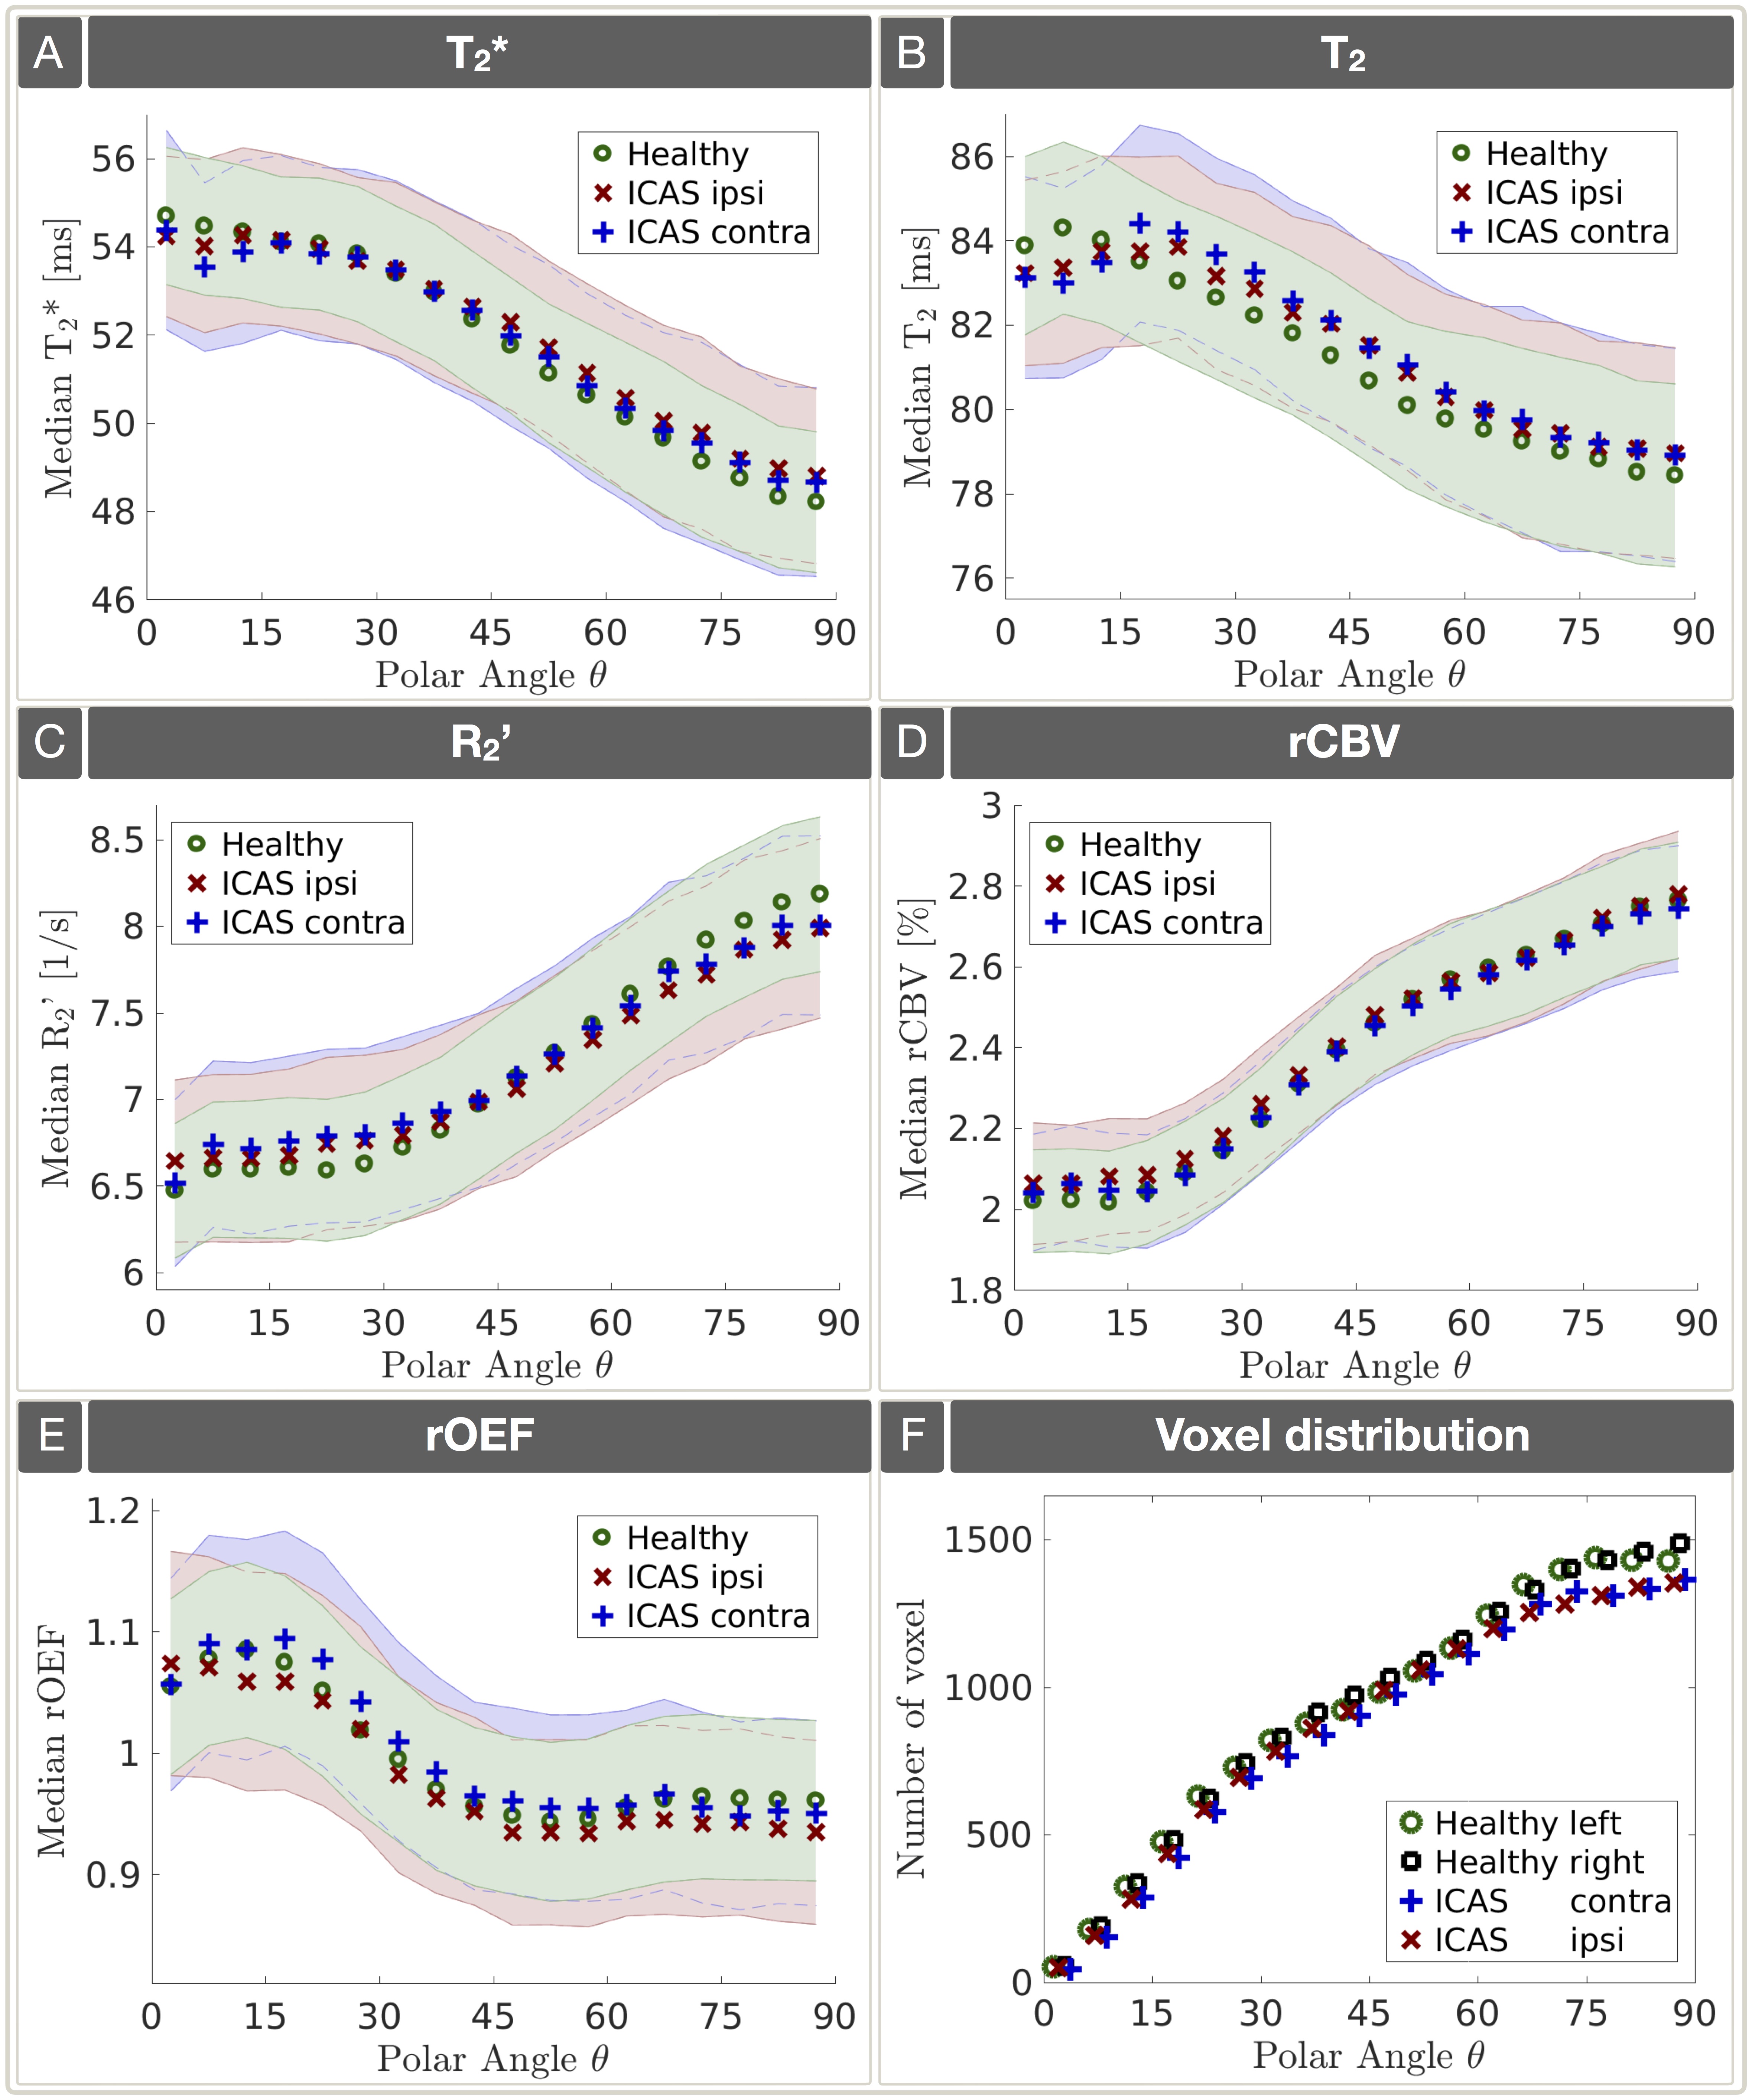
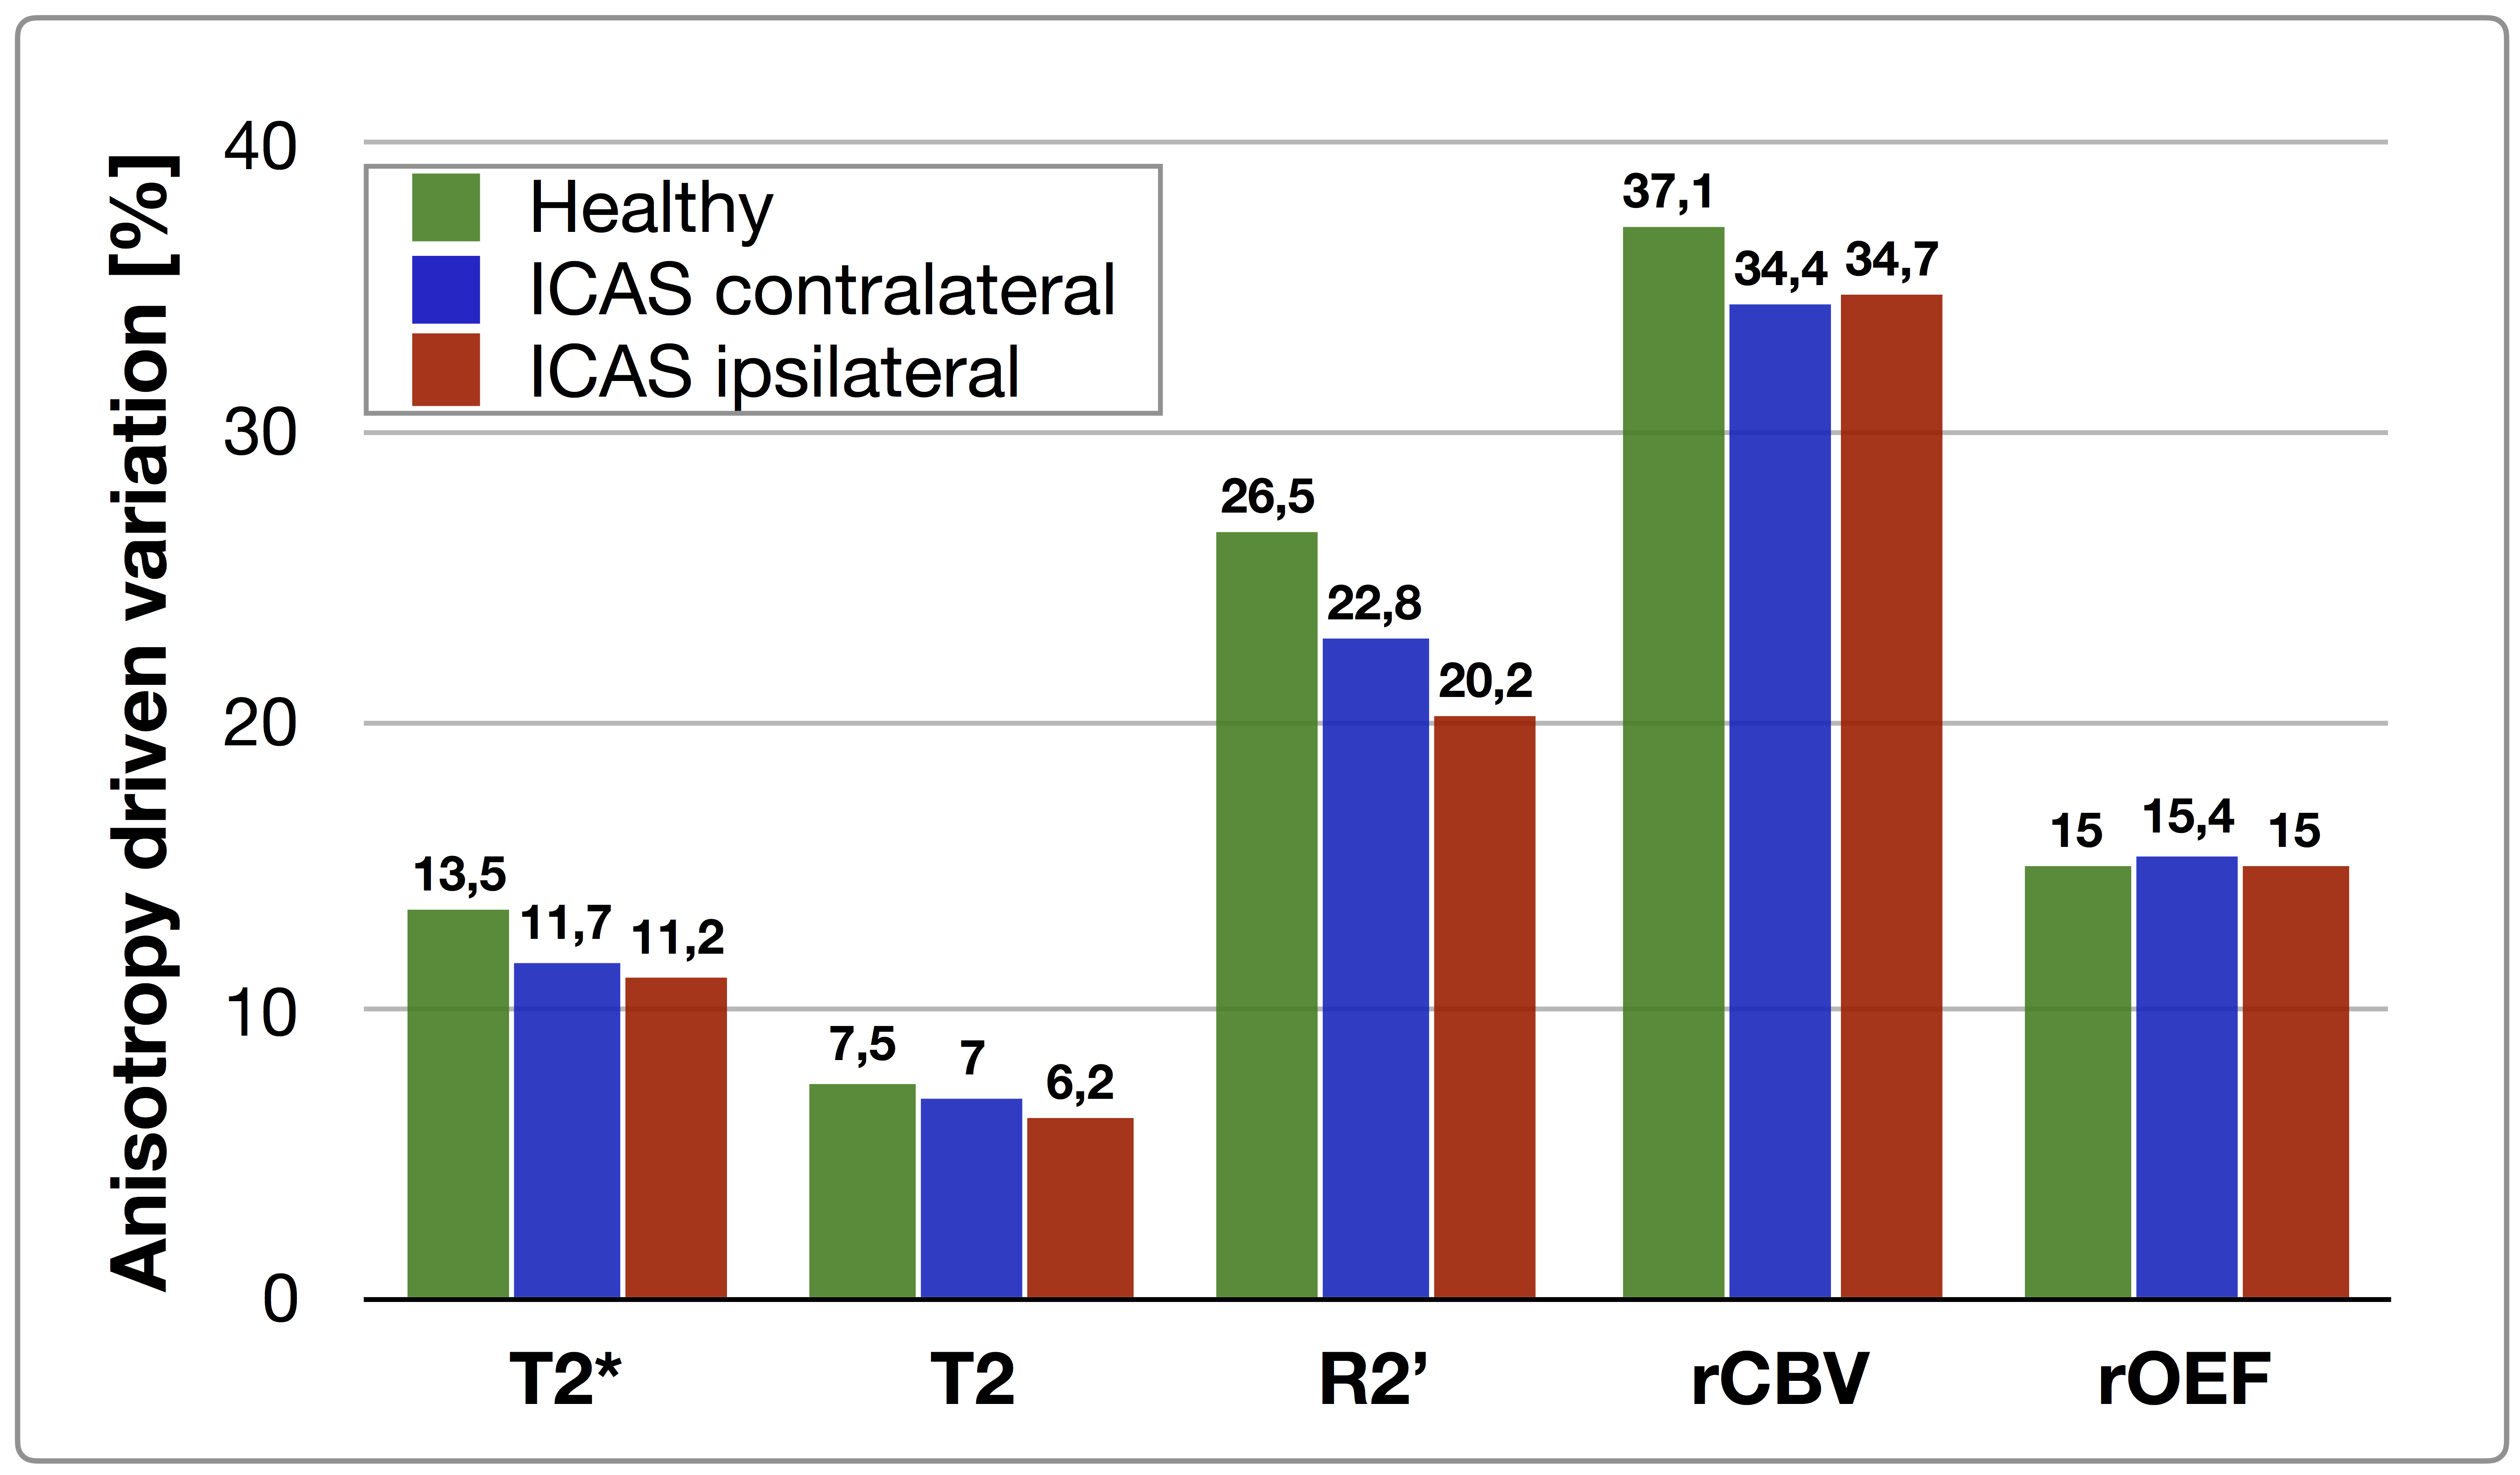
Exemplary data of an ICAS-patient is shown in figure 2. On group level, orientation dependencies of all mq-BOLD parameters are similar for HC and ICAS-patients, but show subtle deviations (Fig. 3A-E). Orientation dependencies of T2(θ) bilaterally deviate for ICAS-patients compared to HC, especially for θ=0°-15°. Furthermore, ICAS T2(θ)-values are bilaterally elevated for θ=15°-90° (Fig. 3B) while rCBV(θ) values are slightly elevated ipsilateral to the stenosis for θ=0-50° (Fig. 3D). However, all differences are rather small compared to the standard errors. The number of oriented WM voxels is slightly bilaterally reduced in ICAS by 6 % compared to HC (Fig. 3F). Fittings of Lee’s model21 [Eq.2] show very good agreement in both ICAS hemispheres (Fig. 4). Anisotropy driven variations of T2*(θ), T2(θ) and R2’(θ) are reduced in ICAS compared to HC, being lowest in ipsilateral hemispheres (Fig. 5). Variations of rCBV(θ) are bilaterally reduced in ICAS while rOEF(θ) variations are almost unaffected (Fig. 5). Average anisotropy related rOEF error analysis, accounting for voxel distributions (Fig. 3F), revealed 3.8% for HC,18 4.2% for contralateral and 4.5% for ipsilateral ICAS.
Discussion
The DTI-based analysis of WM-orientation effects on mq-BOLD parameters in ICAS revealed both, unilateral and bilateral effects. The excellent agreement with Lee’s model23 [Eq.2] indicates that orientation effects in ICAS arise from oriented myelin structures and partially aligned vessels, as for HC.18,19 Interestingly, anisotropy driven variations of T2*(θ), T2(θ) and R2’(θ) were generally reduced and lowest in the ipsilateral hemisphere. Those results point to effects of ICAS on myelination and/or the vasculature, with strongest ipsilateral changes. Small ipsilateral rCBV(θ) elevations could be attributed to autoregulation by chronic vasodilation.5 Lower numbers of WM voxels within both ICAS hemispheres indicate minor global WM atrophy. Despite those differences, rOEF orientation dependencies are overall similar to HC and average rOEF errors are comparably low due to partially counteracting effects of R2’(θ) and rCBV(θ).18,19Conclusion
We presented the successfull analysis of mq-BOLD orientation effects in ICAS. The results point to effects of ICAS on myelination and/or the vasculature, most pronounced in the ipsilateral hemisphere. However, average orientation dependent errors of rOEF (4.5%) are similar to HC. Therefore, our results point to a potentially meaningful evaluation of rOEF by mq-BOLD in WM for ICAS-patients. Additional future validations are clearly demanded, e.g. by MR vs. PET comparisons.Acknowledgements
The authors acknowledge support by the Friedrich-Ebert-Stiftung, Dr.-Ing. Leonhard-Lorenz-Stiftung and the German research Foundation (DFG, grant PR 1039/6-1).References
1. Petty GW et al. (1999). "Ischemic stroke subtypes: a population-based study of incidence and risk factors." Stroke, 30: 2513-6.
2. Bouvier J et al. (2015). "Reduced CMRO2 and cerebrovascular reserve in patients with severe intracranial arterial stenosis: A combined multiparametric qBOLD oxygenation and BOLD fMRI study." HBM, 36: 695-706.
3. Vakil P et al. (2013). "Cerebrovascular Occlusive Disease: Quantitative Cerebral Blood Flow Using Dynamic Susceptibility Contrast MR Imaging Correlates with Quantitative H2[15O] PET." Radiology, 266: 879-86.
4. Buxton RB (2010). "Interpreting oxygenation-based neuroimaging signals: the importance and the challenge of understanding brain oxygen metabolism." Front Neuroenergetics, 2: 8.
5. Derdeyn CP et al. (2002). "Variability of cerebral blood volume and oxygen extraction: stages of cerebral haemodynamic impairment revisited." Brain, 125(3): 595-607.
6. Blockley N et al. (2013). "A review of calibrated blood oxygenation level-dependent (BOLD) methods for the measurement of task-induced changes in brain oxygen metabolism." NMR in Biomed, 26: 987-1003.
7. Hyder F and Rothman DL (2012). "Quantitative fMRI and oxidative neuroenergetics." NeuroImage, 62: 985-94.
8. Hirsch NM et al. (2014). "Technical considerations on the validity of blood oxygenation level-dependent-based MR assessment of vascular deoxygenation." NMR Biomed, 27: 853-62.
9. Christen T et. al. (2012). "Measuring brain oxygenation in humans using a multiparametric quantitative blood oxygenation level dependent MRI approach." MRM, 68: 905-11.
10. Momjian-Mayor I and Baron JC (2005). "The pathophysiology of watershed infarction in internal carotid artery disease: review of cerebral perfusion studies." Stroke, 36: 567-77.
11. Kaczmarz S et al. (2018). "Increased variability of watershed areas in patients with high-grade carotid stenosis." Neuroradiology, 60: 311-23.
12. Bender B and Klose U (2010). "The in vivo influence of white matter fiber orientation towards B(0) on T2* in the human brain." NMR Biomed, 23: 1071-6.
13. Denk C et al. (2011). "The influence of white matter fibre orientation on MR signal phase and decay." NMR in Biomed, 24: 246-52.
14. Yablonskiy DA and Haacke EM (1994). "Theory of NMR signal behavior in magnetically inhomogeneous tissues: The static dephasing regime." MRM, 32: 749-63.
15. Lee et al. (2012). "The contribution of myelin to magnetic susceptibility-weighted contrasts in high-field MRI of the brain." NeuroImage, 59: 3967-75.
16. Nonaka H et al. (2003). "Microvasculature of the human cerebral white matter: arteries of the deep white matter." Neuropathology. 23: 111-8.
17. Hernández-Torres E et al. (2016). "Anisotropic cerebral vascular architecture causes orientation dependency in cerebral blood flow and volume measured with dynamic susceptibility contrast magnetic resonance imaging." JCBFM, 37: 1108-19.
18. Kaczmarz S et al. (2018). "Characterizing white matter fiber orientation effects on multi-parametric quantitative BOLD assessment of oxygen extraction fraction." JCBFM. Under Revision.
19. Kaczmarz S et al. (2018). "Assessment of white matter anisotropy effects in mq-BOLD based mapping of relative Oxygen Extraction Fraction." Proc Intl Soc Mag Reson Med 26. Paris 2018.
20. Statistical Parametric Mapping software (SPM12) Version 6225: www.fil.ion.ucl.ac.uk/spm.
21. Woolrich MW et al. (2009). "Bayesian analysis of neuroimaging data in FSL." NeuroImage, 45: S173-86.20.
22. The MathWorks, Natick, MA, USA. Version 2016b.
23. Lee J et al. (2011). "T2*-based fiber orientation mapping." NeuroImage, 57: 225-34.
24. Vinci software, Max-Planck-Institut für neurologische Forschung, Cologne, Germany: http://www.nf.mpg.de/vinci3/. Accessed 09.Nov 2015.
Figures