0153
Contrasting frequency shifts and QSM in a longitudinal analysis of MS lesions to determine the nature of MR frequency and QSM signal changes1Physics and Astronomy, University of British Columbia, Vancouver, BC, Canada, 2Pediatrics, University of British Columbia, Vancouver, BC, Canada, 3UBC MRI Research Centre, University of British Columbia, Vancouver, BC, Canada, 4Radiology, University of British Columbia, Vancouver, BC, Canada, 5Pathology and Laboratory Medicine, University of British Columbia, Vancouver, BC, Canada, 6International Collaboration on Repair Discoveries (ICORD), Vancouver, BC, Canada, 7Medicine (Neurology), University of British Columbia, Vancouver, BC, Canada
Synopsis
Magnetic susceptibility and MR frequency shifts in MS lesions are sensitive measures of tissue damage. However, the sensitivity of FS and QSM to magnetic susceptibility effects as well as changes in tissue microarchitecture complicate data interpretation in biological systems. By contrasting QSM and resonance frequency shift maps these two mechanisms may be differentiated. We observed that the signal shifts at enhancement are reflective of microstructural changes indicating formation of myelin debris, as similar FS and QSM changes were observed. Signal reductions in MS lesions 5yrs-post-enhancement however are only present on QSM, suggesting removal of myelin debris and axonal loss as the underlying mechanisms.
Introduction
MR frequency shift (FS) imaging and quantitative susceptibility mapping (QSM) have become frequently used tools for the assessment of myelin damage in multiple sclerosis (MS) lesions, particularly during blood-brain barrier breakdown and initial lesion formation. Strong positive signal shifts have been observed at time of lesion enhancement1,2, persisting for 1-3 years before returning again to non-lesional white matter (WM) values3,4. However, it is unknown when MS lesions start to show reduced QSM values post-enhancement and the underlying nature of this signal reduction are not well understood. We compared FS and QSM changes in MS lesions from enhancement to 3-5 years.Methods
Subjects: 11 MS patients and four healthy controls were scanned each month for 6 months and once 3.2-5.8 years post-baseline (long-term follow-up, LTFU, median 5.2yrs). Experiments: Data were acquired on a 3T Philips Achieva using an 8-channel SENSE head coil, including a single-echo gradient-echo (GRE) (TE/TR=20/40ms, voxel size=0.5x0.7x2mm3, FOV=240x166x64mm3, FA=19˚), contrast-enhanced T1w images and FLAIR. Single-echo GRE data were acquired to match the baseline data acquired in 20071.
Data analysis: FS and QSM maps were computed using an in-house developed pipeline of Laplacian unwrapping5,6, V-SHARP for background field removal7,8 and dipole inversion using an l1-norm minimization with sparsity priors9. Homodyne filtered FS maps were also produced1. Enhancing lesions were identified and delineated on Gadolinium (Gd)-enhanced T1w-images within the first six months. To ensure that differences in lesion delineation did not influence the observed signal shifts, additional lesion masks were created for the same enhancing lesions based QSM or the GRE-magnitude. Reference regions of normal-appearing (NAWM) and normal WM in controls were defined. NiftyReg10 and FSL11,12 were used to create a half-way space between baseline and LTFU. Quantitative images and lesion masks from all individual time points were subsequently mapped to the half-way space.
Results
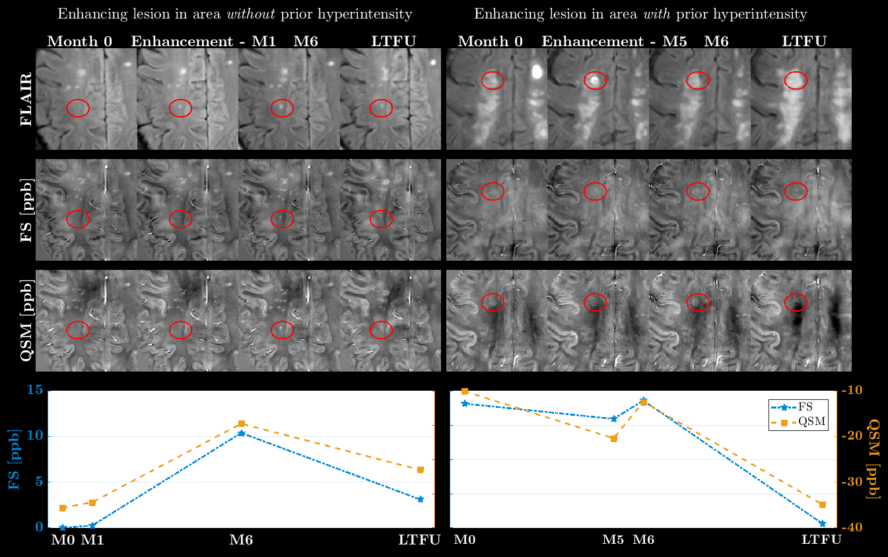
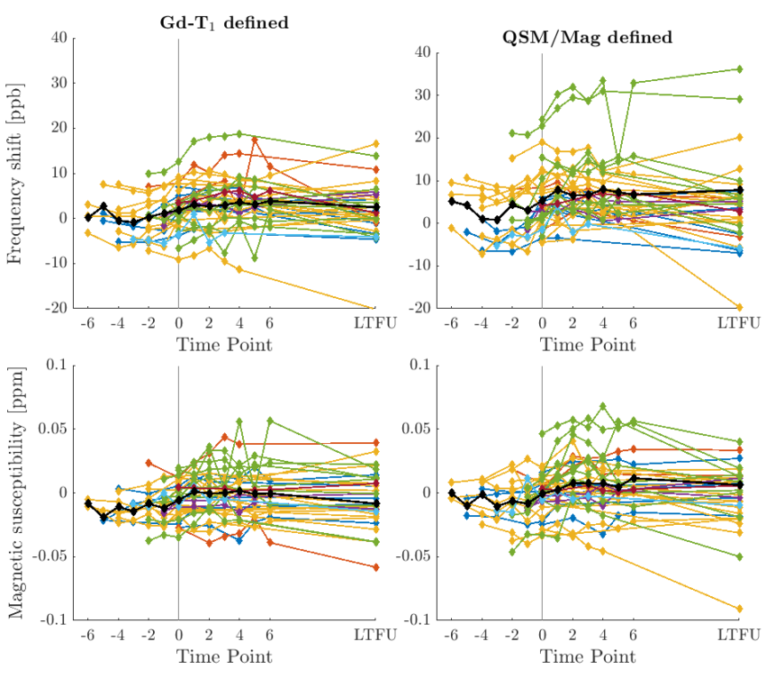
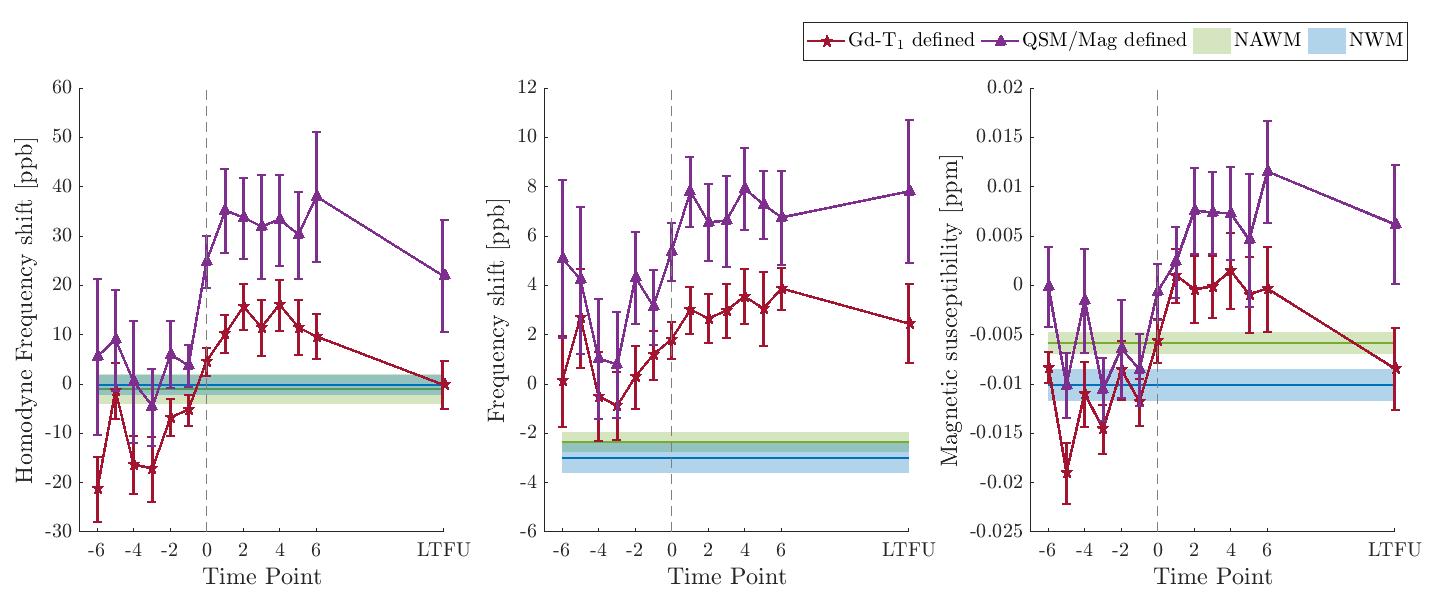
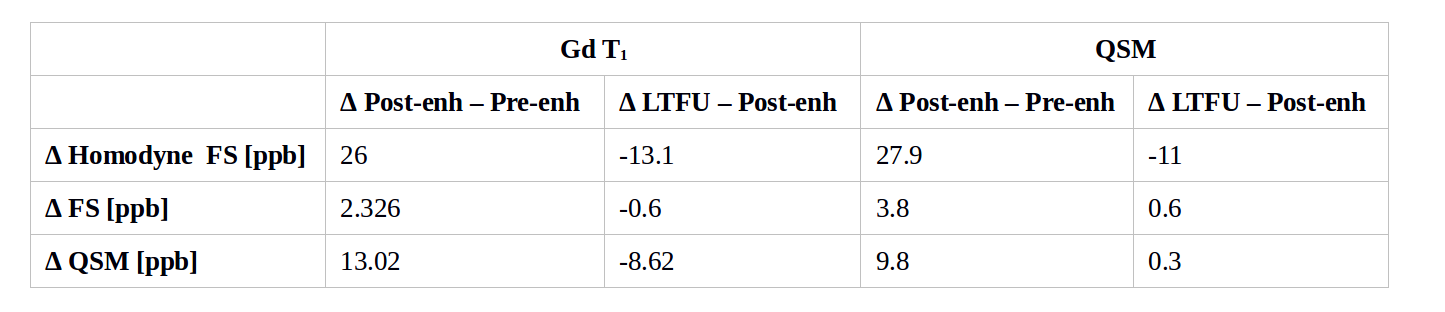
Seventy-one enhancing lesions were identified; 19 were located outside the GRE-data field-of-view, and 17 were excluded due to contamination by large vessels or proximity to the basal ganglia, ventricles or cortex. The majority of the 35 remaining enhancing lesions appeared either in regions of previous hyperintense signal on FLAIR or at baseline, with no pre-enhancement data available. Figure 1 displays examples of lesions appearing in a region free of prior hyperintense signal (left) and on top of prior FLAIR-hyperintensity (right). Lesions appeared at enhancement either FS/QSM-isointense or hyperintense compared to surrounding WM. The range of FS/QSM-values within lesions can be appreciated from Figure 2. Lesions showed no patient-specific FS/QSM-offset. QSM-defined lesions appeared to capture greater change between baseline and LTFU than Gd-T1 defined lesions. Average FS and QSM values (Figure 3) displayed the characteristic signal increase at time of enhancement, followed by a stabilization of the FS/QSM-signal, before the return to baseline values. The average FS/QSM-shifts between these segments, depending on lesion definition, are summarized in Table 1. The average non-filtered FS did not show a signal reduction at LTFU, but remained at post-enhancement values.Discussion
Previous studies suggested that QSM may replace Gadolinium-contrast T1w-scans for the detection of blood-brain barrier breakdown. However, the signal shift at time of enhancement is dependent on whether the area showed prior FLAIR-hyperintensity. Thus, not all lesion activity will be captured by QSM. On average, all image processing techniques produced similar signal shifts at enhancement, indicating that the shifts are due to microstructural changes, not magnetic susceptibility shifts. The signal decrease occurring 5yrs post-enhancement was not reflected in the FS maps and thus may be due to magnetic susceptibility changes. The signal reduction observed at 5yrs in this study is earlier than other studies have indicated2. Homodyne FS detected the return to baseline values as the filtering flattened non-local field inhomogeneities. The signal reduction towards LTFU may in part relate to clearance of myelin debris13,14. Remyelination also reduces QSM; however remyelination is believed to occur earlier during lesion development (<1year). while oligodendrocytes are still present and axons intact15,16. 20-40% of acute lesion develop into black holes, i.e. lesions showing axonal loss and scaring17,18. Axonal degeneration in the transition from new lesions into black holes may further contribute to the signal reduction at LTFU. BH show small positive FS and QSM values, although large variation exist1.Conclusion
FS and QSM are both sensitive to microstructural changes occurring at time of enhancement, but FS may not fully capture susceptibility-related signal changes 5yrs post-enhancement due to the changes' non-local nature. Furthermore, if prior FLAIR-hyperintensity was present in a region of recent lesion activity, e.g. lesion re-enhancement, it may not be detected by QSM.Acknowledgements
No acknowledgement found.References
1. Wiggermann V, Hernandez-Torres E, Vavasour IM, et al., Magnetic resonance frequency shifts during acute MS lesion formation. Neurology 2013,81:1-8.
2. Chen W, Gauthier SA, Gupta A, et al. Quantitative susceptibility mapping of multiple sclerosis lesions at various ages. Radiology 2014;271(1):183-192.
3. Zhang Y, Gauthier SA, Gupta A, et al. Quantitative susceptibility mapping and R2* measured changes during white matter lesion development in multiple sclerosis: myelin breakdown, myelin debris degradation and removal and iron accumulation. AJNR Am J Neuroradiol 2016;DOI:10.3174/ajnr.A4825.
4. Zhang Y, Gauthier SA, Gupta A, et al. Longitudinal change in magnetic susceptibility of new enhanced multiple sclerosis (MS) lesions measured on serial quantitative susceptibility mapping (QSM). JMRI 2016;44(2):426-432.
5. Schofield MA, Zhu Y. Fast phase unwrapping algorithm for interferometric applications. Opt Lett 2003;28:1194-1196.
6. Li W, Wu B, Liu C. Quantitative susceptibility mapping of human brain reflects spatial variation in tissue composition. NeuroImage 2011;55(4):1645-1656
7. Schweser F, Deistung A, Lehr BW, Reichenbach JR. Quantitative imaging of intrinsic magnetic tissue properties using MRI signal phase: an approach to in vivo brain iron metabolism? NeuroImage 2011;54:2789-2807.
8. Wu B, Li W, Guidon A, Liu C. Whole brain susceptibility mapping using compressed sensing. Magn Reson Med 2012;67(1):137-147.
9. Kames C, Wiggermann V, Rauscher A. Rapid two-step dipole inversion for susceptibility mapping with sparsity priors. NeuroImage 2018;167:276-283.
10. Modat M, Cash DM, Daga P, et al. Global image registration using a symmetric block-matching approach. J Med Imaging. 2014;1(2):024003.
11.Jenkinson M, Bannister P, Brady JM, Smith SM. Improved optimization for the robust and accurate linear registration and motion correction of brain images. NeuroImage. 2002; 17(2):825-841.
12. Zhang Y, Brady M, Smith S. Segmentation of brain MR images through a hidden Markov random field model and the expectation maximization algorithm. IEEE Trans on Medical Imaging, 20(1):45-57, 2001.
13. Bates D, Mächler M, Bolker B, Walker S. Fitting linear mixed-effects models using lme4. J Statistical Software 2015;v67i01.
14. He X and Yablonskiy DA. Biophysical mechanisms of phase contrast in gradient echo MRI. PNAS 2009;106(32):13558-13563.
15. Yablonskiy DA, Luo J, Sukstanskii AL, et al. Biophysical mechanisms of MRI signal frequency contrast in multiple sclerosis. PNAS 2012;109(35):14212-14217.
16. Prineas JW, Barnard RO, Kwon EE, et al. Multiple sclerosis: Remyelination of nascent lesions. Ann Neurol 1993;33(2):137-151.
17. Lassmann H, Brück W, Lucchinetti C, et al. Remyelination in multiple sclerosis. Mult Scler 1997;3:133-136.
18. van Waesberghe JH, van Walderveen MA, Castelijns JA, et al. Patterns of lesion development in multiple sclerosis: longitudinal observations with T1‐weighted spin‐echo and magnetization transfer MR. AJNR Am J Neuroradiol 1998;19:675–83.
19. Bagnato F, Jeffries N, Richert ND, et al. Evolution of T1 black holes in patients with multiple sclerosis images monthly for 4 years. Brain 2003;126:1782-1789.
Figures