0150
Proton exchange rate increases in MS lesionsMehran Shaghaghi1, Weiwei Chen2, Alessandro Scotti3,4, Haiqi Ye5, Yan Zhang5, Wenzhen Zhu2, and Kejia Cai3,6
1Radiology, University of Illinois, Chicago, IL, United States, 2Department of Radiology, Huazhong University of Science & Technology, China, China, 3Radiology, University of Illinois at Chicago, Chicago, IL, United States, 4Bioengieering, University of Illinois at Chicago, Chicago, IL, United States, 5Huazhong University of Science & Technology, Wuhan, China, 6Bioenginnering, University of Illinois at Chicago, Chicago, IL, United States
Synopsis
We have evaluated the performance of magnetic resonance proton exchange (Kex) imaging in vivo in characterization of gray matter, white matter as well as MS lesions. With informed consent, 10 control and 8 MS diagnosed subjects underwent a brain MRI on a 3T clinical-scanner. Kex maps were generated by pixel-wise fitting of the omega plot constructed from four different saturation power (B1=1, 2, 3 & 4 µT). Kex values from gray matter (GM), white matter (WM) and lesions were calculated, and two-tailed paired Student’s T-test was used to classify each group. Kex was able to demarcates each region. The combined use of Kex mapping has potential to improve the early and specific diagnosis of MS.
Purpose
Proton exchange is the fundamental mechanism underpinning CEST MRI contrast, and it has been reported that mapping of the proton exchange rate (Kex) may help the clinical diagnosis of stroke and cancer [1, 2]. Omega plot has been used to calculate proton exchange rates of paraCEST agents [3], which labile protons resonate far off from water resonance and hence provide a contrast unperturbed by the direct saturation (DS) or spillover effect. Spillover-corrected omega plots have been successfully implemented for Kex mapping in solutions [4]. Here, we aim to map the proton exchange rate of in vivo human brains, healthy or diagnosed with Multiple Sclerosis (MS), using omega plot and direct saturation removed Z-Spectral data.Introduction
Proton MRI signals (Mz) acquired at different saturation power (B1) are used to construct the “omega plots” [3] for measuring exchange rate directly from the X-intercept of the plot. However, the acquired MRI signal post saturation is not purely affected by proton exchange manipulated mechanisms, such as CEST, MT, and NOE effects. It is also affect by the dominant water DS (or spillover) effect particularly when the saturation offset is close to water central frequency. To remove the DS effect, Z-spectrum fitting with multiple Lorentzian functions was proposed [5] and have gained in popularity. In this study, we will compute proton exchange rate maps of healthy and MS diagnosed human brains with omega plot. Brain Z-spectrum data were collected and fitted to remove the DS component. Mz free from direct saturation contribution is then used in the omega plot for computing Kex in the brain.Methods
10 healthy and 8 MS diagnosed human subjects were MRI scanned at a 3T GE MR750 scanner. Z-spectra of the brain were acquired at four increasing saturation power (B1=1,2,3 & 4 µT), with saturation duration of 1.5 s, and frequency offsets ranging from -6 to +6 ppm, +15.6 & +39.1 ppm. Z-spectral raw data were fitted to a model including 2 Lorentzian functions, corresponding to DS, and the DS-removed residual spectrum. DS fit was then subtracted from the raw Z-spectra and the B0-corrected residual signals (Mz at +3.5ppm) were used for further omega plot analysis (Fig. 1). The omega plot was constructed by computing Mz/(M0−Mz) as a linear function of 1/ω12, where M0 is taken from the signal at 39.1ppm and ω1=γB1 is in unit of rad/s. The pixel-wise exchange rate Kex is then calculated from the intercept on the X axis of the omega plot as shown in Fig. 1. Two-tailed paired Student’s T-test was used to compare Kex in brain gray matter (GM), white matter (WM) and the lesions, which were segmented based on MT contrast maps using MATLAB’s routine ‘Fuzzy C-Means Clustering’ method. In order to validate this approach for proton exchange rate quantification, in vitro protein solution phantoms (20% BSA, n=3) at varied pH (6.2, 6.6, 7.0 & 7.4) were studied with the same protocols at a 9.4T preclinical Agilent MRI System.Results
In vivo Kex mapping of human brains shows significant distinction between gray matter, white matter and the lesions (Fig. 2), with average value of 575±20 s−1 for WM, 616±29 s−1 for GM and 754±50 s−1 for the lesions (p ≤ 0.001) (Fig. 3). The constructed Kex maps are free from apparent imaging artifacts. CEST and MTC maps were also quantified. Kex maps showed apparently different pattern than the conventional CEST and MT contrast maps (Fig. 2). In the phantom study (Fig. 4), exchange rate maps show increased Kex with increasing pH as expected [6].Discussion and Conclusion
In this study, we demonstrated the in vivo proton exchange rate mapping of human brain, delineating differences in gray and white matter, as well as the lesions in MS patients. MS lesions show significantly elevated proton exchange rate than normal brain tissues. The fundamental mechanism at the origin of this difference is under investigation. Our analytic approach was validated with imaging phantoms. The imaging time can be greatly shortened with reduced number of Z-spectra, sparse data points, and fast imaging acquisition. In conclusion, this study shows great promise for in vivo proton exchange rate imaging and its clinical applications.Acknowledgements
This study is supported by US NIH grant R21EB023516 and China NSF grant 81401390.References
[1] Zhou, J. et al. MRM 50: 1120-1126. [2] Cai, K. et al. Nat. Med.18:302–306. [3] Dixon W.T. et al. MRM 63(3):625-32. [4] Sun, Z. S. et al. Contrast Media Mol. Imaging. 9(4):268–275. [5] Cai, K. et al. NMR Biomed. 28(1):1-8. [6] Jin T. et al. MRM 65(5):1448-60.Figures
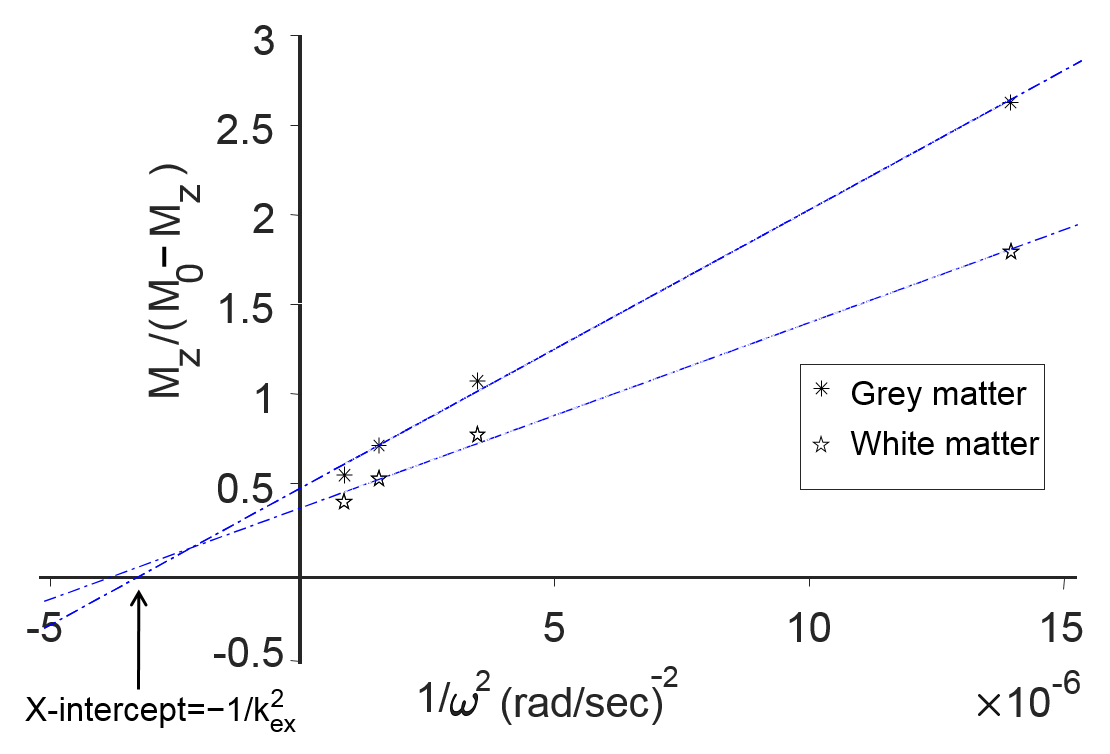
Typical omega plot Mz/(M0-Mz)
vs. 1/ω12 for
a healthy brain subject GM and WM ROIs using a 1.5s saturation
pulse at (B1=1 to 4µT) power levels.
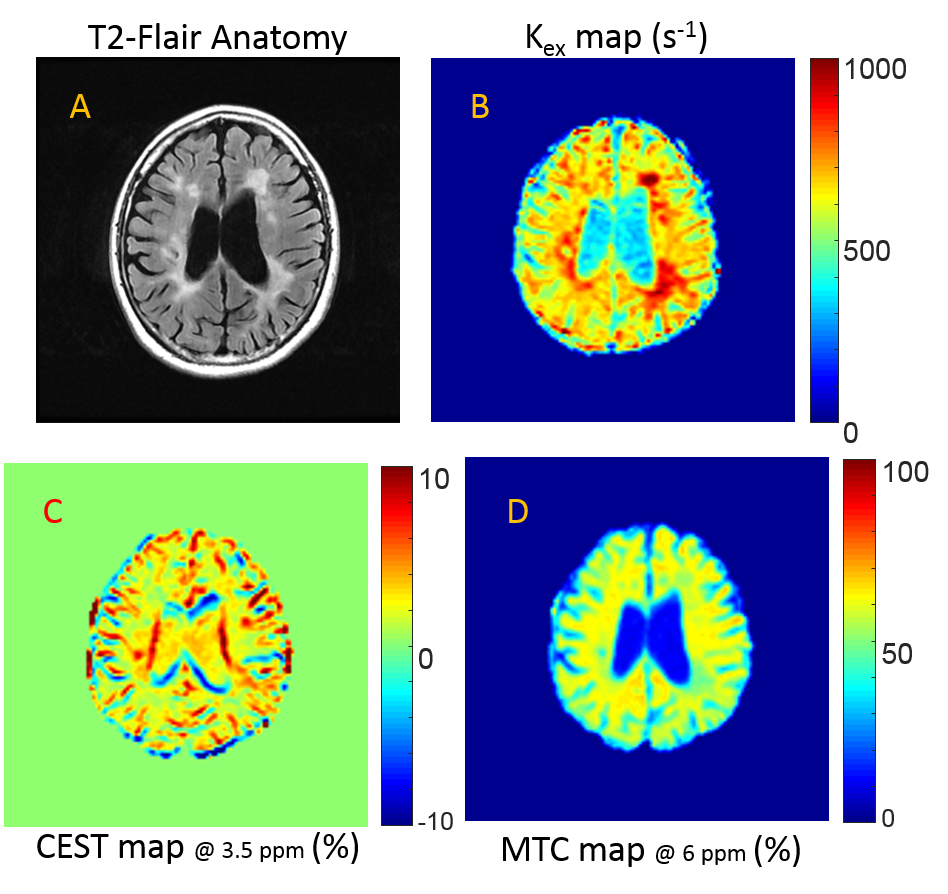
A) T2-weighted
anatomical image of a representative subject. B) The corresponding proton exchange
rate map. C). CEST map: [(M-z−Mz)/ M0]
constructed from B1=3µT Z-spectrum. D). MT
contrast map: [(M0−Mz)/
M0] constructed from B1=3µT Z-spectrum.
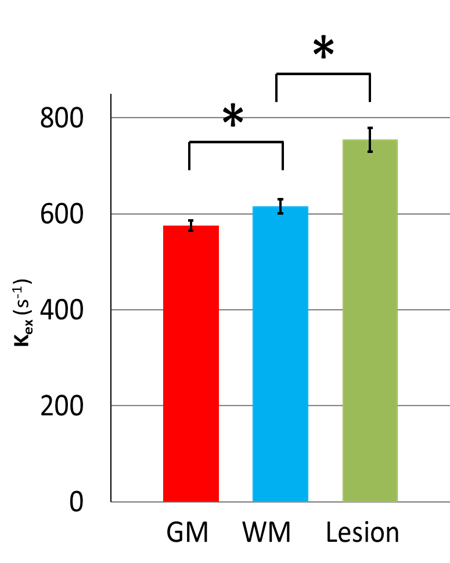
Lesions show significant
higher Kex than gray and white matter (*p ≤ 0.001).

Exchange rate value (s−1) maps from the
phantom study show proton exchange rate value increase with pH.