0149
NaSA-CEST MRI: comparison with Gd-enhanced contrast for imaging brain inflammationXiaolei Song1,2, Yanrong Chen1,3, Chenwang Jin1,2, Tao Liu1,2, Chengyan Chu1,2, Yuguo Li1, Yue Yuan1,2, Xiaowei He3, Piotr Walczak1,2, and Jeff WM Bulte1,2
1Russell H. Morgan Dept. of Radiology and Radiological Science, Johns Hopkins University, Baltimore, MD, United States, 2Cellular Imaging Section, Institute for Cell Engineering, Johns Hopkins University, Baltimore, MD, United States, 3Dept. of Information Sciences and Technology, Northwest University, Xi'an, China
Synopsis
Sodium salicylate (NaSA), a nonsteroidal anti-inflammatory drug and the main metabolite of aspirin, accumulates specifically in inflamed tissue. Since NaSA can be detected with CEST-MRI at millimolar concentrations, we investigated the use of NaSA-enhanced CEST MRI for in vivo mapping of brain inflammation, induced by intracerebral injection of lipopolysaccharide in mice. NaSA-CEST shows signal enhancement in the inflamed LPS-injected hemisphere, which was not observed in two control groups. NaSA-CEST exhibits distinct signal kinetics and enhanced regions from that of Gd-enhanced MRI, and shows correlations with histological staining of inflammatory markers, indicating its potential as a new platform for imaging neuroinflammation.
Introduction
Sodium salicylate (NaSA), a nonsteroidal anti-inflammatory drug (NSAID) and the main metabolite of aspirin, accumulates specifically in inflamed tissue [1], where it exerts analgesic, antipyretic, and anti-inflammatory effects. We previously demonstrated that NaSA can accumulate ex vivo in lipopolysaccharide (LPS)-treated mouse brain slices [2], and that NaSA can be detected with CEST-MRI at millimolar concentrations [3]. NaSA accumulation is in the mM range in inflamed tissue in rodents [1]; For man taking therapeutic dose of aspirin: ~150-300 mg/L (~1-2 mM) in plasma. Here, we investigated the use of NaSA-enhanced CEST MRI for in vivo mapping of brain inflammation.Methods
Focal neuroinflammation was induced by a unilateral intrastriatal injection of 2 ul of 5 mg/ml lipopolysaccharide (LPS) in C57/Bl6 mice (n=8). For another group of sham mice, saline was injected instead of LPS using the same surgical procedure. 24-48 hours later, mice underwent MR scans on a 11.7 T horizontal scanner, before and after i.v. injection of 100 ul NaSA (100 mg/kg bw). A single-slice RARE sequence was used to acquire pre- and post-NaSA injection images, with a saturation frequency offset at 9.3 ppm (peak frequency for NaSA) and saturation B1 = 5.9 uT and Tsat = 2.5 sec. (TR / effective TE = 5500 ms / 4 ms with RARE factor = 16, in-plane resolution is 0.17 mm X 0. 23 mm with slice thickness = 1.2 mm). The dynamic NaSA-CEST signal at time-point t was quantified by [S(+9.3ppm, t)-S(+9.3ppm, 0)]/S0. CEST Zspectra were also collected at both pre- or post-injection of NaSA, with the offset frequency sweeping from 8.4 ppm to 10.8 ppm. At the end of MRI, Gd-enhanced T1-w images were collected to verify the blood-brain-barrier (BBB) status, using a RARE sequence (TR / effective TE = 800 ms / 5.6 ms with RARE factor = 4). The enhanced region on both NaSA-CEST images and Gd-enhanced images were defined by only including the voxels with higher intensity than the averaged value of the brain in the slice except for the ventricles. Post-mortem immunohistology was performed using H&E staining, microglia (anti-Iba1) staining, and anti-COX1 staining.Results
For the group of inflamed mice, the dynamic NaSA-CEST images exhibit more enhancement on the LPS-injected ipsilateral sides compared to the non-injected contralateral side, with the signal increasing from ~10 min post intravenous injection of NaSA (Fig.1 A, Fig.3 A). While the T2w image showed signs of hemorrhage and edema and post-Gd T1w indicated areas of a disrupted BBB, the NaSA-CEST images from 15 to 45 min were found to highlight regions similar to the distribution of Iba1+ activated microglia (Fig. 1A). In contrast, sham mice showed much lower NaSA-CEST signal than those in the inflamed group, indicating no inflammation as validated by immunohistology (Fig. 1B). The vehicle group, with i.v. injection of saline instead of NaSA, did not show NaSA-CEST enhancement either at the sites of inflammation (Fig. 1C), indicating that the NaSA-CEST signals in Fig.1A is specifically from NaSA but not tissue or LPS. The Z-spectra differences between pre-injection and ~40min post-injection of NaSA further validated the observed peaks at ~9.3-9.6 ppm (Fig. 2A). When comparing the NaSA-CEST signals with immunohistology for five different brain regions (enhanced region, cortex and striatum in the LPS-injected side and their mirrored contralateral regions), both COX1 and Iba1 intensity correlated to the NaSA-CEST signal, with the later showing a slightly higher R2 (Fig. 2B). We also compared NaSA-CEST for inflammation with Gd-DCE for imaging BBB status, where they display distinct signal kinetics (Fig.3 A&B) and enhanced regions (Fig.3 C). Briefly, the dynamic NaSA-CEST signal keep increase until more than 1 hour post i.v. injection of NaSA (n=8, Mean ± SEM), while Gd-DCE (B, n=5, Mean ± SEM) rises very fast in the LPS-injected striatum with clear difference from the contralateral stratum in < 5min post i.v. injection of Gd, and the signal starts decaying after 20 min post-injection. The enhanced regions of these two types of images also exhibited poor shape correlation, with a correlation coefficient of 0.33 ± 0.07 (n=5, Mean ± STD).Conclusion
NaSA-CEST MRI shows specific signal enhancement in the inflamed LPS-injected hemisphere, which was not observed in two control groups, which are the sham group and the vehicle group. NaSA-CEST MRI exhibits distinct signal kinetics and enhanced regions from that of Gd-enhanced MRI, and also shows correlations with histological staining of inflammatory markers, indicating it could be used as a new platform for imaging of neuroinflammation.Acknowledgements
NIH R21EB020905, Johns Hopkins Dept. of Radiology Britestar awardReferences
[1] Rainsford, K.D. et al., Arch. Int. Pharmacodyn. 1981;250:180. [2] Schaffhauser M. et al., WMIC 2016. New York City, P2493111 [3] Song X. et al., J. Cereb. Blood Flow Metab. 2016;36:1186.Figures

Figure 1. In vivo NaSA-CEST MRI
acquired 24-48 hours post intra-striatum injection of LPS (inflamed group) and
two control groups (sham group & vehicle group), using a bonus i.v.
injection of NaSA (100mg/Kg bodyweight) as contrast agent. (A) inflamed mouse vs.
(B) sham mouse vs. (C) Vehicle mouse, with upper row: the dynamic
NaSA-CEST images, lower row: the T2-w, T1-w and histological images

Figure
2 (A) ΔZspectra of pre- and
post-injection of NaSA for the inflamed group (n=4), showing a NaSA-specific
spectra with the peak ~9-10 ppm. (B) Correlation between NaSA-CEST and
fluorescence intensity of anti-COX-1 (left) and anti-Iba-1 (right) staining,
for five different brain regions (enhanced region, cortex and striatum in the
LPS-injected side and their mirrored contralateral regions)
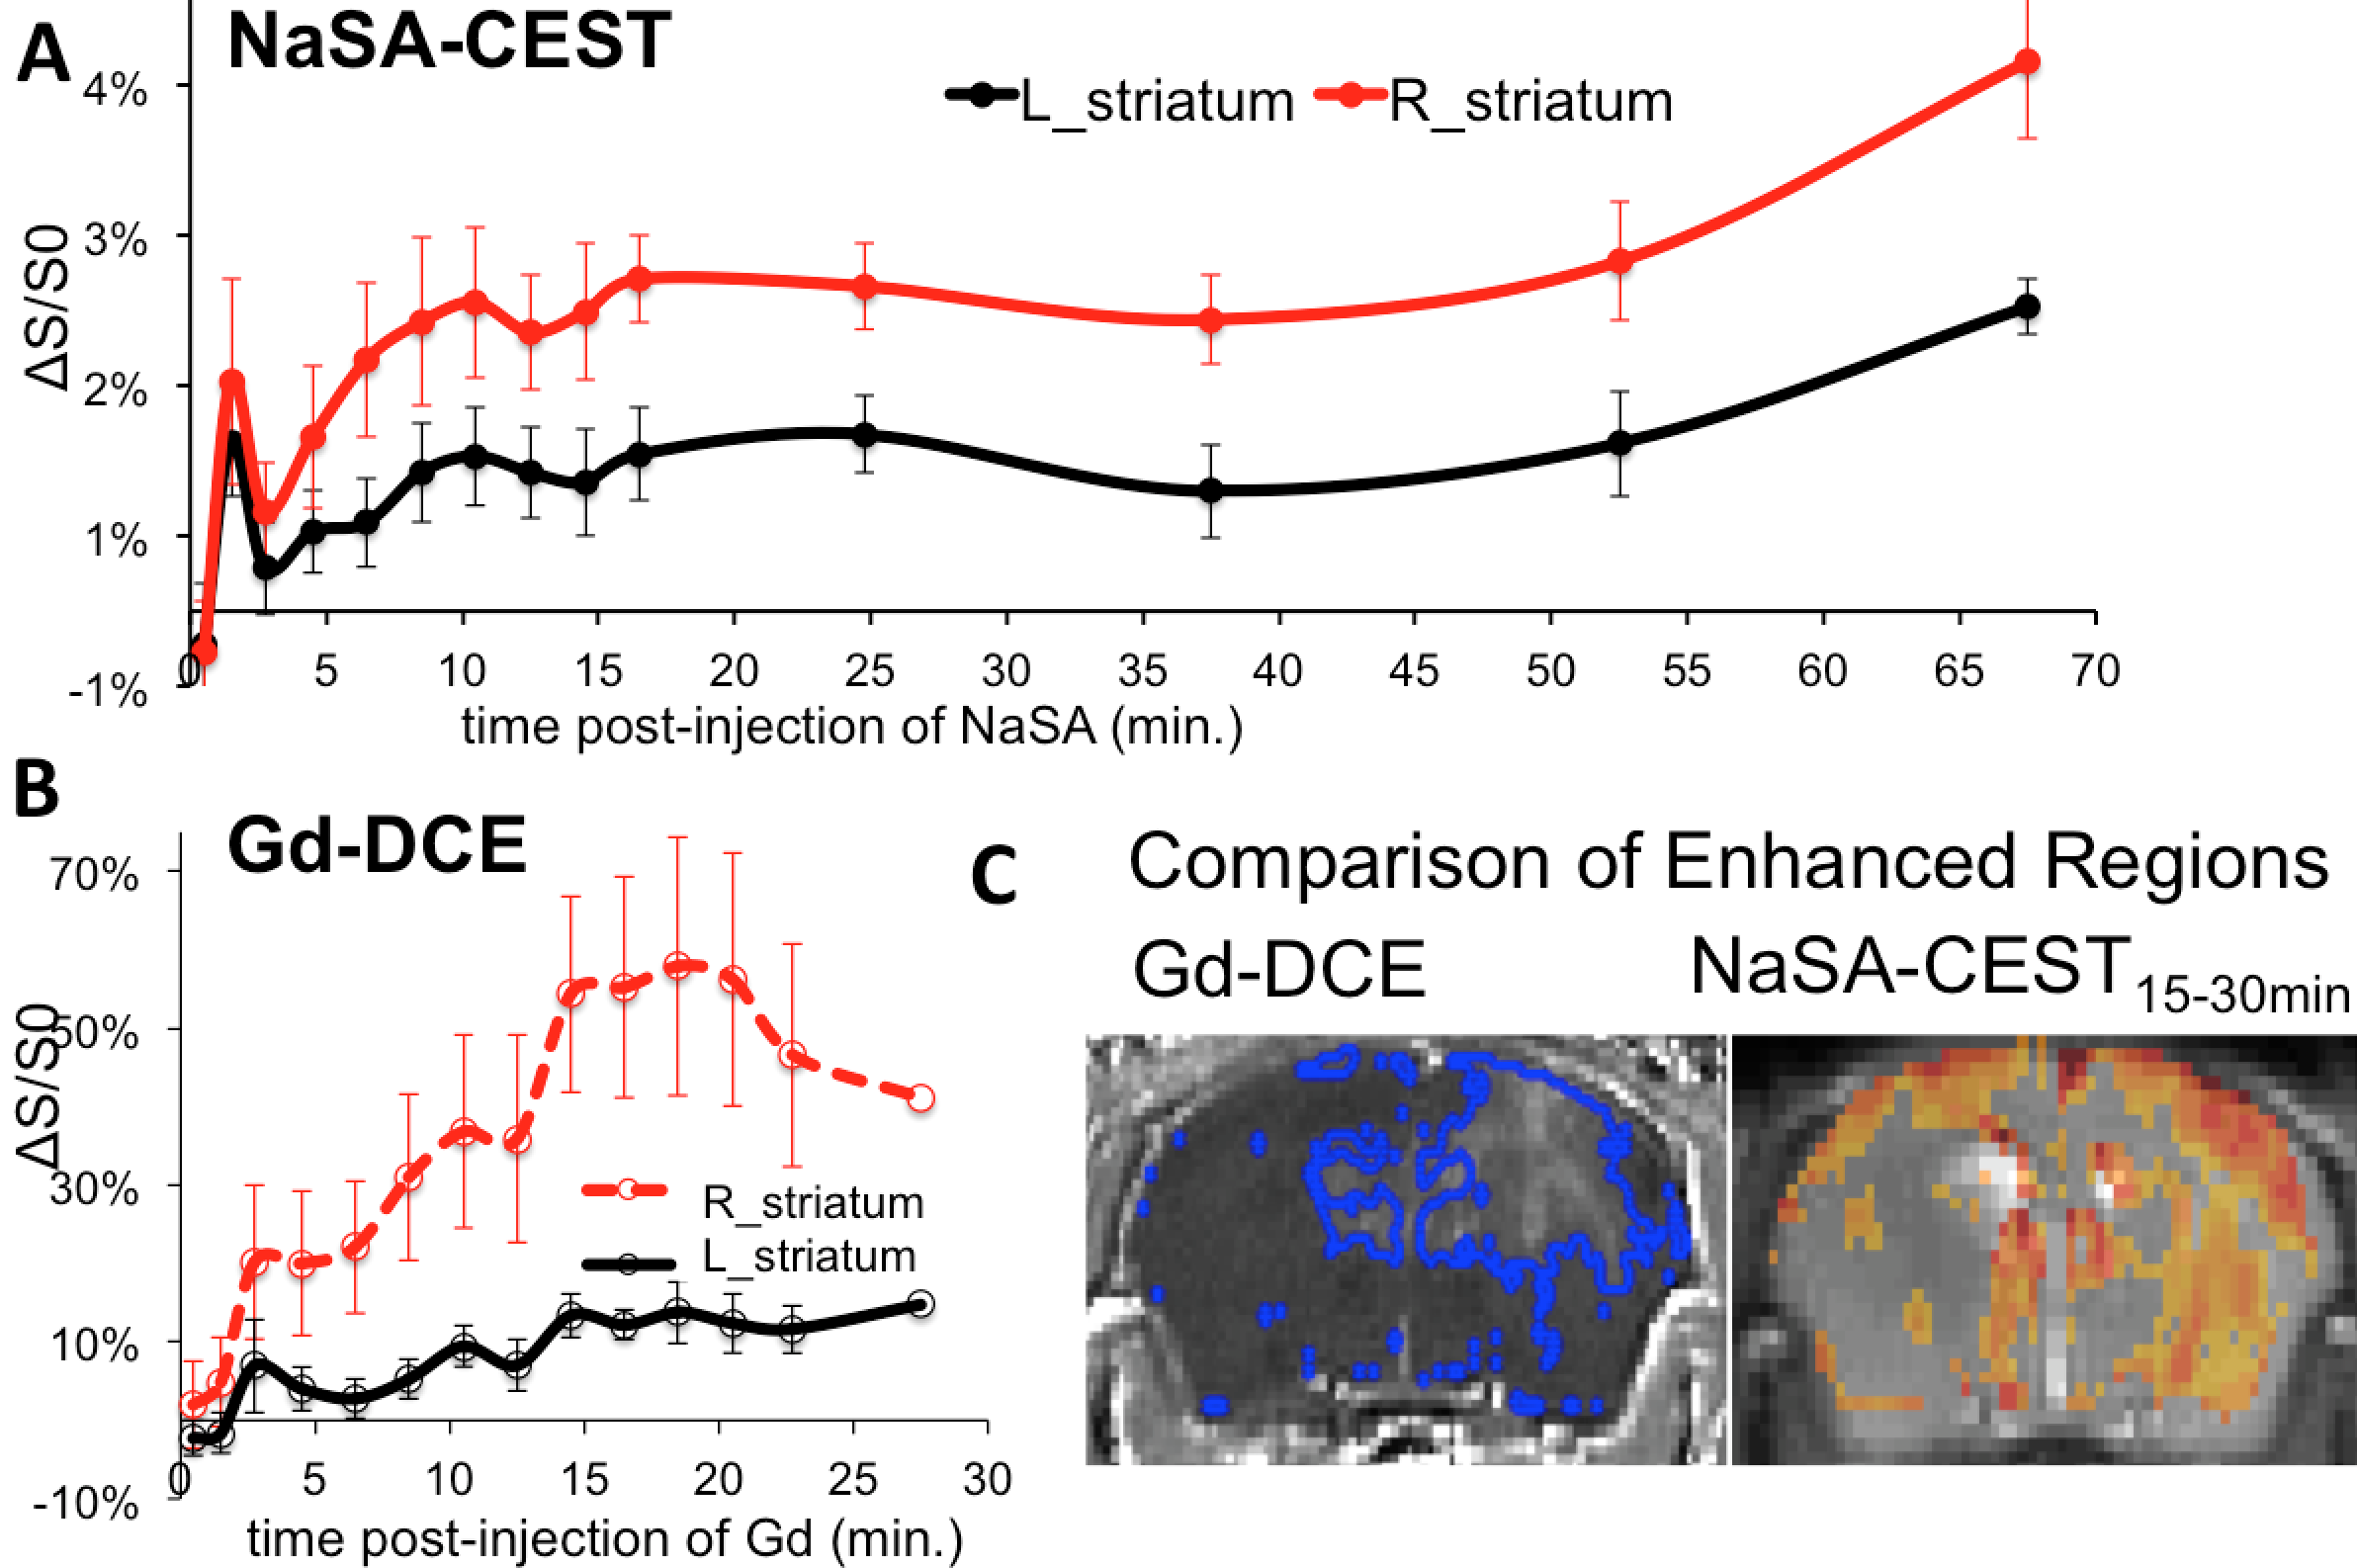
Figure
3. Comparison between NaSA-CEST for inflammation and Gd-DCE for BBB status, The dynamic
NaSA-CEST signal keep increase until more than 1 hour post i.v. injection of
NaSA (A. n=8, Mean+/-SEM), while Gd-DCE (B., n=5, Mean +/-SEM) rises
very fast in the LPS-injected striatum with clear difference from the
contralateral stratum in <5min post i.v. injection of Gd, and the signal starts decaying after 20min
post-injection.C. NaSA CEST and Gd-DCE have distinct enhanced regions with poor
correlations in shape (0.33+/-0.07, n=5),
which were calculated by including the voxels with intensity higher than
the average of the whole brain.