0147
Amide proton transfer (APT) imaging of uterine cervical cancer; prediction of histological findings1Department of Clinical Radiology, Kyushu university, Fukuoka, Japan, 2Department of Anatomic Pathology, Kyushu university, Fukuoka, Japan, 3Department of Obstetrics and Gynecology, Kyushu university, Fukuoka, Japan, 4Philips Research, Hamburg, Germany
Synopsis
It is important to diagnose histological type and existence of parametrial invasion in uterine cervical cancer as correctly as possible because these factors are important in choosing treatment strategies or predicting prognosis. The objective of our study is to investigate whether amide proton transfer (APT) imaging is useful for evaluation of uterine cervical cancer. We compared the APT signal of uterine cervical cancer with different histological findings (histological type and existence of parametrial invasion) using three different durations of presaturation pulse.
Purpose
Uterine cervical cancer (CC) is one of the most common forms of cancer among women worldwide.1 The most frequent histological type of CC is squamous cell carcinoma (SCC), followed by adenocarcinoma (AC) or adenosquamous carcinoma (AS). SCC is known to show better prognosis than AC.2 Parametrial invasion (PMI) is also an important factor to choosing treatment strategies or predicting prognosis.3 Currently, the diagnostic ability of these histological findings using conventional imaging techniques is still controversial, and needle biopsy or surgical resection is necessary.4-6 Therefore, further imaging technique development is needed. Amide proton transfer (APT) imaging is a novel magnetic resonance imaging (MRI) technique that reflects concentration of mobile proteins/peptides. Previous studies have reported the clinical utility of APT imaging to estimate the aggressiveness of several kinds of tumors.7-10 Although there has been no report discussing the clinical potential of APT imaging for the evaluation of CC, we hypothesized that APT imaging might be useful for non-invasive histological diagnosis of CC like other tumors as well. Our purpose was to investigate the advantage of APT imaging in evaluation of CC.Materials and Methods
A total of 61 patients (age = 50.3 ± 16.3 years) with CC were enrolled in the study (SCC: N=50, AS: N=5, AC: N=6). All cases were histologically confirmed by surgical resection or needle biopsy. All MRI sessions were conducted in a 3.0-Tesla clinical scanner (Achieva 3.0T TX, Philips Healthcare, Best, the Netherlands). T2-weighted images (T2WI) and diffusion-weighted images (DWI) (b=0 and 1000 s/mm2) were obtained as a part of our clinical routine. On a single 5mm-slice delineating the maximum diameter of the tumor, APT imaging was performed as follows: 2D-TSE images with driven equilibrium refocusing were obtained following a presaturation pulse (B = 2.0 μT, duration = 0.5, 1.0 and 2.0 s) which was applied at 25 frequency offsets from 6 to −6 ppm with an interval of 0.5 ppm. Other imaging parameters were: TR/TE = 5000/6 ms, FOV = 230×230 mm2, resolution = 1.8×1.8×5 mm3. A control image was obtained with the presaturation pulse at −1560 ppm. δB maps were acquired separately for a δB correction. The z-spectra were fitted through all offsets on a pixel-by-pixel basis followed by the correction for δB inhomogeneity. MTR asymmetry (MTRasym) was defined as: MTRasym = Ssat(−offset)/S0 − Ssat(+offset)/S0, where Ssat and S0 are signal intensities on the images with presaturation pulse at 6 to −6 ppm and control (−1560 ppm), respectively. The calculated MTR map at the offset of 3.5 ppm is called the APT-weighted image. APT signals with presaturation pulse length of 0.5, 1.0 and 2.0 s were defined as APT0.5, APT1.0 and APT2.0, respectively. Apparent diffusion coefficient (ADC) maps were generated referring to the SIs of DWI with b-values of 0 and 1000 s/mm2. Regions-of-interest were carefully placed within the tumors on each image or map.Results
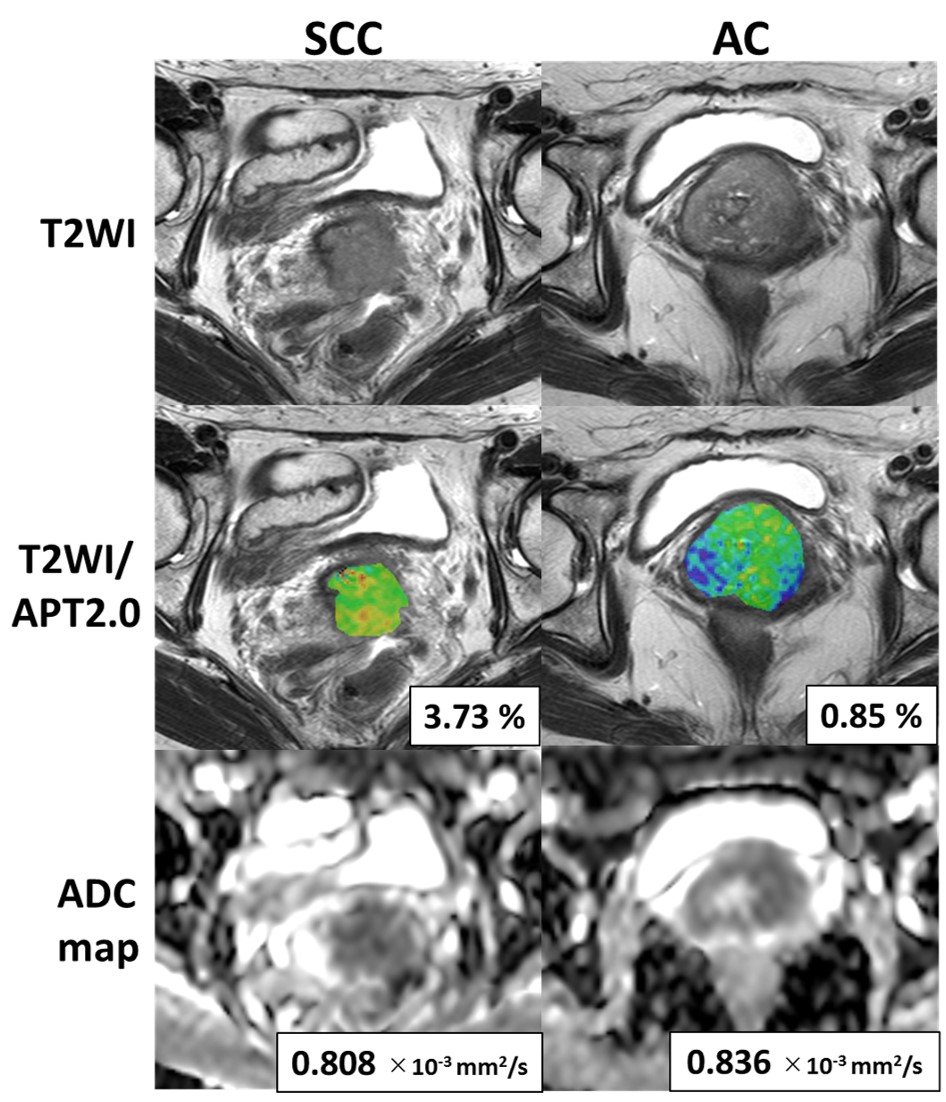
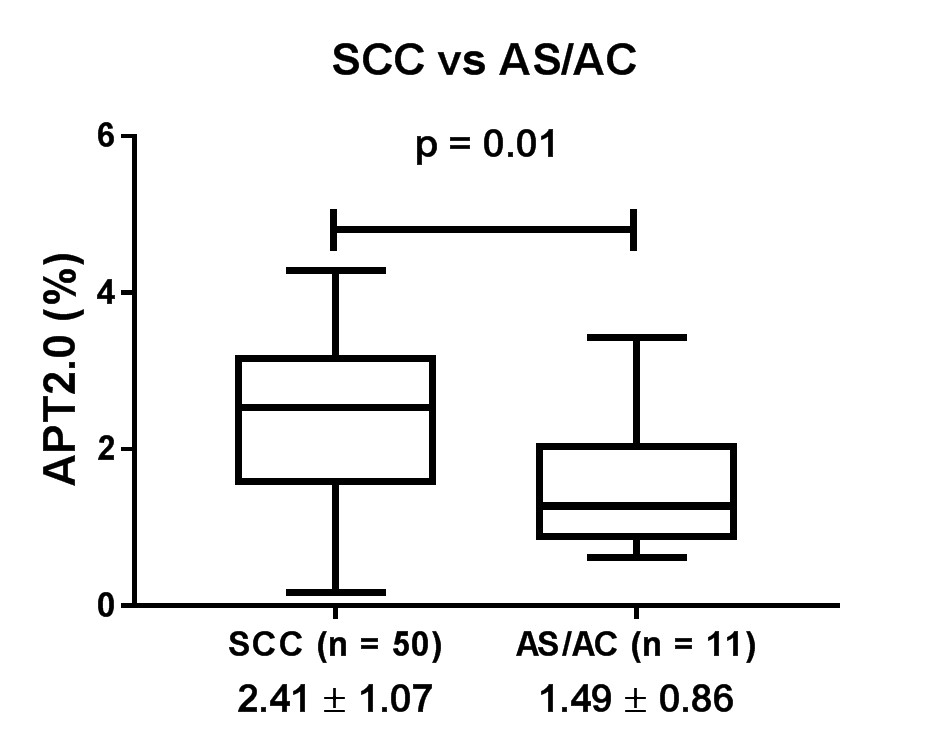
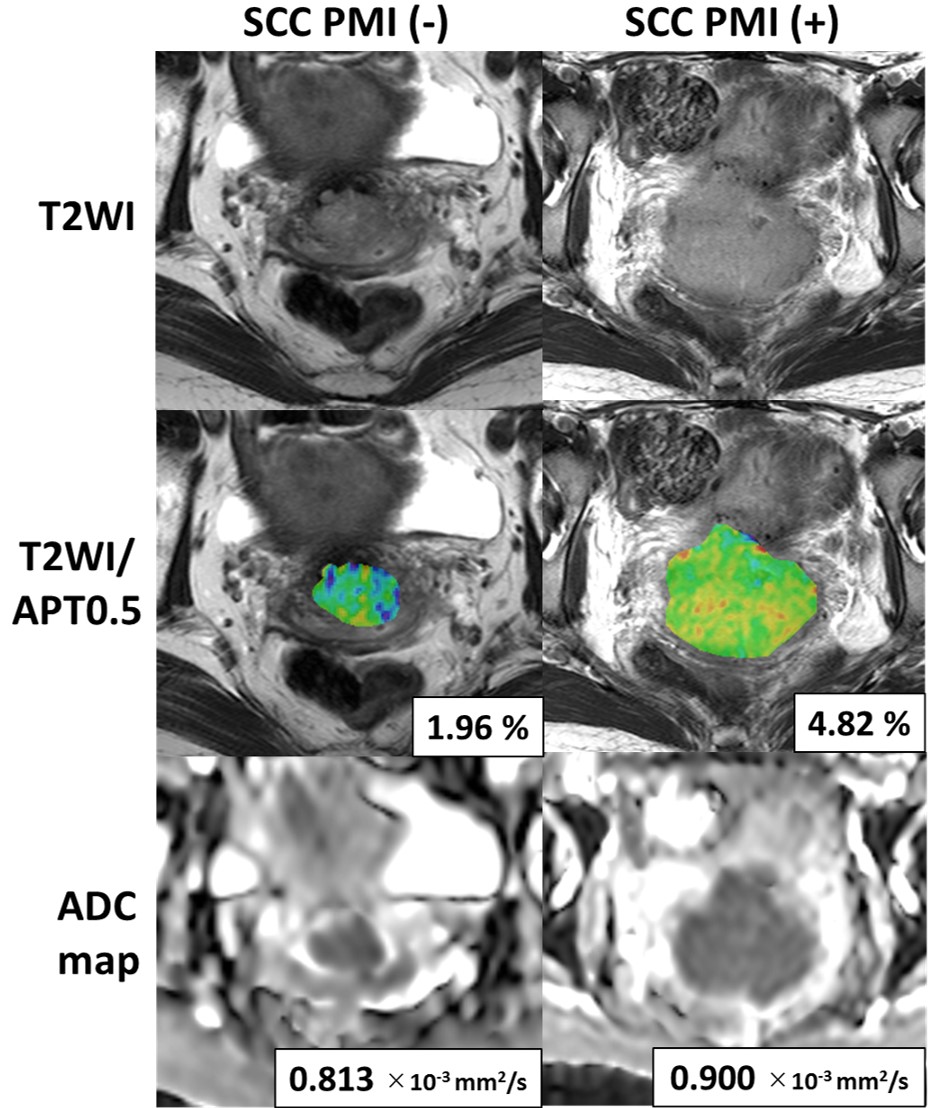
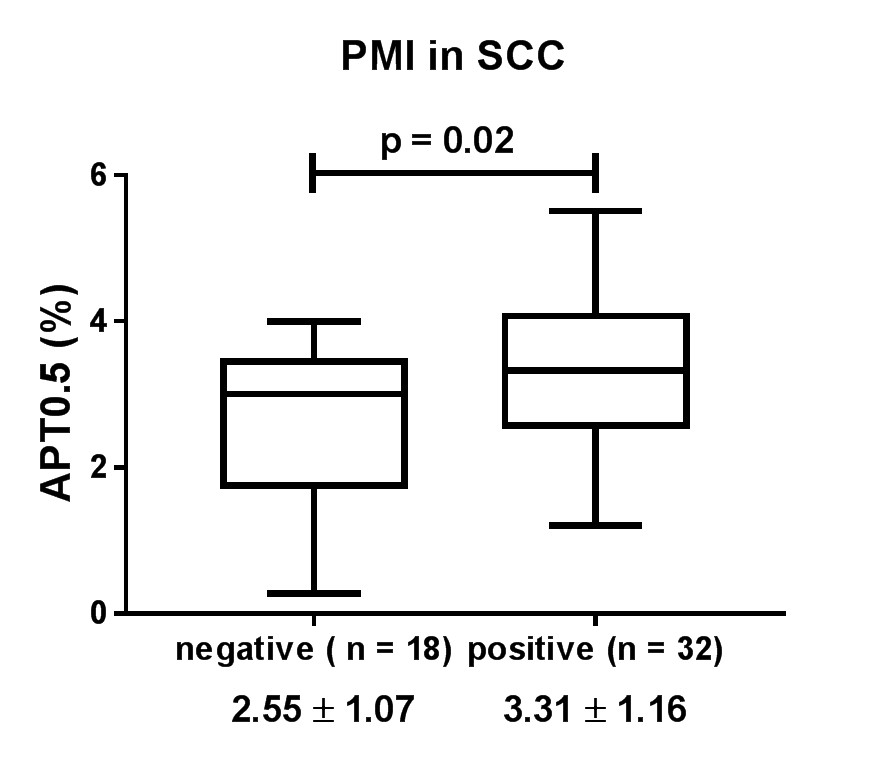
Figure 1 shows the typical T2WI, ADC map and APT2.0 map in SCC and AC where the APT2.0 values are different between the groups. APT signals in SCC tended to be higher than those in AS/AC and significant differences were observed in APT1.0 and APT2.0 (p<0.05, Fig. 2). In contrast, ADC value in SCC was significantly lower than that in AS/AC (p<0.001). Figure 3 shows the typical T2WI, ADC map and APT2.0 map in PMI positive and negative SCC cases where the APT0.5 values are obviously different between the groups. Compared only in the SCC patients, APT signals in PMI positive cases (N=32) tended to be higher than those in negative cases (N=18) and significant differences were observed in APT0.5 (p<0.05, Fig. 4), while there was no significant difference in ADC value.Discussion and Conclusion
The present study indicated that ADC value and APT signals showed significant differences between SCC and AS/AC. It is consistent with a previous report that ADC value in AS/AC was higher than that in SCC. 4 We also believe it is reasonable that APT signals in SCC and AS/AC differed since concentration of mobile protein/peptide or pH is assumed to be different. Further, among the SCC patients, our results showed that APT signal in PMI positive patients, which is expected to have more aggressive tumor, was higher than that in negative patients whereas ADC value could not show difference. When comparing in the same histological type, our result was compatible with previous reports in other tumors such as glioma or rectal adenocarcinoma that tumor aggressiveness and APT signals showed significant correlation.7-10 In conclusion, APT imaging may be useful to predict histological type or existence of PMI in CC.Acknowledgements
No acknowledgement found.References
1.
Cronin KA, Lake AJ, Scott S, et al. Annual Report to the Nation on the Status
of Cancer, part I: National cancer statistics. Cancer 2018;124(13):2785-2800.
2. Jung EJ, Byun JM, Kim YN, et al. Cervical Adenocarcinoma Has a Poorer Prognosis and a Higher Propensity for Distant Recurrence Than Squamous Cell Carcinoma. Int J Gynecol Cancer 2017;27(6):1228-1236.
3. Zullo MA, Manci N, Angioli R, Muzii L, Panici PB. Vesical dysfunctions after radical hysterectomy for cervical cancer: a critical review. Crit Rev Oncol Hematol 2003;48(3):287-293.
4. Lin M, Yu X, Chen Y, et al. Contribution of mono-exponential, bi-exponential and stretched exponential model-based diffusion-weighted MR imaging in the diagnosis and differentiation of uterine cervical carcinoma. Eur Radiol 2017;27(6):2400-2410.
5. Hori M, Kim T, Murakami T, et al. Uterine cervical carcinoma: preoperative staging with 3.0-T MR imaging--comparison with 1.5-T MR imaging. Radiology 2009;251(1):96-104.
6. Qu JR, Qin L, Li X, et al. Predicting Parametrial Invasion in Cervical Carcinoma (Stages IB1, IB2, and IIA): Diagnostic Accuracy of T2-Weighted Imaging Combined With DWI at 3 T. AJR Am J Roentgenol 2018;210(3):677-684.
7. Nishie A, Takayama Y, Asayama Y, et al. Amide proton transfer imaging can predict tumor grade in rectal cancer. Magn Reson Imaging 2018;51:96-103.
8. Takayama Y, Nishie A, Sugimoto M, et al. Amide proton transfer (APT) magnetic resonance imaging of prostate cancer: comparison with Gleason scores. MAGMA 2016;29(4):671-679.
9. Takayama Y, Nishie A, Togao O, et al. Amide Proton Transfer MR Imaging of Endometrioid Endometrial Adenocarcinoma: Association with Histologic Grade. Radiology 2018;286(3):909-917.
10. Togao O, Yoshiura T, Keupp J, et al. Amide proton transfer imaging of adult diffuse gliomas: correlation with histopathological grades. Neuro Oncol 2014;16(3):441-448.
Figures