0146
Z-Spectral Water-Fat Separation for APTw MRI in the Body using efficient Single-Echo Acquisitions1Philips Research, Hamburg, Germany, 2University of Texas Southwestern Medical Center, Dallas, TX, United States
Synopsis
An APTw/CEST-MRI technique to obtain water-only Z-spectra in the presence of fat is described. Water-fat separation in CEST is complicated by partial saturation of spectral fat components. Here, the saturation frequency-dependent water-fat phases are calculated using a multi-peak saturation model. A Z-spectrum acquisition with a single echo-shift is combined with a reference acquisition (S0) using 3 echo-shifts for water-fraction and B0-mapping. A B0-corrected, water-only Z-spectrum is obtained by complex rotations and weighted subtraction according to the water-fat phase. Volunteer examinations at 3T are shown (breast and abdominal). The single echo-shift technique offers a time-efficient means for water-fat separation in APTw/CEST-MRI.
Introduction
Amide Proton Transfer weighted (APTw) MRI1 in body applications is inherently sensitive to lipid signals affecting multiple spectral regions of the Z-spectra2. Therefore, lipid suppression or water-fat separation is commonly used. However, Z-spectral analysis needs a high signal stability (≈1%) and imperfections in fat suppression compromise robustness in fat-containing tissues. Water-fat separation based on Dixon-type acquisitions with multiple echo-shifts per saturation offset3 is less time efficient. Furthermore, water-fat separation may be compromised by partial saturation of spectral fat components by the CEST contrast preparation. Here, we propose to combine the information on water-fraction and B0 from a single reference saturation frequency offset (S0, far detuned) with single echo acquisitions throughout the Z-spectral range for efficient water-fat separation using a multi-peak fat saturation model.Methods
For the Z-spectrum, complex images S[ω]={SRe,SIm} are acquired with a single echo shift (ES). As reference, S0 (-1560ppm) is measured with 3 different ES for full water(W0)/fat/B0 assessment using a 3-point Dixon technique4,5. A multi-peak fat saturation model Fsat[ω], assuming a saturation linewidth of Δ= 1ppm, is employed to calculate the water-fat phase angle α[ω], which varies with ω because the fat spectrum is partly saturated by CEST contrast preparation (see Fig.1):
$$$F_{sat}[ω]=\sum_{k=1}^{N}p_k(1−L_k[ω])e^{i α_k}$$$
$$$L_k[ω]=\frac{Δ^2}{4(ω−ω_{F_k})^2+Δ^2}$$$
ωFk and pk denote the relative frequency and area of the individual peaks of the fat spectrum. α[ω] is then derived from the phase angle of Fsat[ω]:
$$$α[ω]=atan(Im[F_{sat}[ω]],Re[F_{sat}[ω]])$$$
A complex rotation on {SRe,SIm} with angle ε aligns the water signal with the real axis in each voxel and for each ω:
$$$ε=α[ω_0]−\phi_0−arcsin[\frac{W_0}{S_0}⋅sin(\pi−α[ω_0])]$$$
$$$\phi_0=atan(S_{Im}[ω_0],S_{Re}[ω_0])$$$
On the resulting complex data, a B0 correction is performed by Lagrange interpolation, shifting the spectral center according to B0. The water-only Z-spectrum is finally obtained via a combination of the resulting complex signals {SRe',SIm'}, similar to a single-point Dixon technique6:
$$$Re_{LC}[ω]=\frac{1}{S_0}[S_{Re}' − S_{Im}'⋅tan(\frac{\pi}{2}−α[ω])]$$$
This constitutes a subtraction of the projection of the lipid signal onto the real axis. The projection depends on the phase angle α[ω]. As an example for Z-spectral analysis, asymmetry analysis can be performed on ReLC[ω], providing water-only MTRasym;LC. Volunteer examinations were performed on 3T MRI systems with dual-channel body coil RF transmission (Achieva TX, Philips Healthcare, Netherlands) in the breast, using a 16-channel bilateral breast coil, as well as in the lower abdomen, using a 32-channel torso coil. RF saturation consisted of 40×50ms pulse elements alternatingly transmitted via the RF channels at 100% duty cycle, with a total duration of 2s and a B1,rms of 1.2μT (breast)/ 2μT (abdomen). For the breast examinations, a triple gradient-echo Dixon sequence was used with TR/TE1/∆TE = 5.2/1.58/1.0ms, flip angle (FA) = 10° and centric k-space ordering (low-high) at 34 different saturation frequency offsets from -6 ppm to 6 ppm and S0. For the single-echo reconstruction, only TE1 was used, except for the reference S0. In the abdominal example, Z-spectra were acquired with a single-shot fast spin echo (FSE) readout using TR/TE=6s/5.9ms, voxel size (1.8)2x5mm3, echo shift ES1=-0.52ms at 43 different saturation frequency offsets from -9.2 ppm to 9.2ppm (step 0.44ppm) and (S0). S0 was acquired with 3 different ES1,2,3=-0.52/0.0/+0.52ms.
Results
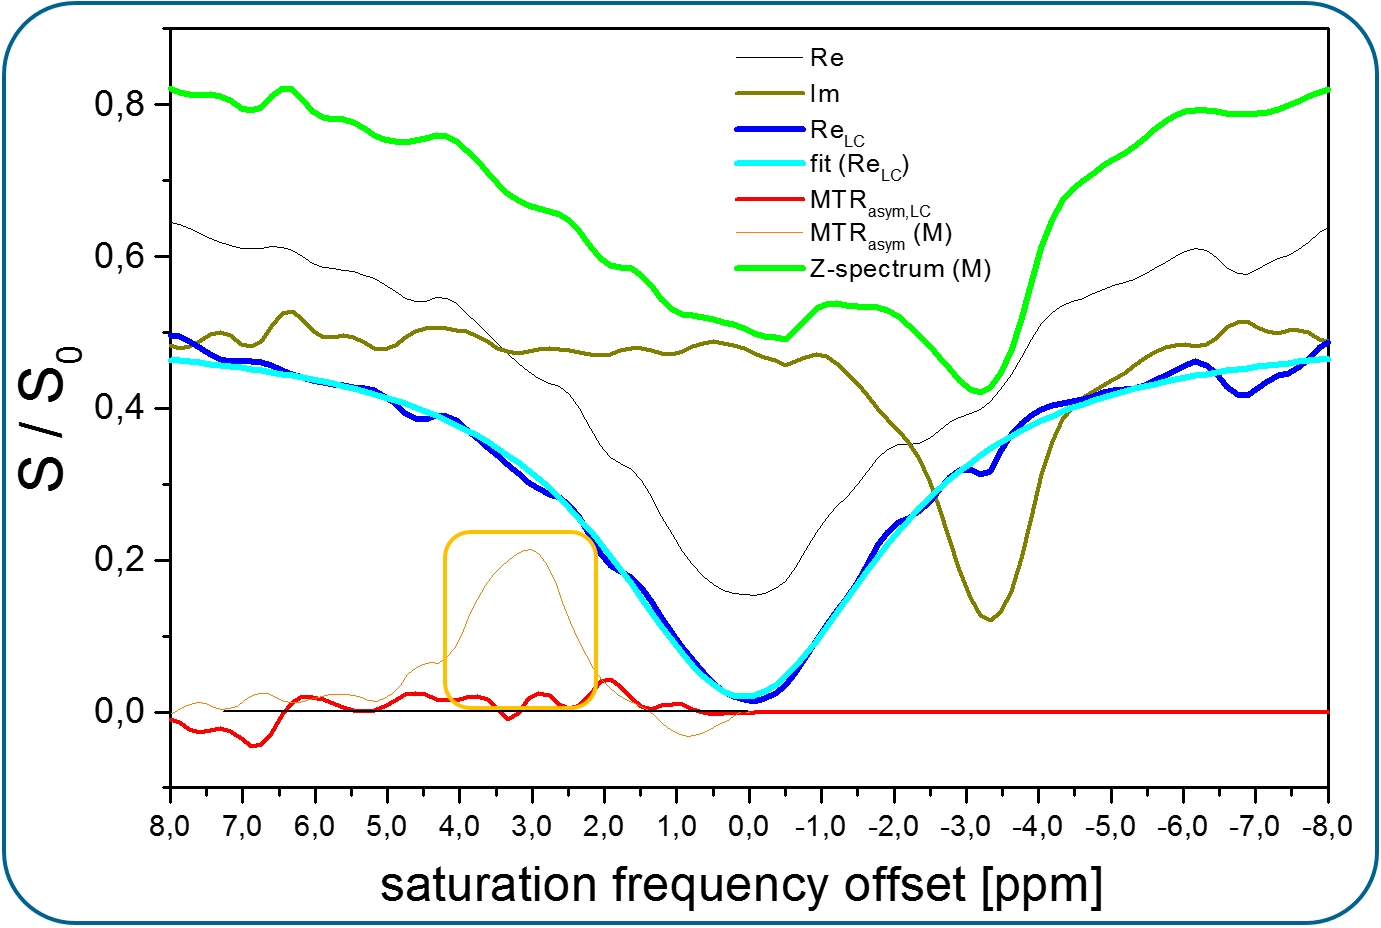
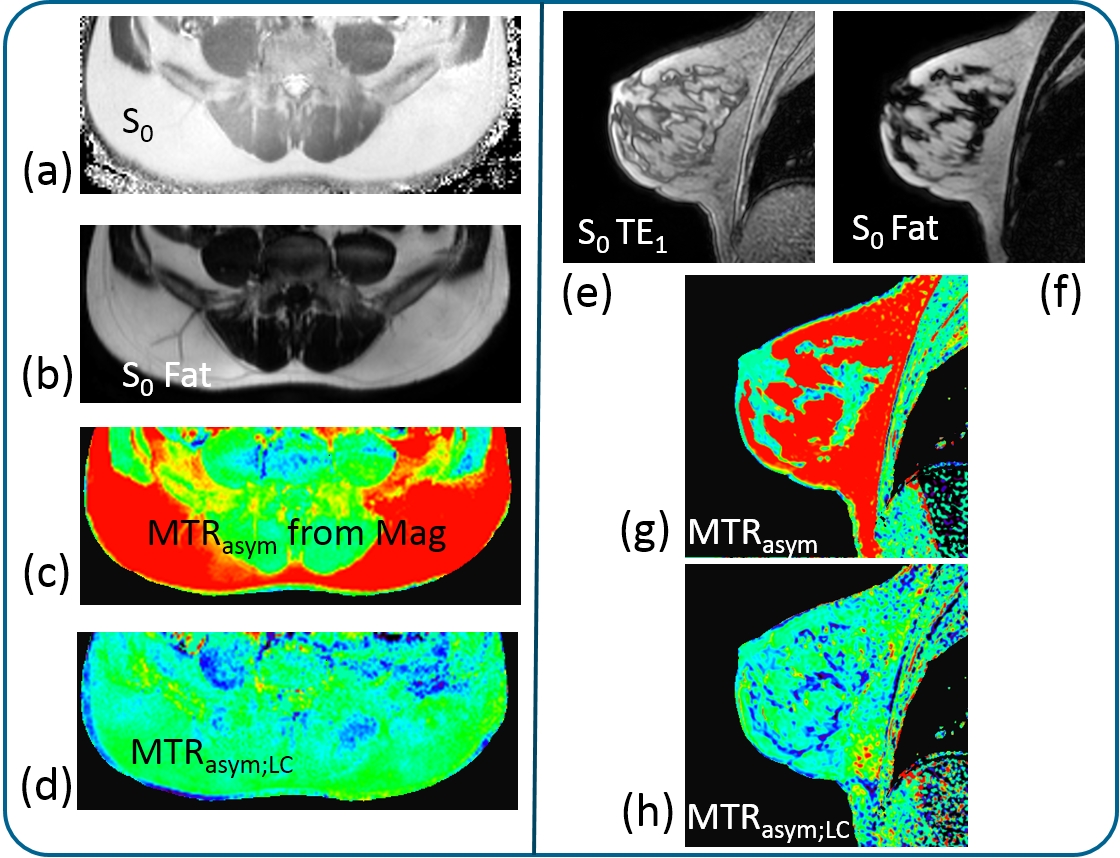
Figure 2 shows Z-spectra obtained in an ROI containing approximately 50% fat/water from an abdominal volunteer examination (labels explained in the figure caption). From a complex spectral behavior in the mixed voxel for 'Z-spectrum (M)', the spectrum is simplified up to a nearly symmetric representation of the water-only spectrum 'ReLC', which shows full saturation at ω=0. The fat related asymmetry artifact (MTRasym, orange box) is largely reduced by the correction technique (MTRasym,LC). Volunteer image examples are shown in Figure 3, with abdominal images on the left (a/b/c/d) and breast images on right (e/f/g/h), including S0 (a/e) and fat fraction W0 (b/f). In MTRasym from the magnitude (c/g), the red areas indicate a very large asymmetry from the fat signal. MTRasym;LC (d/h), based on the water-only Z-spectrum, shows very low asymmetry values including pure lipid voxels and partly lipid containing voxels.Discussion
A Z-spectral lipid suppression technique for APTw/CEST-MRI is described and tested in volunteer experiments. While multi-echo acquisitions for Z-spectral components provide full information on water/fat, the current work indicates, that fat separation may be efficiently performed using single echo shifts per saturation offset. Thus, SNR-efficient FSE acquisitions are possible, where the acquisition of multiple echo shifts would require impractically long acquisitions. Considering relevant spectral components in a multi-peak fat saturation model, the correction is expected to be valid in a large Z-spectral range and is possibly more accurate than standard water/fat separation, which assumes constant fat spectral compositions. Further studies are needed to evaluate this promising approach.Acknowledgements
No acknowledgement found.References
[1] Zhou J et al. Nature Medicine 2003; 9:1085; [2] Zhang S et al. Magn Reson Med. 2018; 79(5):2731; [3] Zhang S et al. Magn Reson Med. 2018; 80(3):895; [4] Dixon WT. Simple proton spectroscopic imaging. Radiology 1984; 153:189; [5] Reeder SB, et al. Magn Reson Med 2004; 51:35; [6] Ma J. J Magn Reson Imaging 2008; 27:881.Figures