0145
A Novel Approach for Improved CEST Imaging with Real-Time Frequency Drift Correction1Key Laboratory for Biomedical Engineering of Ministry of Education, Department of Biomedical Engineering, College of Biomedical Engineering & Instrument Science, Zhejiang University, Hangzhou, China, 2Department of Radiology, Children's Hospital, Zhejiang University School of Medicine, Hangzhou, China, 3Philips Healthcare, Shanghai, China, 4Clinical Research Board, Philips Research China, Shanghai, China, 5Department of Radiology, Johns Hopkins University, Baltimore, MD, United States
Synopsis
Chemical Exchange Saturation Transfer (CEST) imaging is highly sensitive to temporal B0 drift. Here, we proposed a novel frequency-stabilized CEST (FS-CEST) imaging sequence by adding a frequency stabilization module to the conventional non-frequency-stabilized CEST (NFS-CEST) sequence for correcting artifacts due to B0 drift in real time. The FS-CEST sequence was implemented in phantoms and 26 human volunteers, and generated substantially more stable magnetization transfer ratio asymmetry (MTRasym) spectra and amide proton transfer weighted (APTw) images than the conventional NFS-CEST sequence. The FS-CEST sequence provides an effective approach for B0 drift correction without additional scan time.
Introduction
Chemical Exchange Saturation Transfer (CEST) imaging is an emerging molecular imaging technique, which can detect endogenous low-concentration biomolecules possessing water-exchangeable protons with a significantly enhanced sensitivity 1-3. However, CEST imaging is highly sensitive to the main field B0 inhomogeneity 4. B0 drift is typically encountered in the echo planar imaging (EPI) sequences that require rapid gradient switching 5. Furthermore, B0 drift will not only occur during the EPI acquisition, but also continue for a considerable amount of time after the EPI acquisition until the shim elements completely cool down 6. As a consequence, if one performs a CEST imaging scan not long after an EPI acquisition, the performance of CEST imaging can be greatly influenced. The purpose of this study was to propose a frequency-stabilized CEST (FS-CEST) imaging sequence for correcting artifacts caused by B0 drift in real time.
Theory
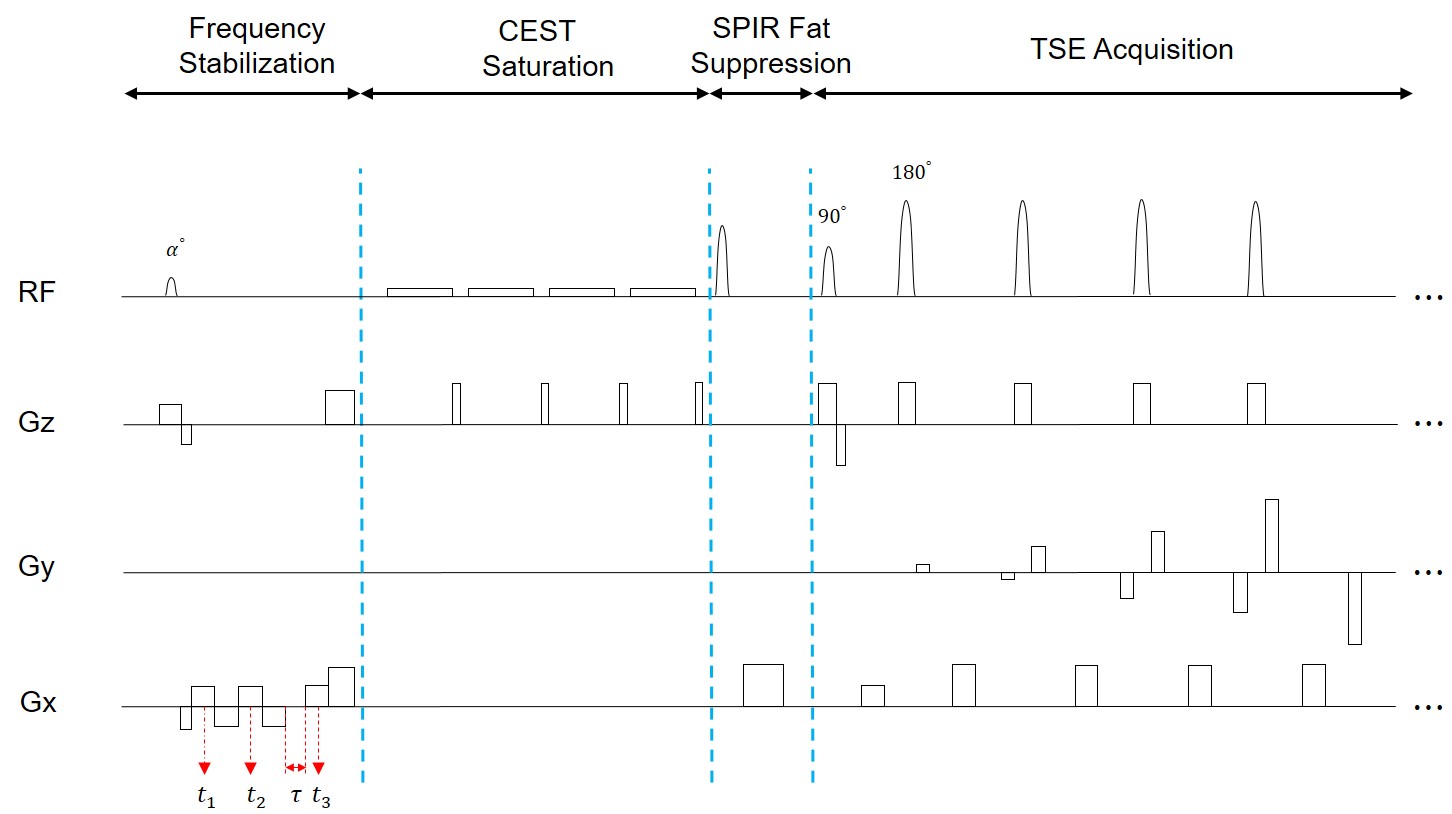
The FS-CEST sequence commences with an additional frequency stabilization module, in contrast with the conventional frequency-stabilized CEST (NFS-CEST) sequence (Fig. 1). In the frequency stabilization module, readouts of three non-phase-encoded k-space lines are acquired at $$$t_{1}$$$, $$$t_{2}$$$ and $$$t_{3}$$$ with a small-tip-angle $$$\alpha$$$ (Fig. 1). The phase difference between k-space lines can be calculated by Fourier transforming the acquired time-domain data, taking conjugate multiplication and then averaging all data points, which results in $$$\phi_{2-1}$$$ (phase difference between the second and first lines) or $$$\phi_{3-2}$$$ (phase difference between the third and second lines). The phase differences of $$$\phi_{2-1}$$$ and $$$\phi_{3-2}$$$ are related to frequency offsets as follows:
$$\phi_{2-1}=2\pi\cdot\triangle f\cdot\triangle TE_{2-1}$$
$$\phi_{3-2}=2\pi\cdot\triangle f\cdot\triangle TE_{3-2}=2\pi\cdot\triangle f\cdot\left(\triangle TE_{2-1}+\tau\right)$$
where $$$\triangle f$$$ denotes the frequency offset, $$$\triangle TE_{2-1}=t_{2}-t_{1}$$$, and $$$\tau$$$ is the extra gap duration as shown in Fig. 1. Two frequency offset values can be calculated as follows:
$$\triangle f_{fine}=\phi_{2-1}/\left(2\pi\cdot\triangle TE_{2-1}\right)$$
$$\triangle f_{coarse}=\left(\phi_{3-2}-\phi_{2-1}\right)/\left(2\pi\cdot\tau\right)$$
where $$$\triangle f_{fine}$$$ and $$$\triangle f_{coarse}$$$ are intended to tackle relatively minor and major frequency drift values, respectively. For minor frequency drift, when $$$\triangle f_{coarse}-\triangle f_{fine}\leq\triangle f_{fine} $$$, the final frequency drift is chosen as $$$\triangle f=\triangle f_{fine}$$$. For major frequency drift, when $$$\triangle f_{coarse}-\triangle f_{fine}>\triangle f_{fine}$$$, the final frequency drift is set as $$$\triangle f=\triangle f_{coarse}$$$. This is because the precision of the phase difference measured is limited, due to the presence of noise. Given a phase measurement precision, the larger the $$$\triangle TE$$$ or $$$\tau$$$, the smaller the measurable $$$\triangle f$$$, namely, the higher the measurement precision of the frequency drift.
Methods
All experiments were performed on a 3T Philips Achieva MRI scanner. In the phantom study, two test tubes, one full of fresh egg white and the other one with half fresh egg white and half water, were placed inside a flask filled with 2% agarose solution. The in vivo study was approved by the local Institutional Review Board, and written parental consent forms were obtained from all 26 subjects (5.8 ± 3.8 years old). The imaging parameters were as follows: $$$\alpha $$$ = 3°, $$$t_{1}$$$ = 2.54ms, $$$t_{2}$$$ = 5.12ms, $$$t_{3}$$$ = 8.33ms, $$$\tau$$$ = 0.64ms, saturation power = 2μT, TR = 3000ms, TE = 6.7ms, slice thickness = 5mm, FOV = 212×186mm2.Results
In the phantom study, the APTw images and MTRasym spectra from the FS-CEST sequence stayed substantially more stable than those obtained with the NFS-CEST sequence, even though little difference could be seen between the z-spectra scanned with FS-CEST and those with NFS-CEST (Fig. 2). In the in vivo study, the FS-CEST sequence generated consistently stable APTw images throughout all subjects, while the APTw signal intensity from NFS-CEST was either roughly identical to, greater than, or smaller than that from FS-CEST (Fig. 3), which coincides with the results from the phantom study. In addition, a minor difference can be seen in the z-spectra between the FS-CEST and NFS-CEST sequences from frontal matter regions in the in vivo study (Fig. 4). Again, the MTRasym spectra scanned with the NFS-CEST sequence could be mostly equal to, higher than or lower than those of the FS-CEST sequence in vivo, confirming the same trend seen on the APTw images in Fig. 3. Furthermore, the FS-CEST sequence generated tightly bounded APTw signals in all subjects (Fig. 5). However, the NFS-CEST sequence caused pronounced fluctuations among subjects, with the maximum mean APTw intensity reaching 5% and the minimum APTw signal approaching -5%.
Conclusion
The FS-CEST sequence provides an effective method for real-time frequency stabilization and successfully corrects artifacts due to B0 drift on APTw images and MTRasym spectra in CEST imaging. The FS-CEST sequence uses the same amount of scan time with the conventional NFS-CEST sequence and should be adopted by studies in routine clinical settings.Acknowledgements
No acknowledgement found.References
1. Ward K, Aletras A, Balaban RS. A new class of contrast agents for MRI based on proton chemical exchange dependent saturation transfer (CEST). J Magn Reson 2000;143(1):79-87.
2. Zhou J, van Zijl PC. Chemical exchange saturation transfer imaging and spectroscopy. Prog Nucl Magn Reson Spectrosc 2006;48(2-3):109-136.
3. Van Zijl PC, Yadav NN. Chemical exchange saturation transfer (CEST): what is in a name and what isn't? Magn Reson Med 2011;65(4):927-948.
4. Zhou J, Blakeley JO, Hua J, Kim M, Laterra J, Pomper MG, van Zijl PC. Practical data acquisition method for human brain tumor amide proton transfer (APT) imaging. Magn Reson Med 2008;60(4):842-849.
5. Thesen S, Kruger G, Muller E. Absolute correction of B0 fluctuations in echo-planar imaging. Proceedings of the International Society for Magnetic Resonance in Medicine 2003:1025.
6. Foerster BU, Tomasi D, Caparelli EC. Magnetic field shift due to mechanical vibration in functional magnetic resonance imaging. Magn Reson Med 2005;54(5):1261-1267.
Figures