0140
Quantitative MRI Measurements can Distinguish Myositis From Healthy Control Muscle.1Leeds Institute of Rheumatic and Musculoskeletal Medicine, Leeds, United Kingdom, 2NIHR Leeds Biomedical Research Centre, Leeds, United Kingdom
Synopsis
Myositis is an autoimmune inflammatory muscle disease which can decrease quality of life and increase mortality. Clinical presentation includes muscle weakness, changes in muscle microstructure, myosteatosis and myalgia. Current diagnosis is reliant on subjective clinical examinations, blood tests and invasive biopsies. Quantitative MRI techniques such as diffusion and fat fraction measurements are sensitive to changes within the muscle. 10 myositis patients and 16 healthy controls underwent scans of the thigh. Significant differences were found in fat fraction and diffusion measurements between myositis patients and healthy controls, implying these measures have potential as biomarkers in the diagnosis and management of myositis.
Introduction
Myositis is an autoimmune inflammatory muscle disease which can cause a decrease in quality of life and increased mortality. Clinical presentation includes muscle weakness, changes in muscle microstructure, myosteatosis, raised muscle enzymes and myalgia. Currently, diagnosis is reliant on subjective clinical examinations, blood tests and invasive muscle biopsies. Quantitative MRI techniques such as Diffusion imaging and Fat Fraction (FF) offer non-invasive measurements, which could help improve the understanding of muscle pathology and potentially inform diagnosis. Diffusion measurements are sensitive to changes in muscle microstructure (1). FF provides a quantitative measure of myosteatosis in muscles (2). Therefore, these MRI techniques could be useful in the diagnosis and management of myositis. As well as collecting data on muscle architecture and myosteatosis using MRI techniques, to get a complete understanding of muscle health, it is beneficial to conduct quantitative muscle tests to understand the current functional capability of the individual and how this compares with the MRI data. Quantitative muscle tests using isokinetic dynamometers have been shown to produce reliable data that can be integrated into rehabilitation programmes (3). The aim of this study was to investigate whether fat fraction, mean diffusivity and dynamometer measurements in the thigh are sensitive enough to identify differences in 10 active myositis patients compared to 16 healthy controls. The thigh was chosen as it is involved in numerous activities, such as walking and rising out of a chair.Methods
10 active myositis patients (mean age 55 ± 18, 6 female) diagnosed according to the Bohan and Peter myositis criteria (4) (mean creatine kinase 2,015 ± 10,787 U/L) and 16 healthy controls (mean age 44 ± 17, 10 female,), were enrolled in the study. The Myositis patients included 5 with polymyositis, 3 with dermatomyositis and 2 having inclusion body myositis. Mean measurements of fat fraction (FF) and mean diffusivity (MD) were made using the 2-point Dixon technique with a 3D gradient echo (VIBE) readout and a STEAM-EPI sequence respectively (Table 1). Mean values were obtained from the pixels within the regions drawn manually within the individual muscles that make up the quadriceps and hamstrings on the middle slice of the in-phase VIBE Dixon volume (Figure 1). No distinction was made between affected and unaffected muscles. In addition to MRI, all participants had knee extension and flexion power and torque measured on an isokinetic dynamometer and handgrip measurements on an isometric dynamometer. Differences were assessed using independent T-tests.Results
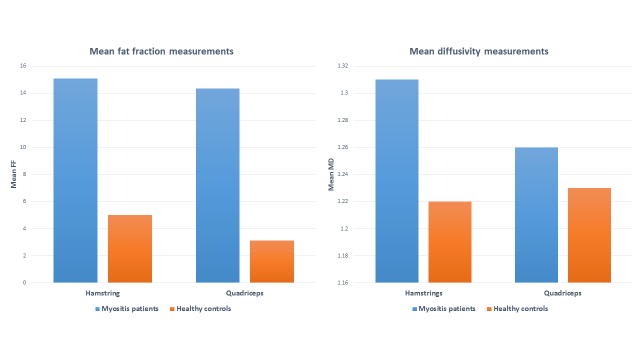
Measured values of both FF and Mean Diffusivity (MD) were found to be significantly higher in myositis patients compared to healthy controls, whereas muscle strength and power were significantly reduced (table 2 and figure 2). These observations were consistent across both the quadriceps and the hamstrings.Discussion and Conclusion
MRI based FF and diffusion measurements can detect differences in muscle between myositis patients and healthy volunteers with significant increases in both fat fraction and mean diffusivity, whilst concurrently muscle strength and power is significantly reduced, suggesting that they may be related. This study agrees with previously published work stating that MD is increased in myositis patients compared to healthy controls. This study is the largest to date investigating myositis patients compared to healthy controls, and compared all muscles, not just the visually inflamed muscles. Furthermore, this study also utilised a STEAM sequence as opposed to a SE sequence. The FF and MD may be raised due to the increased fluid content and a decrease in muscle fibre structure as a result of inflammatory changes occurring in the muscle. This is consistent with the known increase in myosteatosis, oedema and the effects of muscle fibre plasticity seen within myositis patients. This study provides evidence that these measures may have potential as novel imaging biomarkers in the diagnosis and management of myositis.Acknowledgements
No acknowledgement found.References
1. Qi J, Olsen NJ, Price RR, Winston JA, Park JH. Diffusion-weighted imaging of inflammatory myopathies: polymyositis and dermatomyositis. Journal of magnetic resonance imaging : JMRI. 2008;27(1):212-7.
2. Willis TA, Hollingsworth KG, Coombs A, Sveen M-L, Andersen S, Stojkovic T, et al. Quantitative muscle MRI as an assessment tool for monitoring disease progression in LGMD2I: a multicentre longitudinal study. PloS one. 2013;8(8):e70993-e.
3. Almekinders LC, Oman J. Isokinetic Muscle Testing: Is It Clinically Useful? The Journal of the American Academy of Orthopaedic Surgeons. 1994;2(4):221-5.
4. Bohan A, Peter JB. Polymyositis and dermatomyositis (first of two parts). The New England journal of medicine. 1975;292(7):344-7.
Figures


Figure 1: a) Sagittal (localiser) image of the thigh used in the planning of the Fat Fraction (FF) Vibe-Dixon imaging volume (shown by the box). b) Regions of interest were drawn corresponding to the individual muscles of the thigh. c) STEAM- EPI Diffusion weighted image.
VL- Vastus lateralis. RF- Rectus femoris. VI- Vastus intermedius. VM- Vastus medialis. BF- Biceps femoris. ST- Semitendinosus. SM- Semimembranosus. Add- Adductors. G- Gracilis.