0137
A Quantitative, Multiparametric Method for Bone Edema and Adiposity Characterisation in Inflamed Trabecular Bone1Centre for Medical Imaging, University College London, London, United Kingdom, 2Arthritis Research UK Centre for Adolescent Rheumatology, University College London, London, United Kingdom, 3Magnetic Resonance Imaging Physics, University College London Hospitals, London, United Kingdom
Synopsis
MRI is increasingly used to identify and monitor inflammation in patients with inflammatory diseases involving the skeleton, such as spondyloarthritis. However, conventional image interpretation by radiologists provides only indirect information about the inflammatory process and lacks reproducibility. Here, we describe a partially-automated multiparametric MRI tool for quantifying and characterising both active and chronic inflammation in spondyloarthritis, relying on histographic analysis of apparent diffusion coefficient (ADC) and proton density fat fraction (PDFF) maps. We show that histographic analysis improves performance compared to simple averaging, and, further, that ADC and PDFF provide distinct, complementary information regarding active inflammation and structural damage respectively.
Introduction
Magnetic resonance is now a first-line imaging modality in spondyloarthritis, and is used to assess the extent, severity and type of inflammation in juxta-articular bone [1]. Active inflammation causes an increase in bone marrow water content (edema), whilst chronic inflammation commonly produces an increase in marrow fat content referred to as fat metaplasia [1,2]. In clinical practice, T2-weighted and T1-weighted spin echo images are used to qualitatively assess edema and fat metaplasia respectively [1]. However, this approach relies on visual comparison of image intensities, which provides only indirect information about tissue pathology, can be confounded by non-target tissue properties and lacks reproducibility. Therefore, there is a need for an objective, reproducible MR method for quantifying and characterising inflammation. Previous studies have investigated the use of diffusion-weighted imaging (DWI) and chemical shift-encoded MRI (CSE-MRI) for this purpose, with promising results [3–5]. However, tools for measuring ADC in subchondral bone [6–8] are limited by sampling error and typically rely on mean apparent diffusion coefficient (ADC) measurements, which may perform poorly in patients with mixed active and chronic inflammation, (since patients with both edema and fat metaplasia could have a normal mean ADC measurement, due to the much lower ADC of fat than water). Furthermore, there is no validated tool for quantifying proton density fat fraction (PDFF) in the sacroiliac joints.
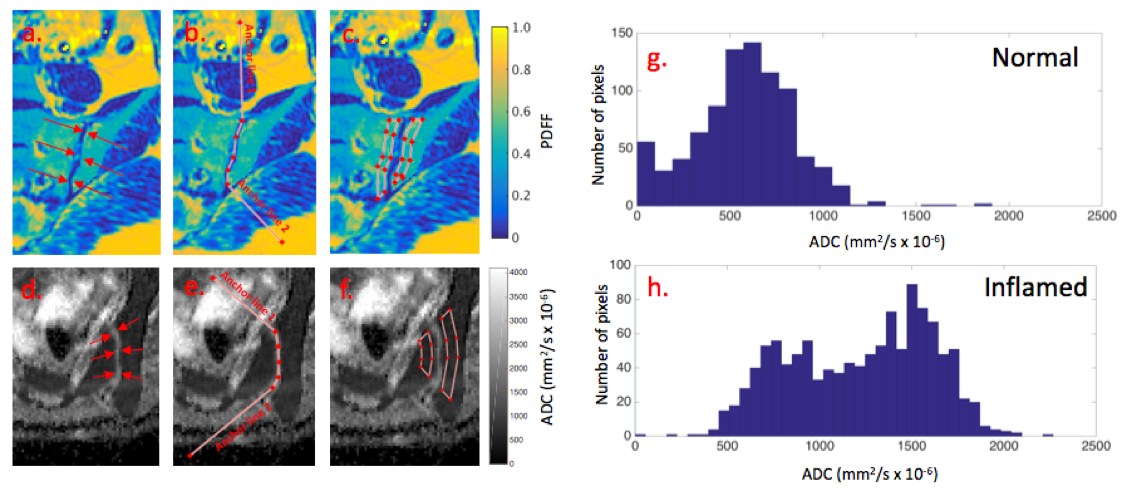
Here, we present a new analysis tool which, firstly, enables a more specific assessment of subchondral bone and, secondly, derives a series of histographic parameters from both ADC and PDFF maps, aiming to isolate the active and chronic components of the inflammatory process. The proposed method is partially automated in the sense that polygonal regions-of- interest (ROIs) are automatically propagated onto subchondral bone after the user defines the joint, thereby minimising the subjectivity associated with ROI placement. We aimed to validate this tool, named BEACH (Bone Edema and Adiposity Characterisation with quantitative MRI), in a prospective study.
Methods
Fifty-three patients aged 12-24 years with either spondyloarthritis or mechanical back pain were prospectively recruited and underwent quantitative MRI, consisting of CSE-MRI on a 3T Philips Ingenia system and DWI on a 1.5T Siemens Avanto system, and conventional clinical MRI scans, as described previously [1,3–5]. ADC and PDFF measurements were derived from subchondral bone using the BEACH tool (Figure 1). The following histographic parameters were derived from the subchondral ROIs for both ADC and PDFF measurements: median, 10th, 25th, 75th and 90th percentiles (denoted ADC10, ADC25.. PDFF10, PDFF25.. etc), and phigh and plow (the proportion of ‘high’ and ‘low’ value pixels respectively, as defined using predetermined thresholds based on ADC and PDFF measurements in inflamed and normal marrow). Conventional MRI scans were assessed using visual scoring [4]. Patients were deemed to have active inflammation if their inflammation score was ≥2, and to have fat metaplasia if the fat score was ≥3. Parameters were compared between inflamed and non-inflamed SIJs using t-tests and receiver operating characteristic (ROC) analyses.Results and Discussion
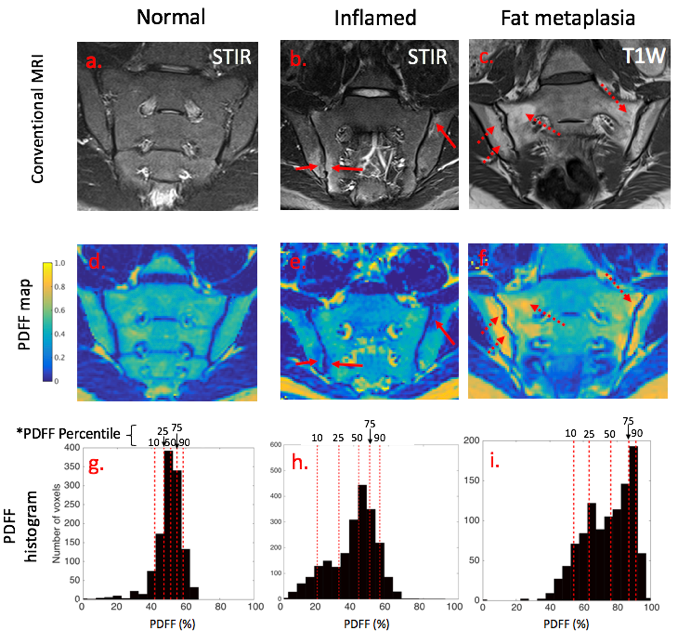
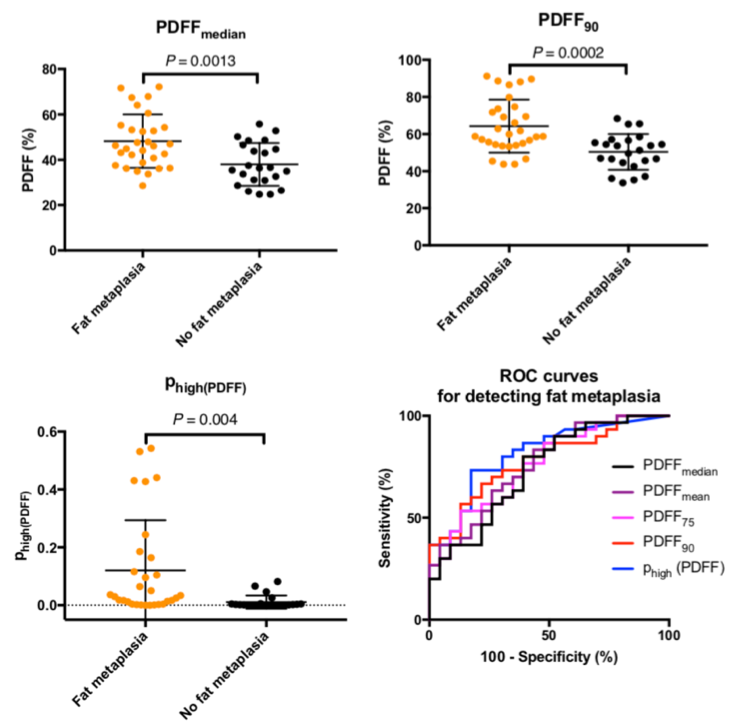
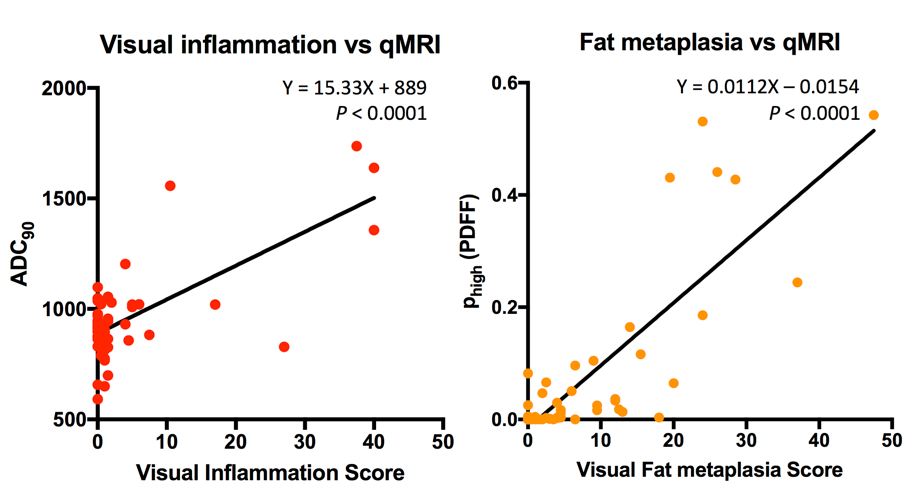
Use of the BEACH tool is demonstrated in Fig 1(a)-(f); an example of the upward shift in ADC measurements with inflammation is shown in (g),(h). Figure 2 demonstrates the reductions in PDFF measurements occurring in inflamed marrow (b,e,h) and increases in PDFF in fat metaplasia (c,f,i) compared to normal marrow (a,d,g). Figure 3 compares ADC-based parameters between inflamed and uninflamed groups. ADC75, ADC90 and phigh(ADC) were significantly increased in inflamed SIJs (P=0.041, 0.006 and 0.003 respectively), although median ADC values did not differ significantly between inflamed and uninflamed joints (P=0.31). Diagnostic performance was superior for histographic parameters (ROC AUC=0.59, 0.67 and 0.69) than for the median (AUC=0.54). Figure 4 compares PDFF-based parameters between patients with and without fat metaplasia. Median PDFF, PDFF75, PDFF90 and phigh(PDFF) were all significantly increased in SIJs with fat metaplasia (P<0.0001). Diagnostic performance was superior for histographic parameters PDFF75, PDFF90 and phigh(PDFF) (AUC=0.89, 0.92 and 0.92) than for the median (AUC=0.87). Figure 5 shows the relationship between visual scores of inflammation and fat metaplasia and the best-performing ADC-based and PDFF-based parameters respectively, in both cases showing significant, positive relationships (P<0.0001).Conclusions
ADC and PDFF measurements can differentiate between inflamed and non-inflamed SIJs, and between joints with and without fat metaplasia (a form of chronic inflammation/damage). Compared to simple averages, histogram-based parameters demonstrate superior diagnostic performance for detecting inflammation and fat metaplasia. Further, ADC-based parameters and PDFF-based parameters provide distinct information about active inflammation and structural damage respectively. There is minimal subjectivity associated with ROI placement using the BEACH tool, which could improvement the reproducibility and clinical utility of MRI in spondyloarthritis.Acknowledgements
TJPB was supported by Arthritis Research UK Grant 21369. This work was undertaken at UCLH/UCL, which receives funding from the UK Department of Health’s the National Institute for Health Research (NIHR) Biomedical Research Centre (BRC) funding scheme. The views expressed in this publication are those of the authors and not necessarily those of the UK Department of Health.References
1. Sieper J, Rudwaleit M, Baraliakos X, Brandt J, Braun J, Burgos-Vargas R, et al. The Assessment of SpondyloArthritis international Society (ASAS) handbook: a guide to assess spondyloarthritis. Ann Rheum Dis. 2009;68 Suppl 2(May):ii1–44.
2. Maksymowych WP, Wichuk S, Chiowchanwisawakit P, Lambert RG, Pedersen SJ. Fat metaplasia and backfill are key intermediaries in the development of sacroiliac joint ankylosis in patients with ankylosing spondylitis. Arthritis Rheumatol [Internet]. 2014;66(11):2958–67.
3. Vendhan, K, Bray, TJP, Atkinson, D, Punwani, S, Fisher, C, Ioannou, Y, Sen, D, Hall-Craggs M. A Diffusion-based Quantification Technique for Assessment of Sacroiliitis in Adolescents with Enthesitis-related Arthritis. Br J Radiol. 2015;18:20150775.
4. Bray TJP, Vendhan K, Ambrose N, Atkinson D, Punwani S, Fisher C, et al. Diffusion-weighted imaging is a sensitive biomarker of response to biologic therapy in enthesitis-related arthritis. Rheumatol (United Kingdom) [Internet]. 2017 Dec 19;56(3):399–407.
5. Bray TJP, Bainbridge A, Punwani S, Ioannou Y, Hall-Craggs MA. Simultaneous Quantification of Bone Edema/Adiposity and Structure in Inflamed Bone Using Chemical Shift-Encoded MRI in Spondyloarthritis. Magn Reson Med. 2018;79(2):1031–42.
6. Bozgeyik Z, Ozgocmen S, Kocakoc E. Role of diffusion-weighted MRI in the detection of early active sacroiliitis. Am J Roentgenol. 2008 Oct;191(4):980–6.
7. Gaspersic N, Sersa I, Jevtic V, Tomsic M, Praprotnik S. Monitoring ankylosing spondylitis therapy by dynamic contrast-enhanced and diffusion-weighted magnetic resonance imaging. Skeletal Radiol. 2008 Feb;37(2):123–31.
8. Vendhan K, Bray TJP, Atkinson D, Punwani S, Fisher C, Sen D, et al. A diffusion-based quantification technique for assessment of sacroiliitis in adolescents with enthesitis-related arthritis. Br J Radiol. 2016 Mar 19 [cited 2017 Jan 11];89(1059):20150775.
Figures