0136
Cortical bone quantifications using ultrashort echo time MR imaging (UTE-MRI) correlate well with histomorphometric assessment of bone microstructure1Radiology, University of california, San Diego, San Diego, CA, United States, 2Radiology Service, VA San Diego Healthcare System, San Diego, CA, United States
Synopsis
Ultrashort echo time magnetic resonance imaging (UTE-MRI) has been used to assess cortical bone porosity, as validated routinely with high resolution micro computed tomography (μCT). This study investigated the correlations between UTE-MRI-based quantifications and histomorphometric measures, as well as between UTE-MRI-based quantifications and μCT results. MRI properties showed strong correlations with both histomorphometric and μCT-based porosities. Only UTE-MRI could assess small pore (<40 μm) variations with moderate correlations. Major porosity changes were from large pores in studied specimens; therefore, μCT employment is likely adequate to validate UTE-MRI biomarkers. However, UTE-MRI techniques can assess pores below the detectable range by μCT, porosities which might contribute differently to bone mechanics.
Introduction
Quantitative ultrashort echo time MRI (UTE-MRI) has been used increasingly to assess bone porosity indirectly (1–3). Bi-component T2* signal decay analysis (1) and magnetization transfer UTE (UTE-MT) modeling (4) were two recently successful examples. High resolution micro computed tomography (μCT) has been routinely used for validating MRI-based bone quantifications. Bone porosity includes a wide range of pores, sizing from 0.1 to 200µm (5,6). µCT is practically capable of accurately characterizing pores larger than 4 voxels in size. Thus, the sufficiency of employing high resolution µCT for intracortical bone porosity validation is questionable. The correlation between UTE-MRI quantifications of cortical bone and small pores in bone is to be investigated. The main objective of this study was to determine the correlations between two-pool MT modeling and bi-component T2* fitting results against bone porosities as measured with histomorphometric and µCT approaches.
Methods
Sample preparation: Eleven 25-mm cortical bone specimens were harvested using a commercial band saw from fresh-frozen human tibial midshafts (51±16 years old, 5 females). The anterior portions of the tibias were excised using a low-speed diamond saw (Isomet 1000, Buehler, IL) in order to fit the specimens in a 1-inch diameter coil.
UTE-MRI sequences: Each specimen was placed in a 30-mL syringe filled with perfluoropolyether (Fomblin, Ausimont, Thorofare, NJ) to minimize dehydration and susceptibility artifacts. The UTE-MRI scans were performed on a 3T clinical scanner (Signa HDx, GE Healthcare Technologies, WI) using a home-made 1-inch diameter solenoid transmit/receive coil. The quantitative UTE-MRI protocol involved A) six sets of dual-echo 3D-UTE-Cones sequences (TR=24.3, TEs=0.032-15ms) for T2*measurements, B) a variable TR 3D-UTE-Cones sequence (TE=0.032, TRs=5.9-100ms, flip angle (FA)=20˚) for T1 measurement, which is a prerequisite for MT modeling, and C) a set of 3D-UTE-Cones-MT sequences (MT saturation pulse power=500°, 750°, and 1000°, frequency offset=2, 5, 10, 20, and 50kHz, FA=10˚) for two-pool MT modelling (7). Field of view (FOV), matrix dimension, slice thickness, and receiver bandwidth were 40mm, 160×160, 3mm, and 62.5kHz, respectively.
Micro-computed tomography (µCT): Specimens were scanned using a Skyscan 1076 (Kontich, Belgium) µCT scanner at 9µm isotropic voxel size.
Histology and Histomorphometry: A 2-mm thick slice was cut from the middle of each specimen and fixed in zinc-formalin fixative for five days. Slices were decalcified via several changes of 10% formic acid over two weeks, then soaked in 30% sucrose in PBS to be frozen for immediate cryosectioning at 6µm thickness. Thin slices were then stained by hematoxylin and eosin (H&E). One representative histology section was selected per specimen and imaged using a virtual microscopy scanner (Axio Scan.Z1, Carl Zeiss, Jena, Germany).
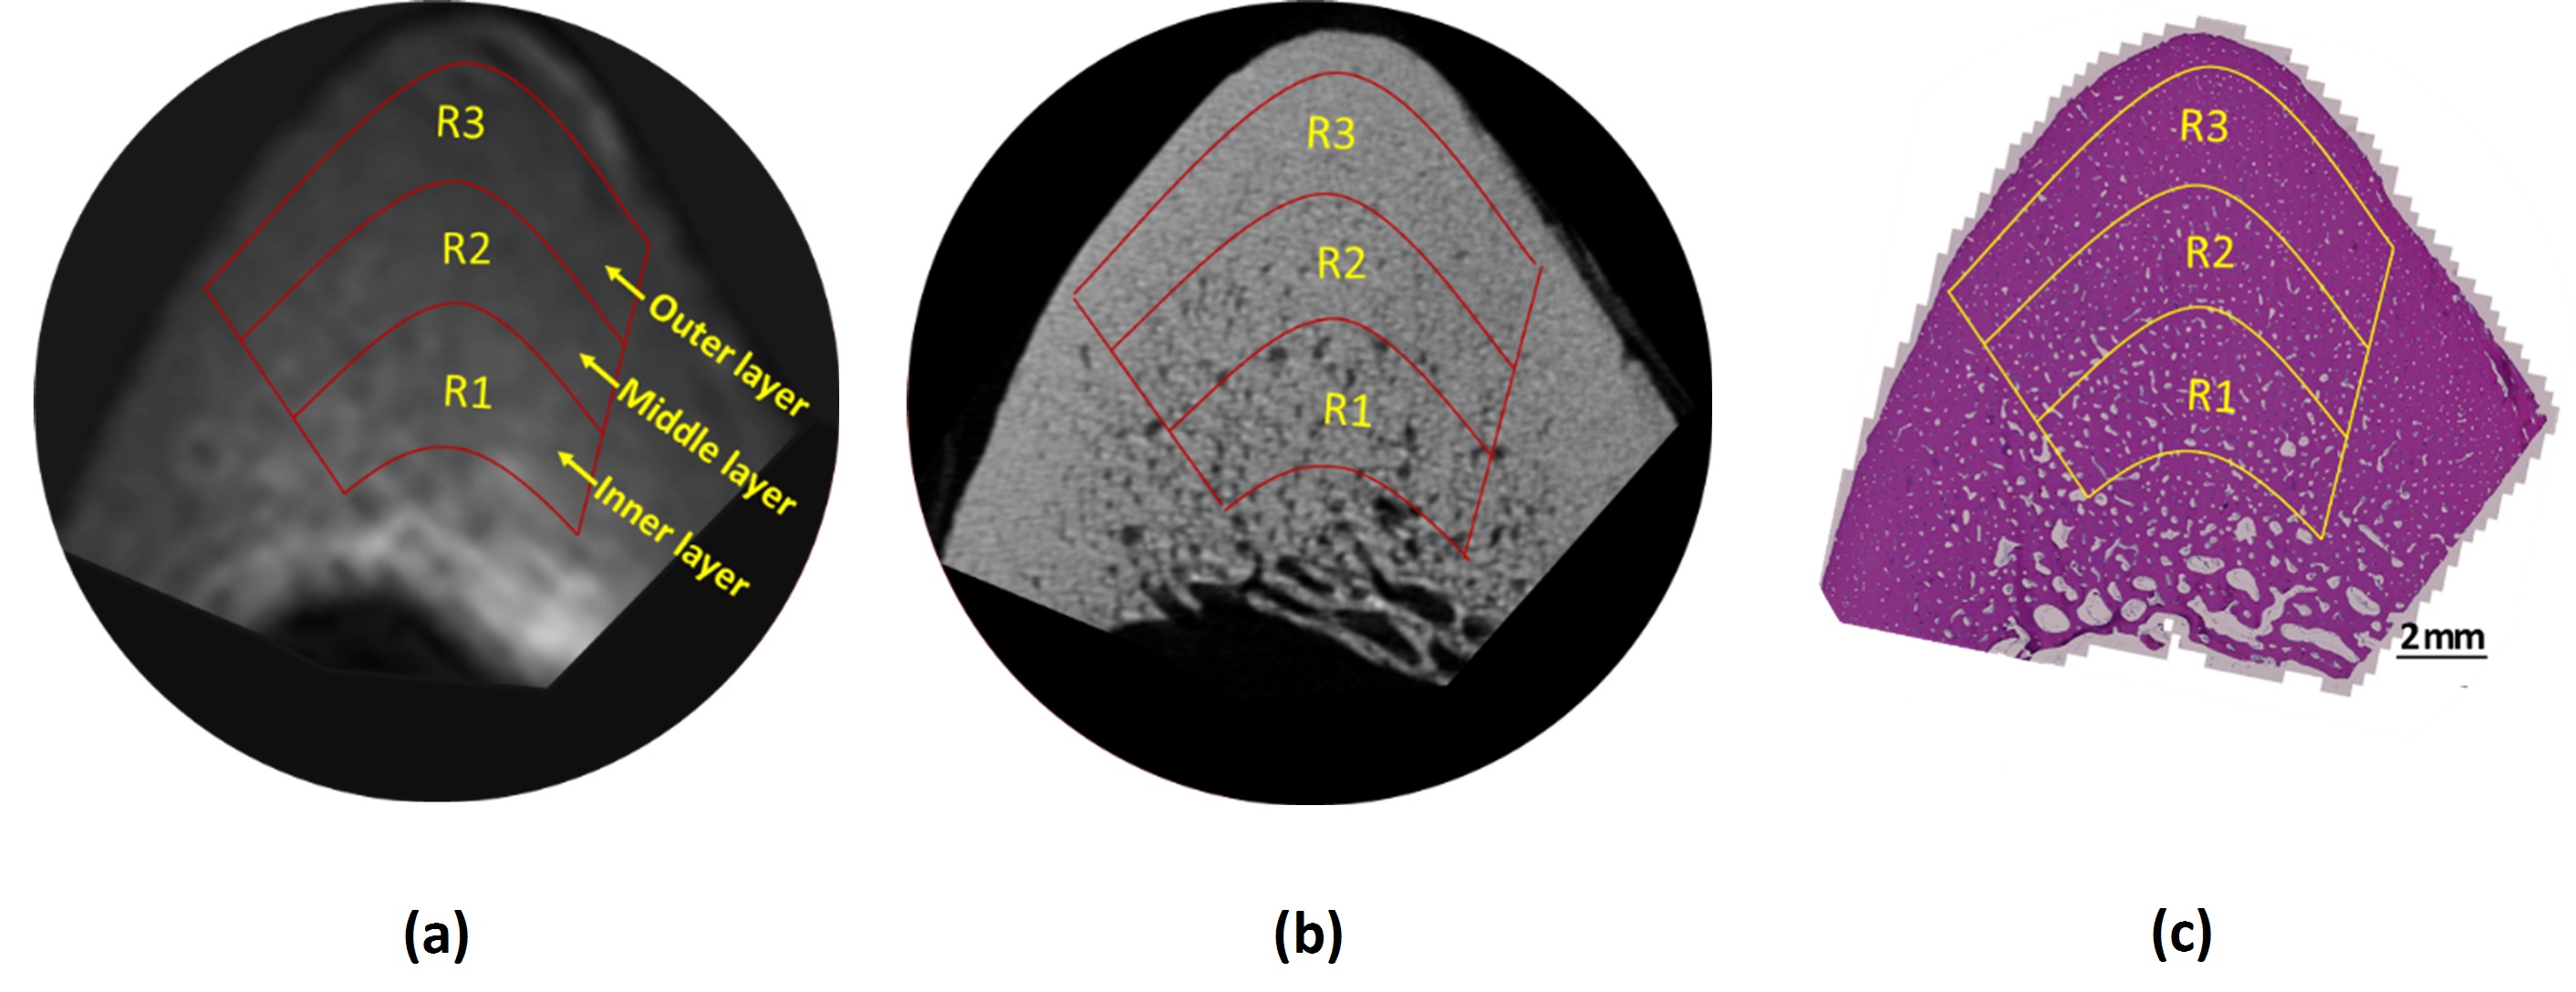
Data analysis: UTE-MRI, µCT, and histomorphometric measures were compared within three regions of interest (ROIs) per specimen, defined at different bone layers (Figure 1). Macromolecular fraction (MMF) from two-pool MT modeling (7) and short and long component T2* and their fractions were the studied UTE-MRI measures (1). µCT-based bone porosity (BPO) was measured after image segmentation based on a gray level thresholding. Bone mineral density (BMD) was measured by comparing the gray levels with reference hydroxyapatite phantoms. After distinguishing pores in histology images, pore size at each pixel was defined as the diameter of the largest covering circle. Pearson’s correlations were calculated between UTE-MRI, µCT, histomorphometric measures.
Results
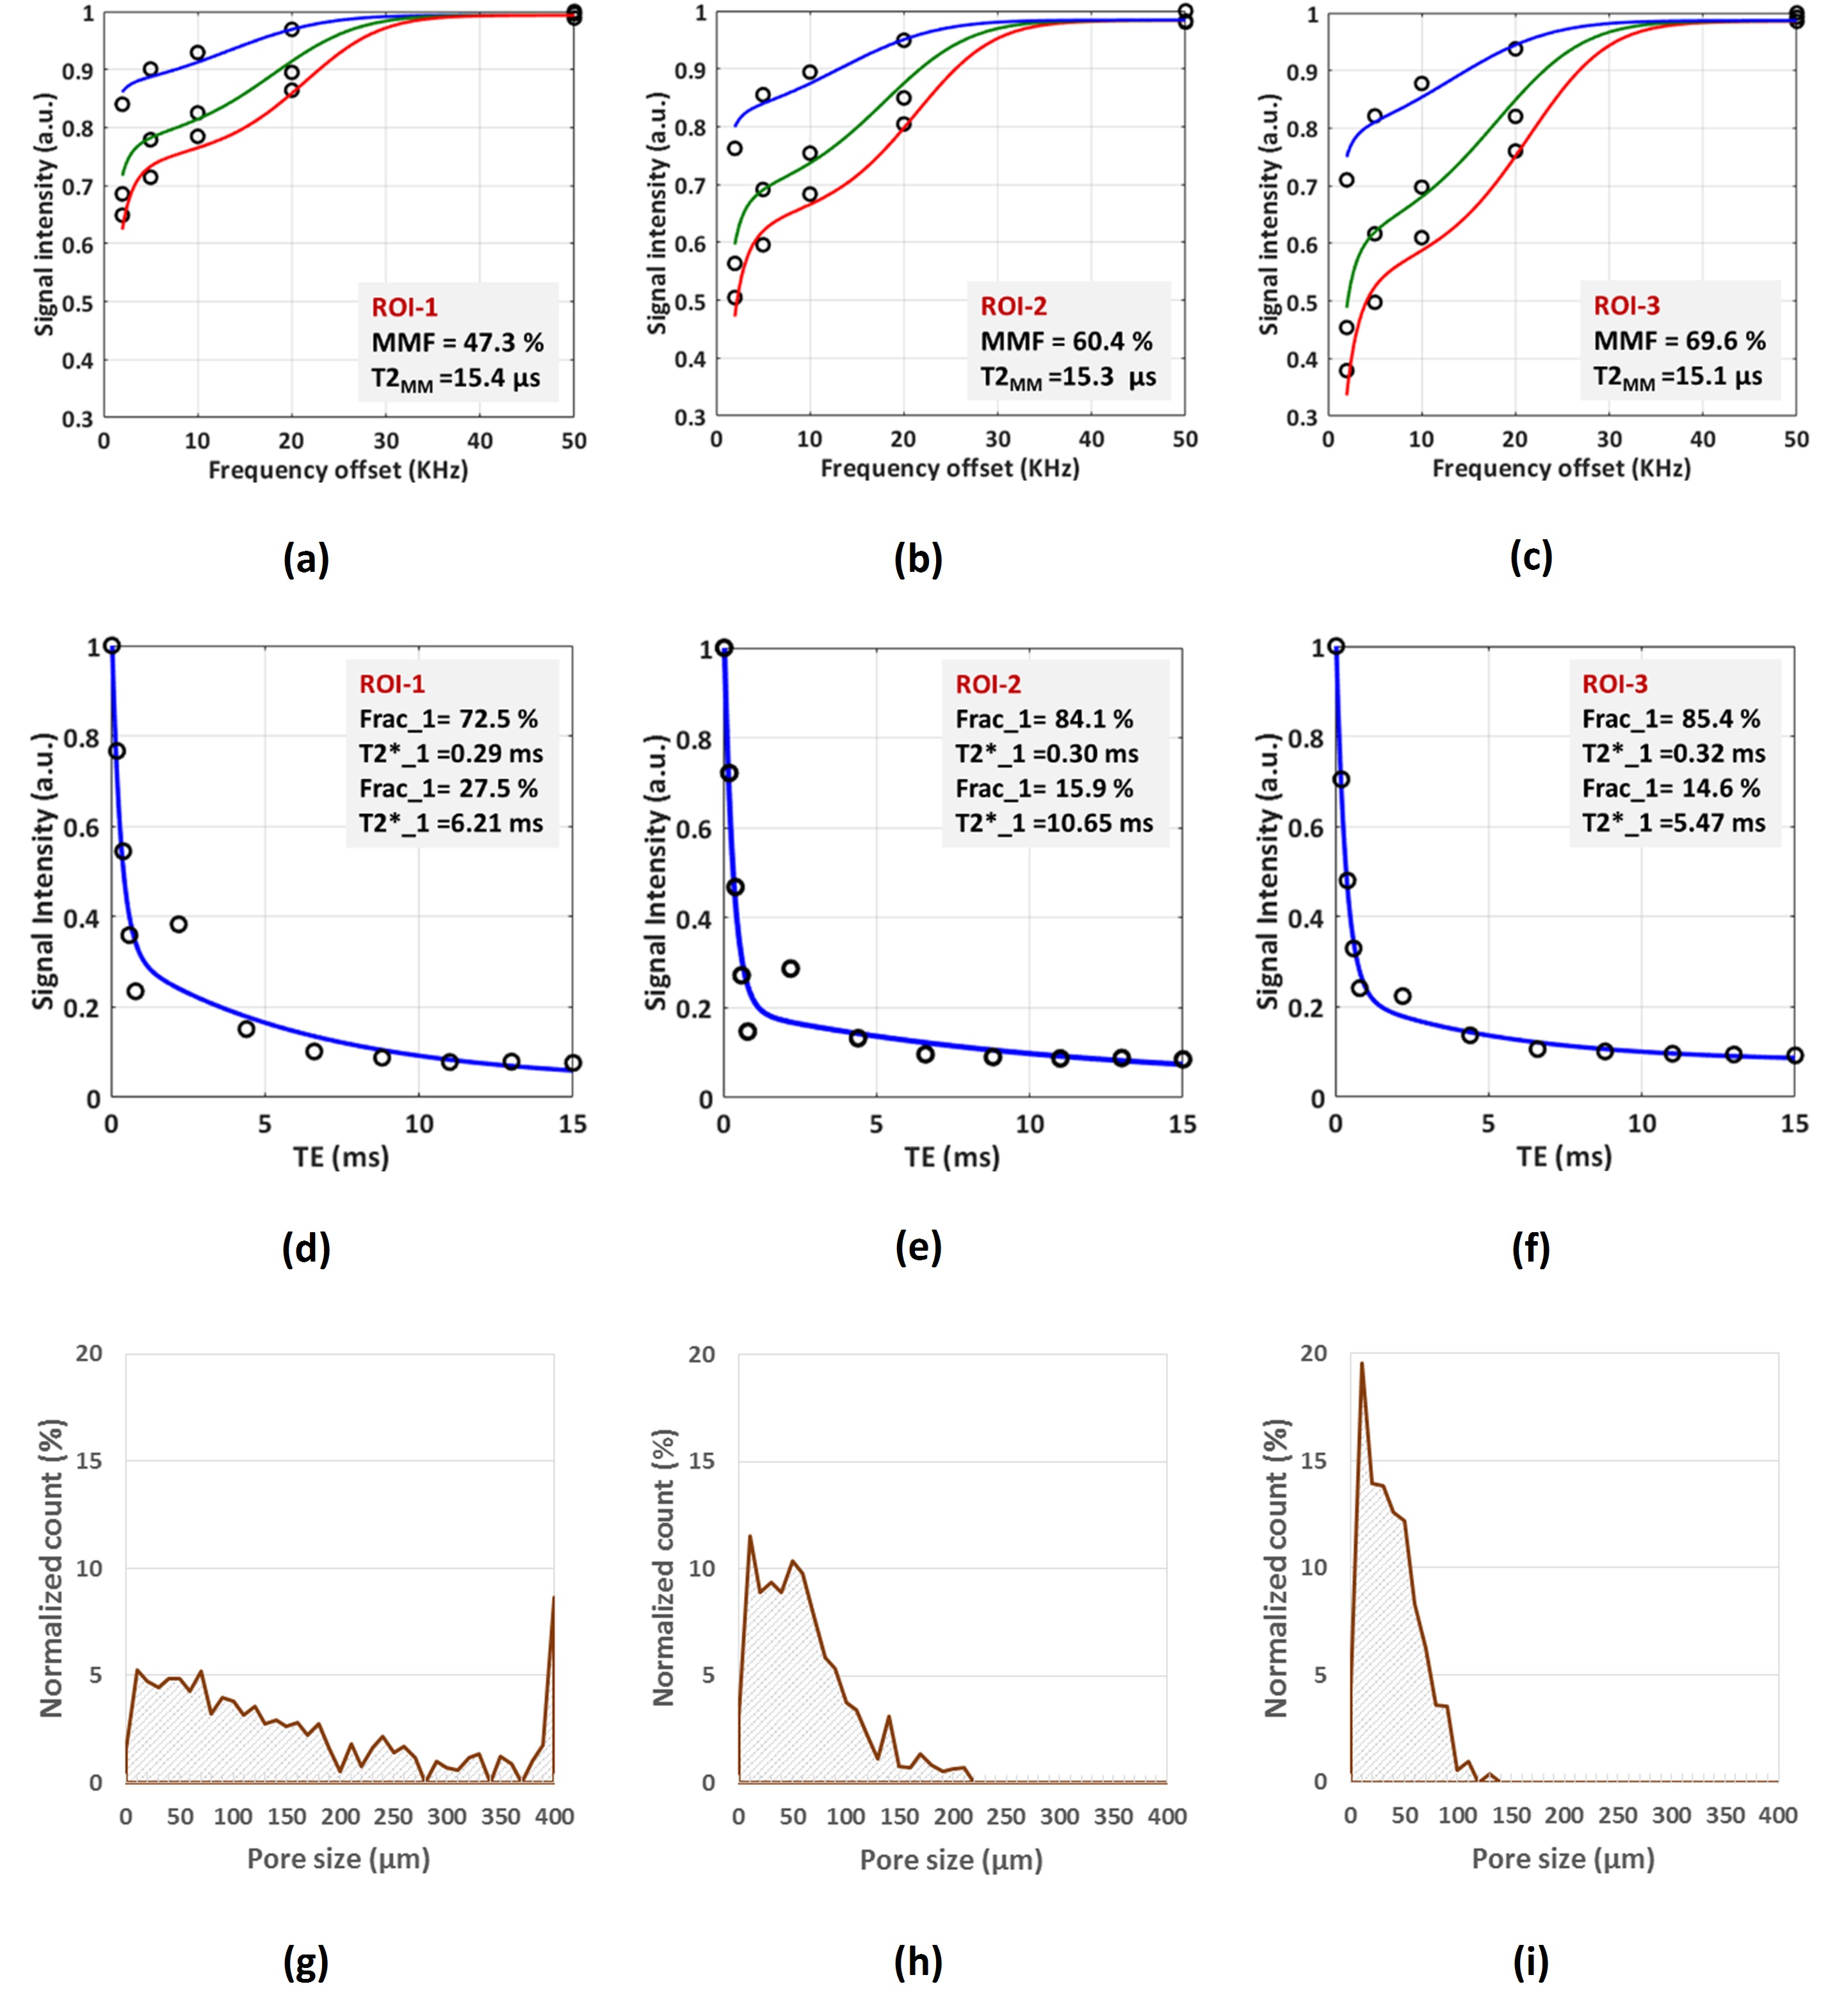
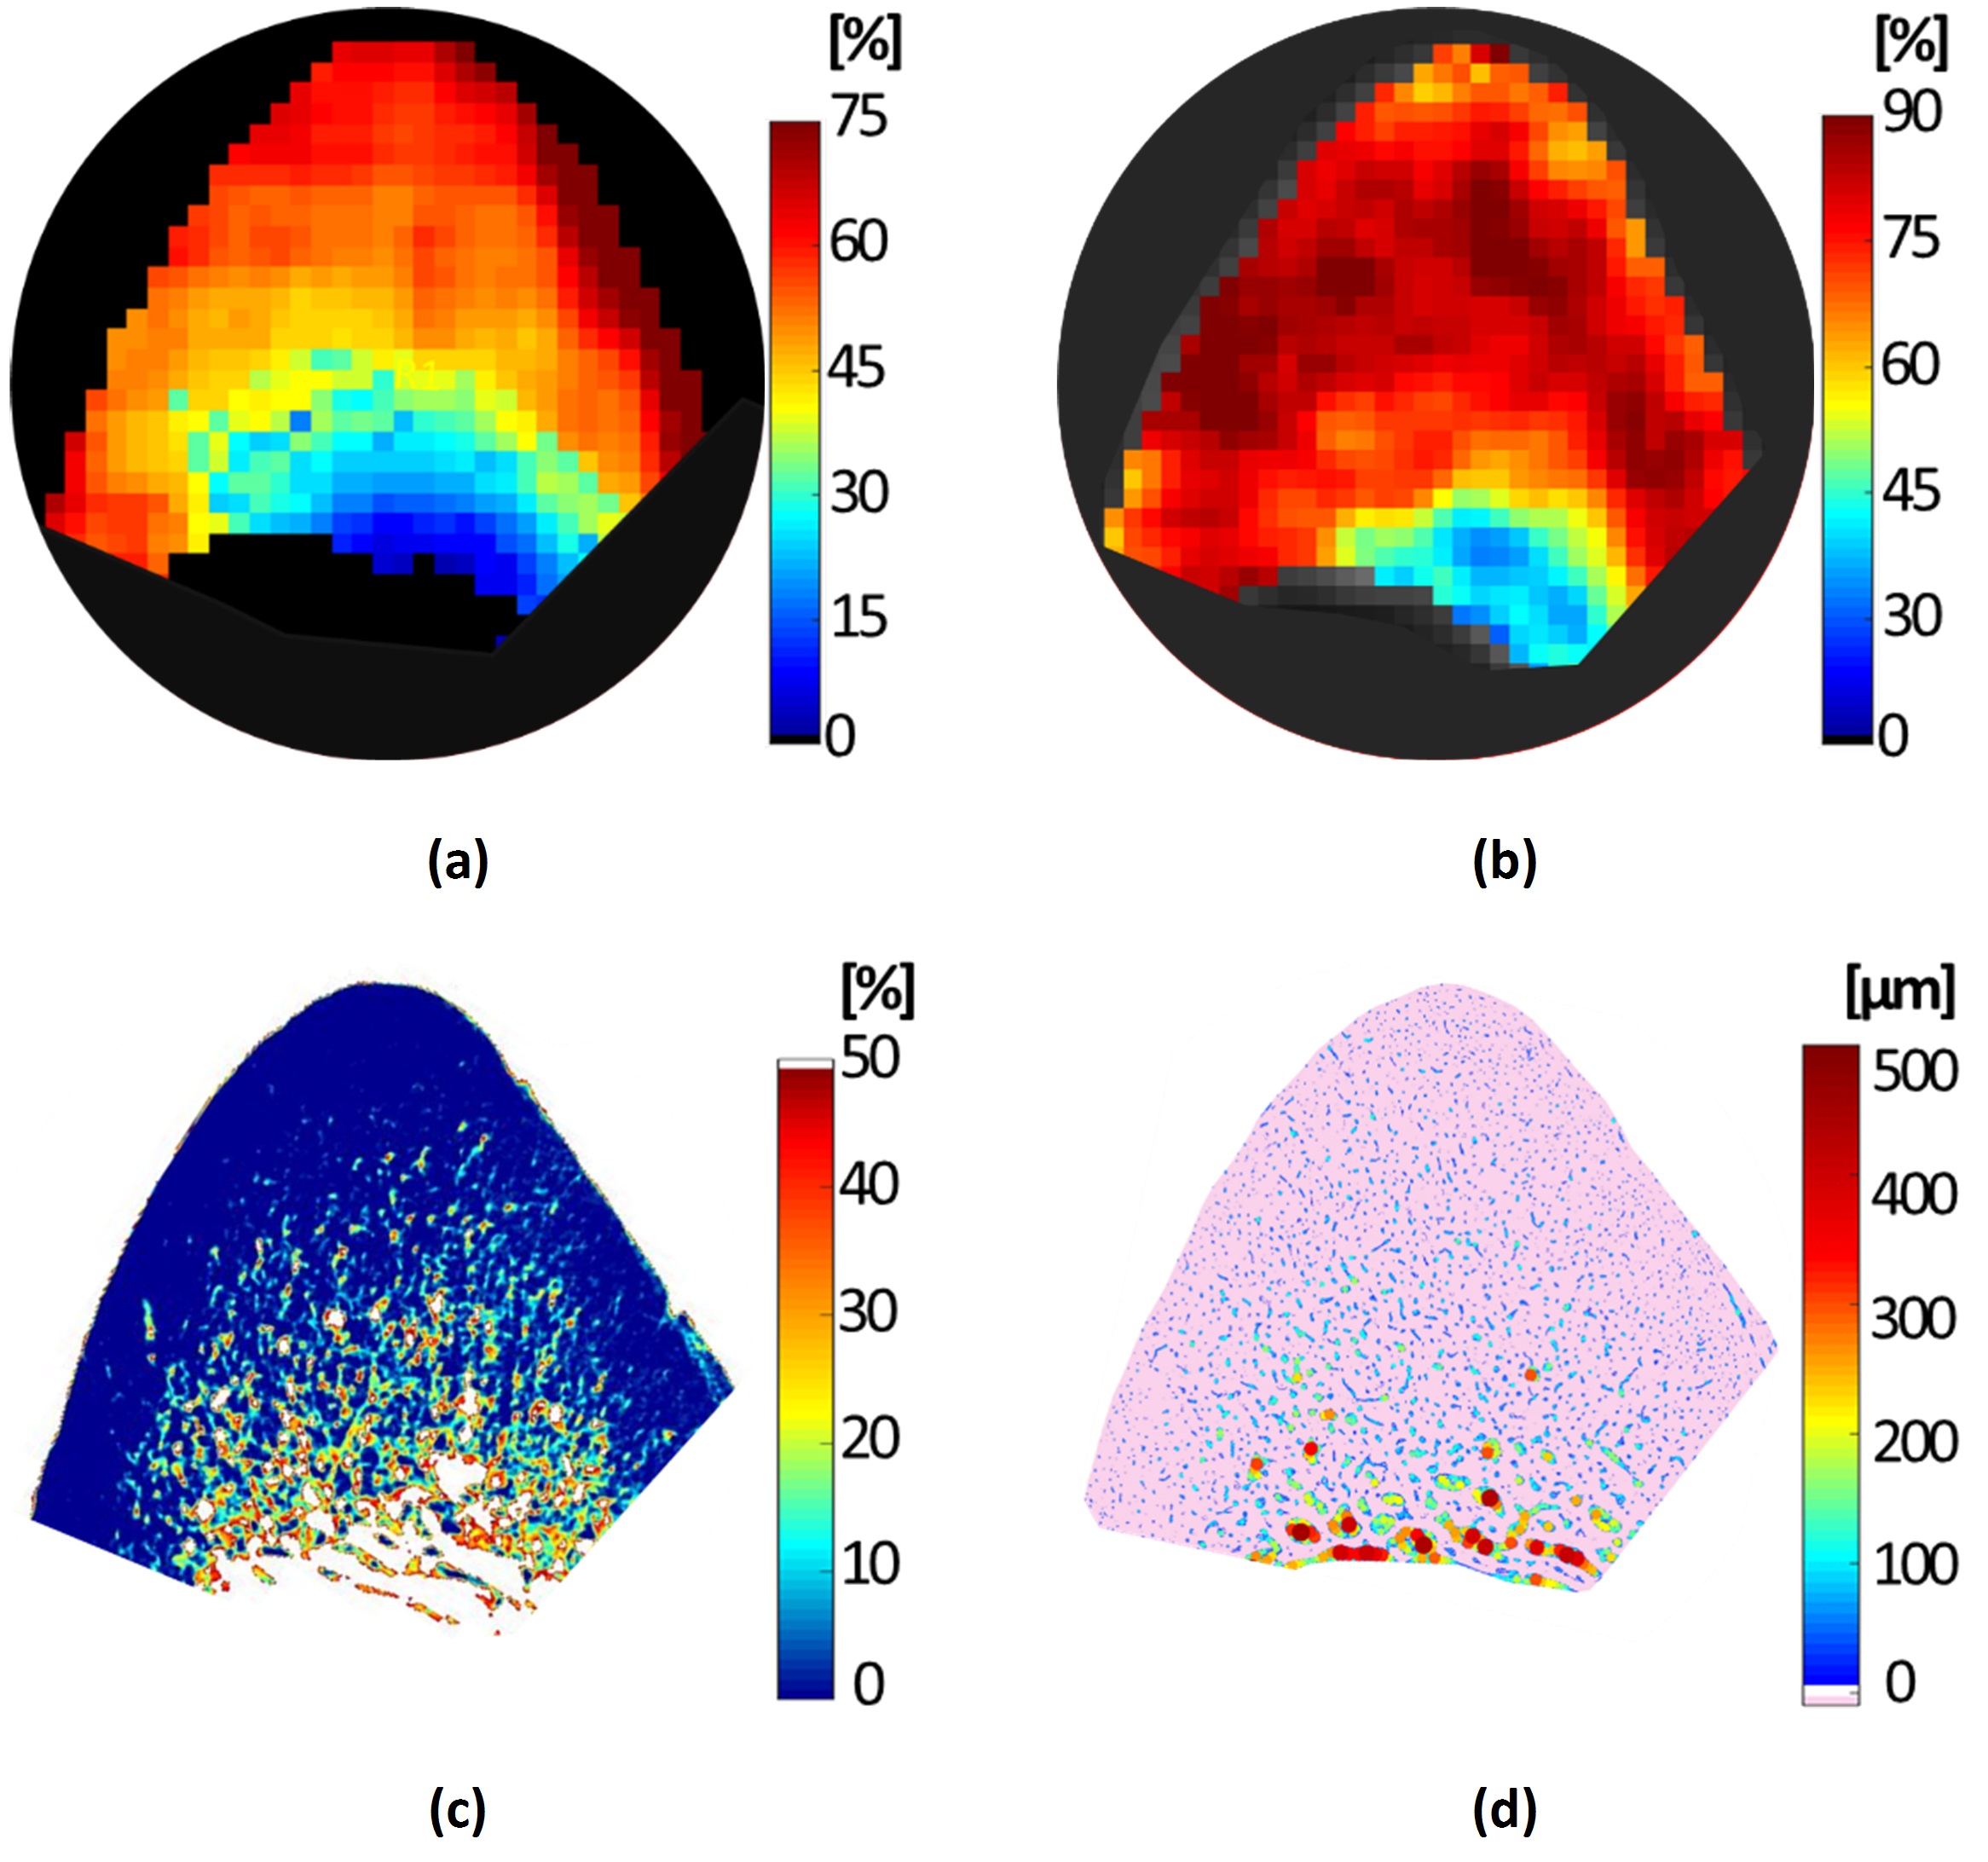
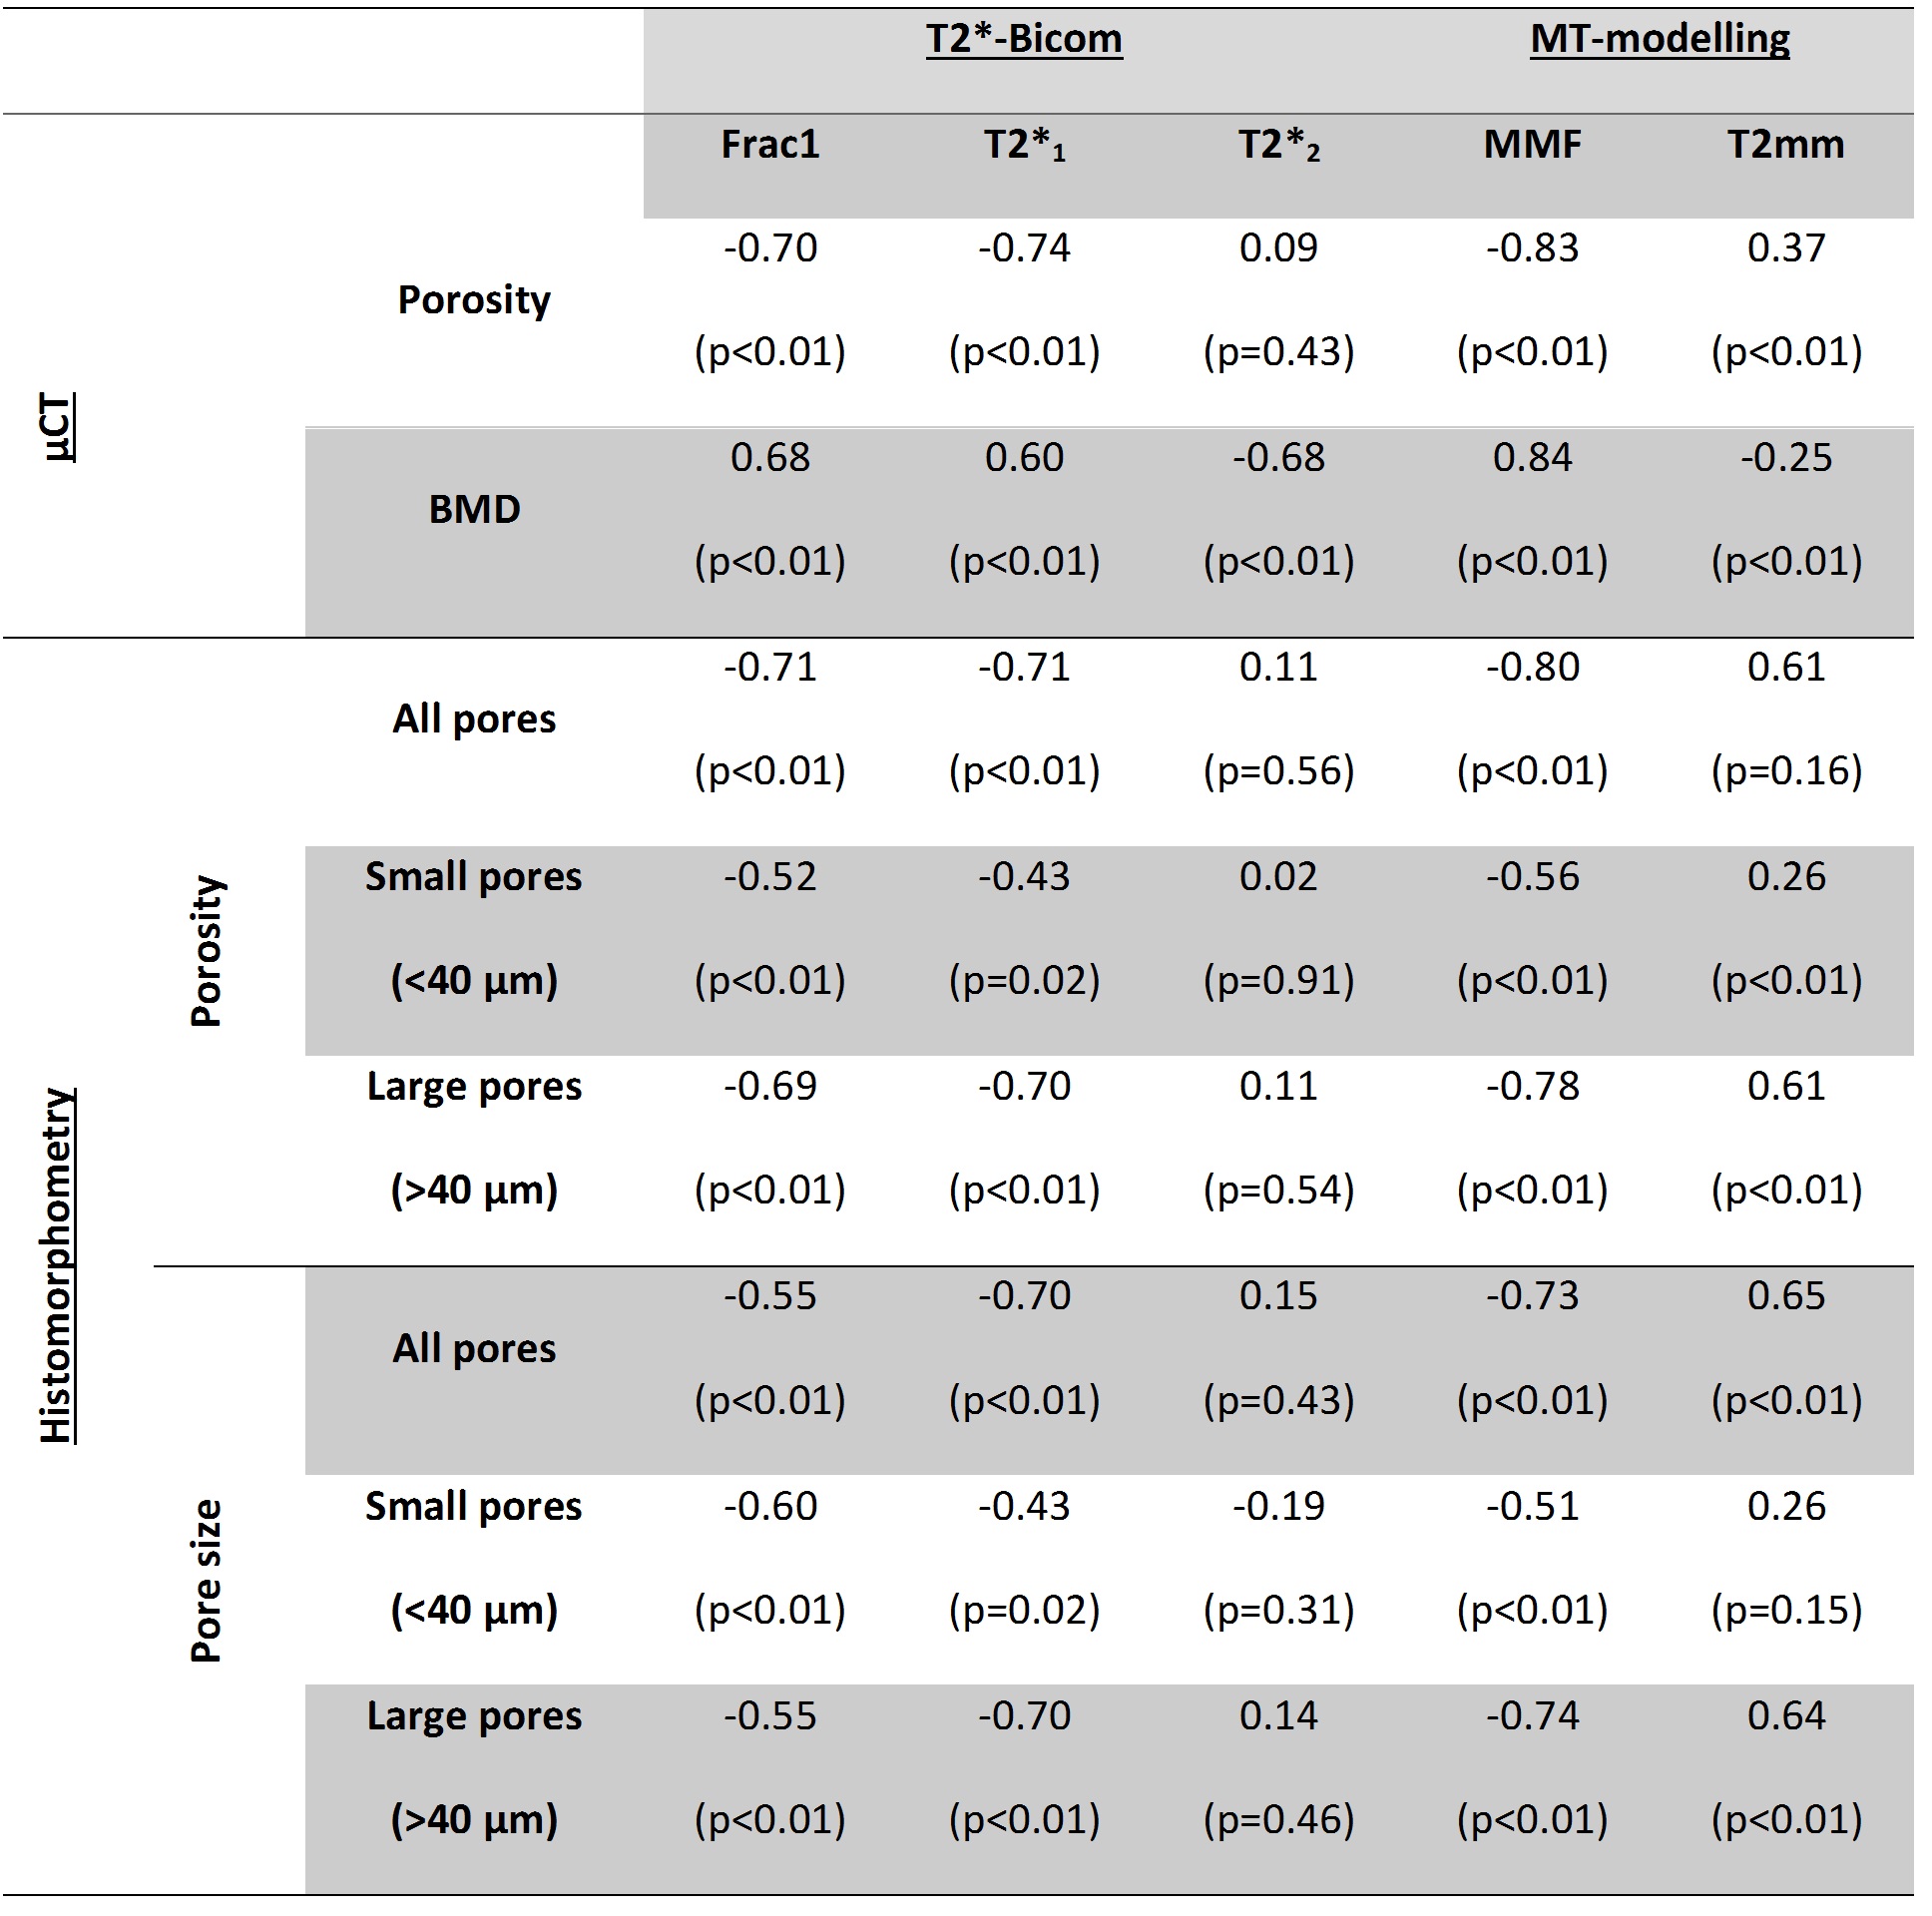
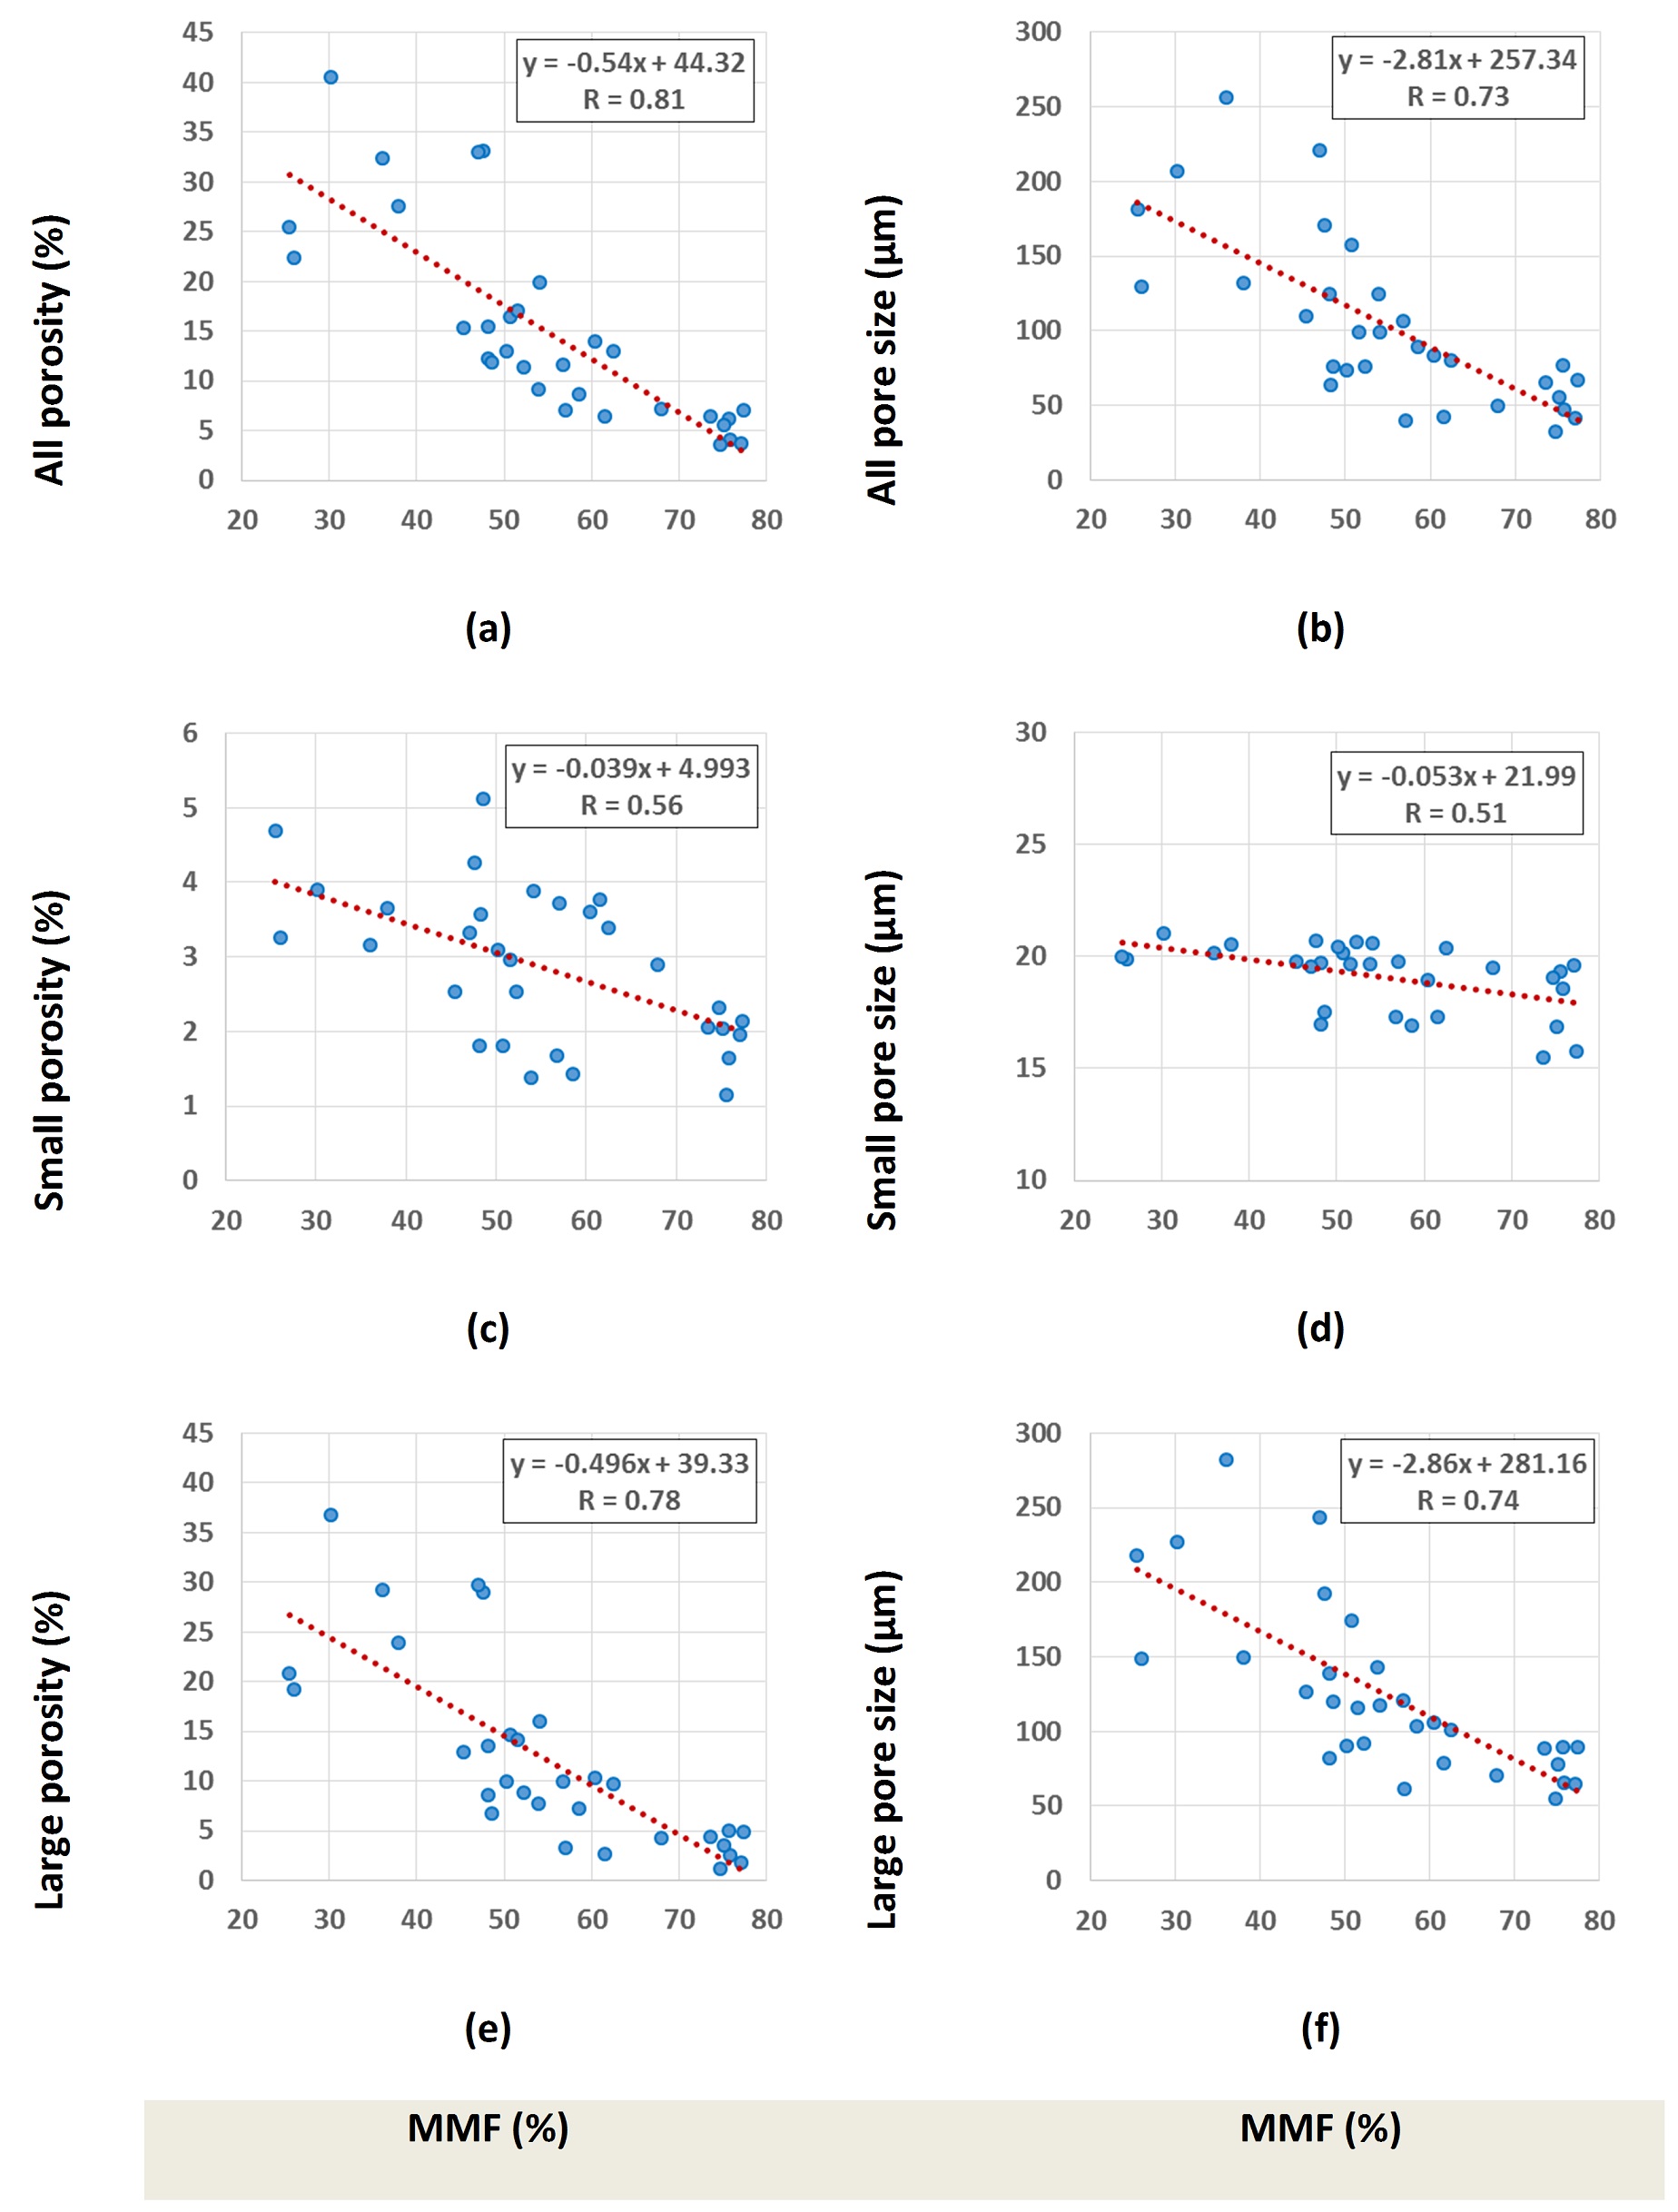
Figure.1 shows the UTE-MRI, µCT, and histology images of a representative bone specimen (71-year-old man). Figures.2a-c show the two-pool MT modeling analyses within the selected ROIs. Bi-component T2* fitting and histomorphometric pore size distributions for the same ROIs are illustrated in Figures.2d-f and Figures.2g-I, respectively. Figures.3a-d show the generated pixel maps in a representative specimen for MMF, short component T2* (Frac1), µCT-based porosity, and histomorphometric pore size, respectively. MMF, T2*1, and Frac1 showed strong correlations with μCT-based porosity and histomorphometric total porosities and large (>40μm) porosities (Figure.4, Table). UTE-MRI was also able to assess small pore variations with moderate correlation. Linear regressions of histomorphometric bone porosity and pore size on MMF are shown in Figure.5.Discussion
Despite µCT scans at 9µm voxel size, the microscopic images of histology slides (0.2µm pixel size) provided access to all Haversian canals and almost all lacunae pores. Major porosity changes were from large pores in studied specimens (1-35%). Therefore, utilizing μCT was likely adequate to validate UTE-MRI biomarkers, which resulted in strong correlations comparable to MRI/histomorphometric porosity correlations. Our results demonstrated UTE-MRI’s capability of assessing small pore variations with moderate correlations, probably due to limited changes in small porosities (1-5%).Conclusion
This study highlighted the capability of UTE-MRI for assessing bone pores below the range detectable by μCT. However, employing μCT was found to be adequate for UTE-MRI validation in the places where large pore variation probably counts for the major changes in cortical bone microstructure.Acknowledgements
The authors acknowledge grant support from NIH (1R21AR073496, R01AR068987) and VA Clinical Science and Rehabilitation R&D Awards (I01CX001388 and I01RX002604).References
1. Bae WC, Chen PC, Chung CB, Masuda K, D’Lima D, Du J. Quantitative ultrashort echo time (UTE) MRI of human cortical bone: Correlation with porosity and biomechanical properties. J. Bone Miner. Res. 2012;27:848–857. doi: 10.1002/jbmr.1535.
2. Rajapakse CS, Bashoor-Zadeh M, Li C, Sun W, Wright AC, Wehrli FW. Volumetric Cortical Bone Porosity Assessment with MR Imaging: Validation and Clinical Feasibility. Radiology [Internet] 2015;276:526–35. doi: 10.1148/radiol.15141850.
3. Manhard MK, Uppuganti S, Granke M, Gochberg DF, Nyman JS, Does MD. MRI-derived bound and pore water concentrations as predictors of fracture resistance. Bone [Internet] 2016;87:1–10. doi: 10.1016/j.bone.2016.03.007.
4. Jerban S, Ma Y, Wan L, Searleman AC, Jang H, Sah RL, Eric Y. Chang, Du J. Cortical bone porosity measured with micro computed tomography (μCT) correlates significantly with collagen protons fraction from ultrashort echo time magnetization transfer (UTE-MT) MRI modeling. NMR Biomed. 2018;In Press.
5. Cowin SC. Bone poroelasticity. J. Biomech. 1999;32:217–238. doi: 10.1016/S0021-9290(98)00161-4.
6. Wang X, Ni Q. Determination of cortical bone porosity and pore size distribution using a low field pulsed NMR approach. J. Orthop. Res. 2003;21:312–319. doi: 10.1016/S0736-0266(02)00157-2.
7. Ma Y-J, Chang EY, Carl M, Du J. Quantitative magnetization transfer ultrashort echo time imaging using a time-efficient 3D multispoke Cones sequence. Magn. Reson. Med. [Internet] 2017;00:1–9. doi: 10.1002/mrm.26716.
Figures