0132
Denoising of Diffusion MRI Improves Peripheral Nerve Conspicuity and Reproducibility1GE Healthcare, New York, NY, United States, 2Hospital for Special Surgery, New York, NY, United States, 3GE Global Research, Niskayuna, NY, United States
Synopsis
This study evaluated q-space-based (genSD) and principal component analysis (PCA) denoising techniques to enhance SNR for peripheral nerve diffusion MRI of 10 healthy knees. The combination of both methods (PCA+genSD) was compared with a PCA-only method as well as the average of 10 repetitions. The combined denoising method showed improved performance with respect to SNR, peripheral nerve conspicuity and reproducibility.
Introduction
Quantitative diffusion MRI (dMRI) is a promising technique to evaluate peripheral nerve integrity1 and provides unique insight into tissue microstructure with recent advanced modeling techniques such as NODDI2 and DKI3. However, these techniques often require clinically impractical scan times and suffer from low SNR, especially for peripheral nerves measuring < 1 cm in diameter. One of the major pitfalls of low SNR is overestimation of fractional anisotropy (FA)4. This study’s objective was to evaluate the efficacy of combined q-space-based and PCA denoising techniques for more reliable peripheral nerve dMRI.Methods
Data Acquisition: Seven healthy volunteers (age 23-30 years; mean age 25; 4F) were scanned at the knee (n=10; 4 unilateral, 3 bilateral) under an IRB-approved protocol on a GE MR750 3T scanner (GE Healthcare, Milwaukee, WI) using a 16 channel flexible coil. A proton density sequence was first acquired (FOV:15 cm, matrix: 512 x 352, TR: 5042ms, TE:27.8ms, slice: 50 x 3mm, NEX: 2, scan time: 4:27min). Diffusion MRI datasets were subsequently acquired with the same scan coverage and comprised 10 repetitions of a multi-shell 55-direction scheme (5 x b = 0, 25 x b=1000, 25 x b=2000 s/mm2) using a prototype multiband SE-EPI sequence (FOV: 15 cm, matrix: 80 x 80, TR = 3000ms, TE = 77ms, slice: 50 x 3mm, NEX: 2, in-plane acceleration: 2, multiband factor: 2, scan time: 10 x 5:33min each repetition).
Diffusion Processing: Processing involved 4 different methods (“original”, “average”, “PCA-only”, “PCA+genSD”) as follows: For the “original” dataset, there was no denoising step. For the “average” dataset, 10 repetitions of the “original” data (equivalent to NEX = 20) were averaged after image registration (see below). The “PCA” denoising, employing random matrix method5, used ‘dwidenoise’ in MRtrix3(www.mrtrix.org). The “genSD” denoising, employing generalized spherical deconvolution deconvolution6, was implemented in MATLAB. 10 repetitions were registered to the average of 10 repetitions (based on b=0 image, prior to any denoising step) as a reference using affine transformation with ‘flirt’ in FSL (www.fmrib.ox.ac.uk/fsl). Note that all data were corrected using the same affine transformation to exclude differences in registration quality. Tensor-based metric calculation using MRtrix3.
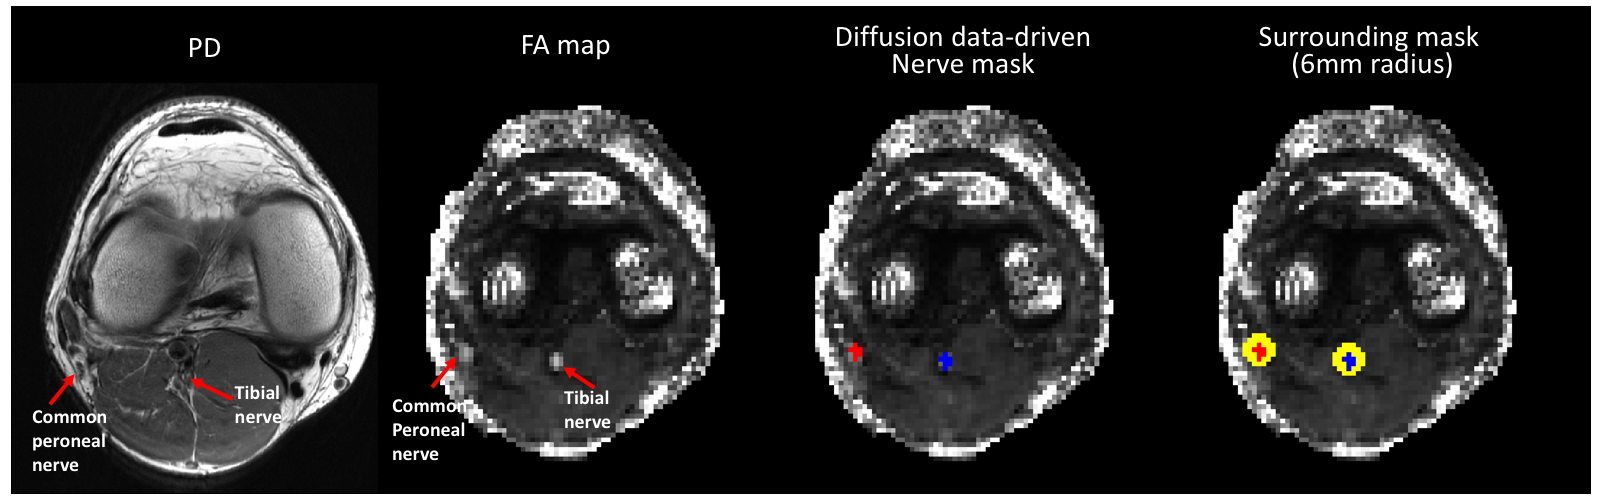
Nerve Segmentation: Nerve segmentation was based on the “average” diffusion dataset in an unbiased manner as follows: 1) Binary map with threshold of FA > 0.3; V1(z-direction) > 0.8; DWI(b=2000) contrast > 50; MD > 0.3 2) Largest cluster connecting neighboring voxels of three nerves (sciatic, tibial, common peroneal) was selected using '3dclust' in AFNI (afni.nimh.nih.gov). 3) By visual inspection, slices below the popliteal fossa were used to generate tibial and common peroneal nerve masks (Figure 1).
Statistics: To quantify nerve conspicuity, contrast-to-noise ratio (CNR) was calculated as follows: CNR = [mean(FAnerve)–mean(FAsurrounding)]/SD(FAsurrounding) where surrounding mask was defined by a 6 mm radius from the nerve center (Figure 1). Within-subject reproducibility was assessed using the coefficient of variation (CV %). A two sample t-test was used to compare two groups and a threshold of P< 0.05 (two-tailed, Bonferroni corrected) defined statistical significance.
Results and Discussion
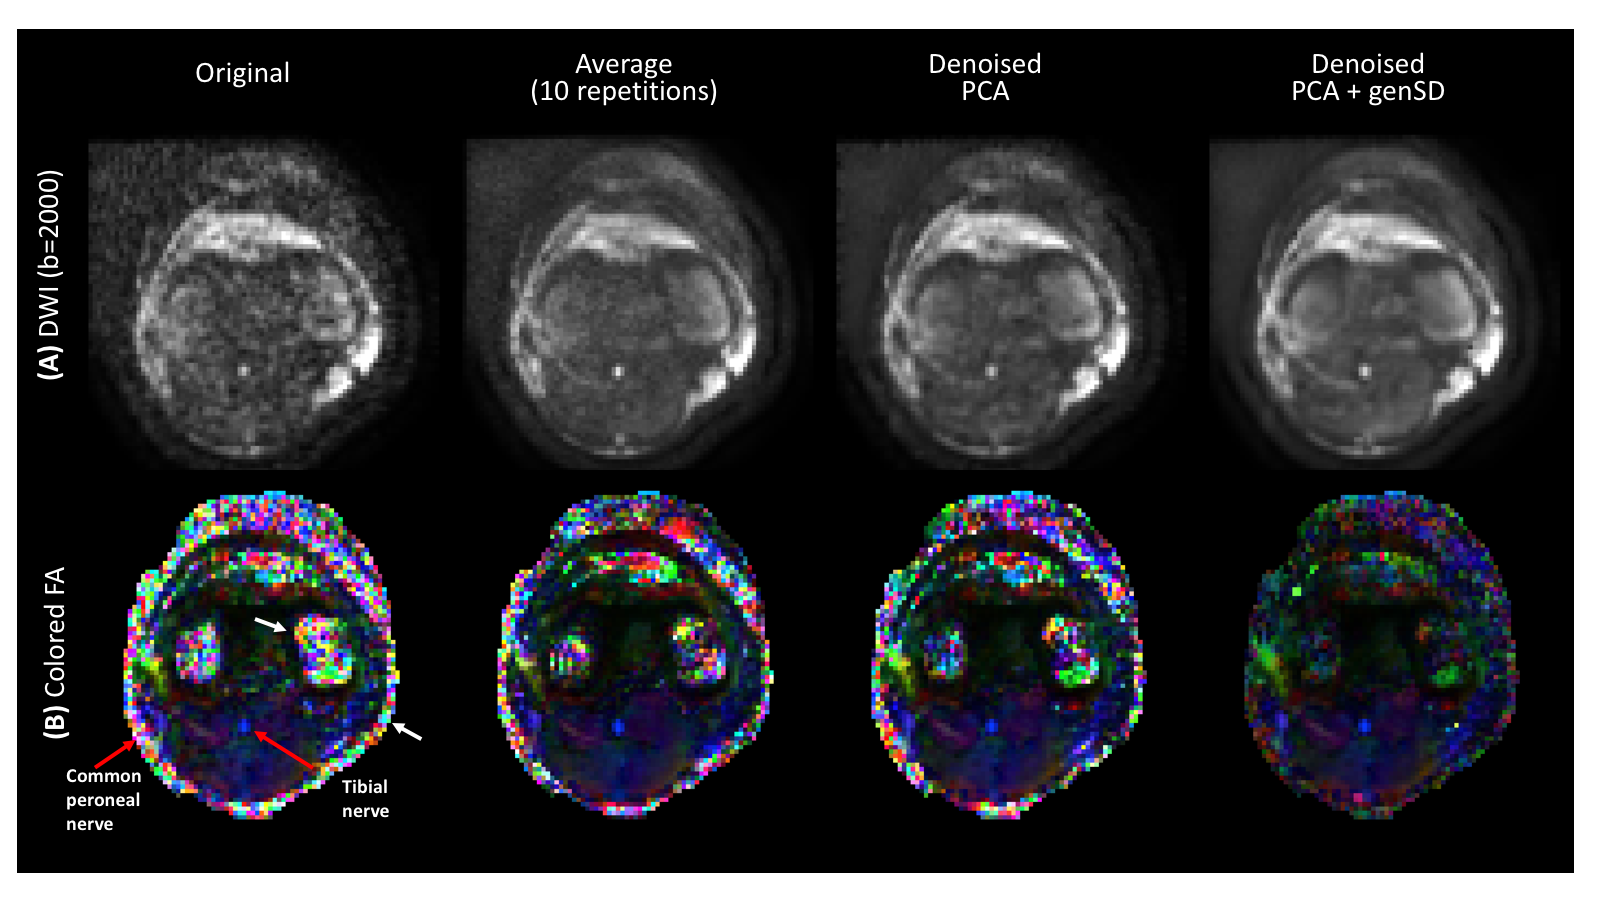
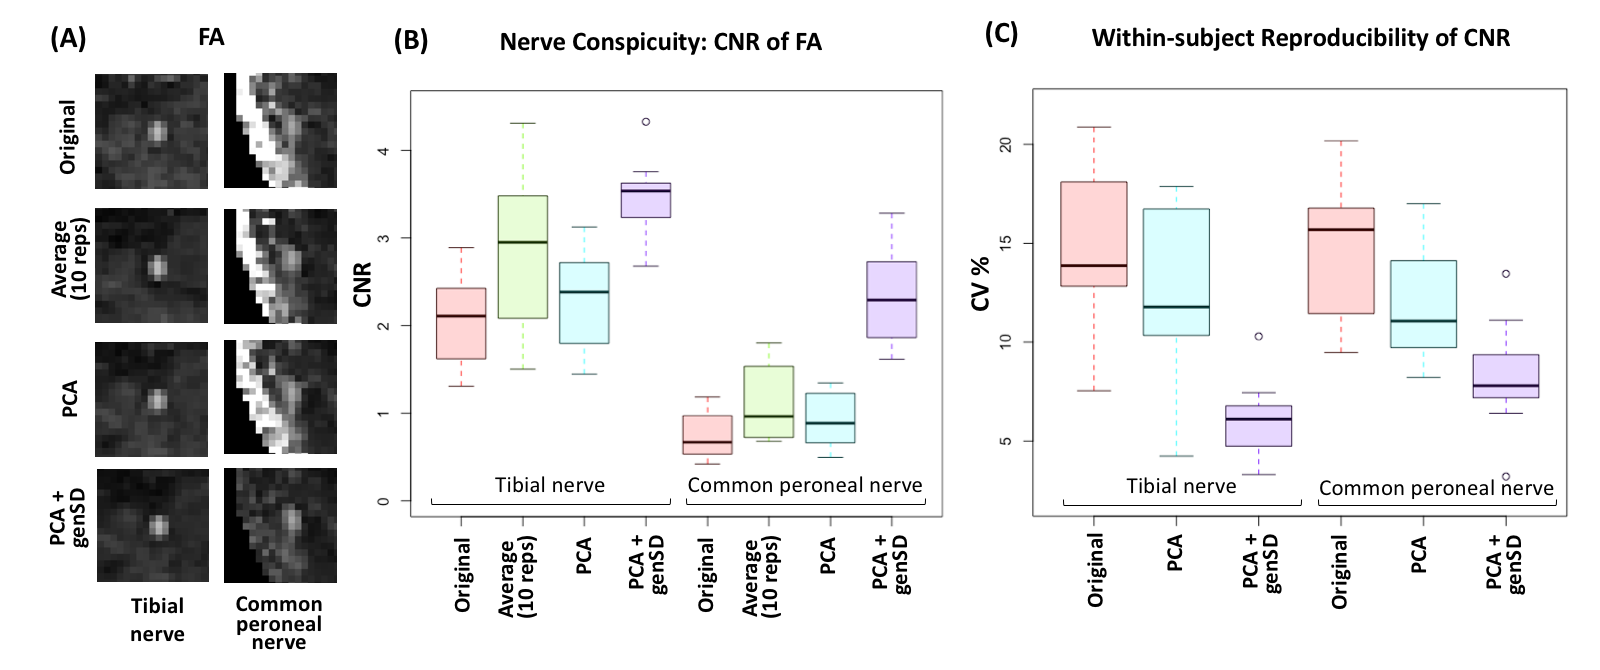
Nerve SNR of the “PCA+genSD” DWI data (b=2000) was significantly higher compared with SNR of the “original” (p = 1.9e-14) and the “PCA-only” data (p = 8.3e-08). The combined “PCA+genSD” method effectively suppressed noise near the skin margin of the knee as well as within bone (Figure 2). Compared to “average” and “PCA only” methods, the combined method visually improved delineation of the common peroneal nerve, in particular. Furthermore, the “PCA+genSD” method demonstrated the highest CNR (nerve conspicuity) on the FA map and the lowest CV % (within-subject reproducibility of CNR) for both nerves (Figure 3).
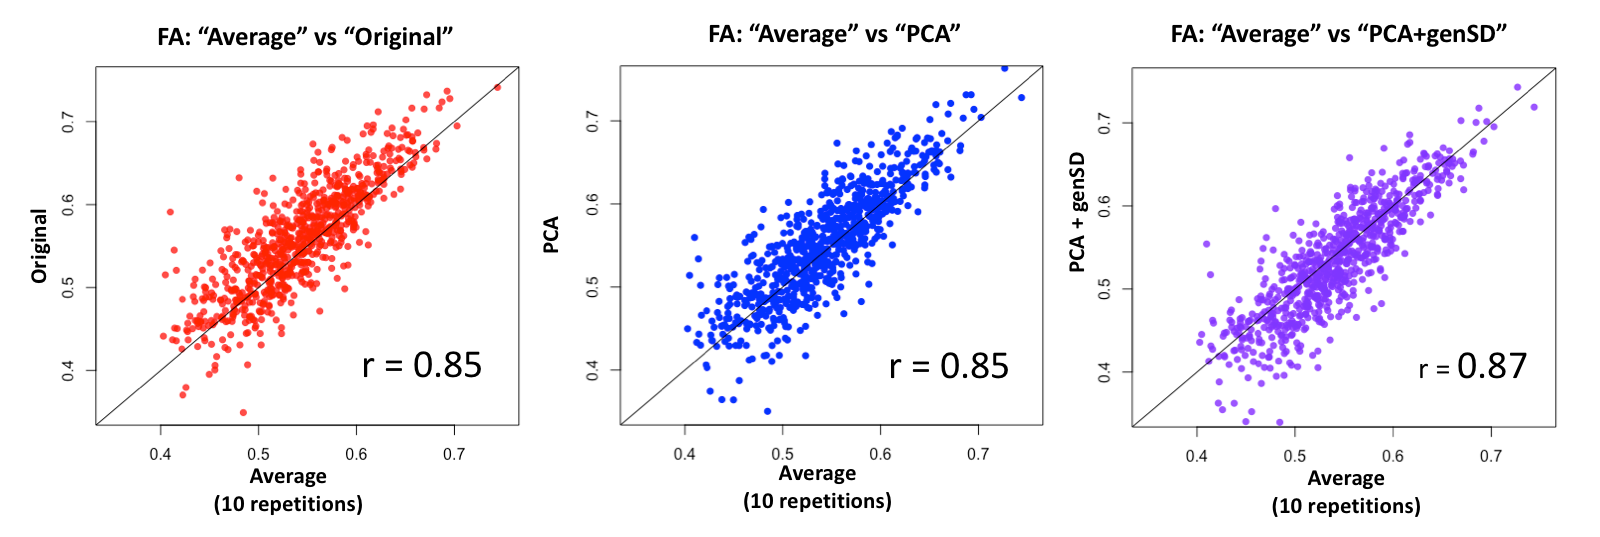
The FA values of all nerves for the different denoising techniques were compared using the FA of the “average” data set as the gold standard. FA of the “original” data (mean 0.56) was significantly higher (p = 6.39e-06) than the FA of the “average” data (mean 0.54), which is consistent with previous findings overestimating FA with low SNR4. There was no significant difference in FA between the “PCA+genSD” data (mean 0.54) and “average” data (Figure 4). Additionally, the highest correlation of FA values was between the “average” and “PCA+genSD” data groups (Figure 4). Positive bias in FA was visually noticeable on the “original” scatter plot (Figure 4).
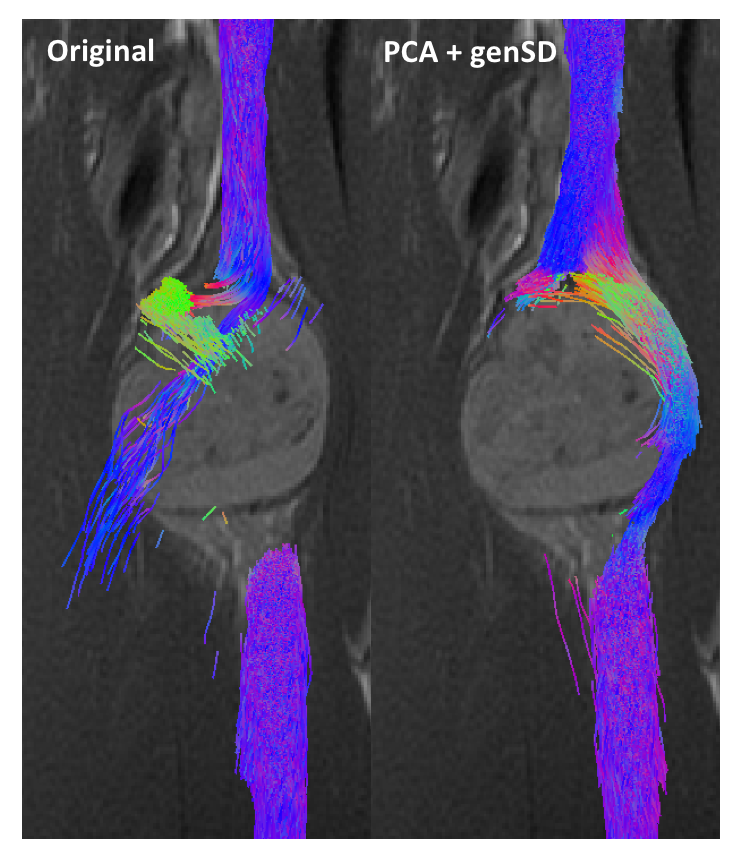
Based on this study’s results, we have since adopted combined denoising for dMRI in clinical practice. For example, Figure 5 illustrates effect of denoising on tractography from a clinical case of a peripheral nerve sheath tumor. Spurious tracts were observed using the original data, but not with the “PCA+genSD” data. Of particular importance are improved reproducibility and lower mean FA values of nerves for the combined denoising technique compared to the native data.
Acknowledgements
No acknowledgement found.References
1. Jeon, T., Fung, M. M., Koch, K. M., Tan, E. T., & Sneag, D. B.Peripheral nerve diffusion tensor imaging: Overview, pitfalls, and future directions. J Magn Reson Imaging. 2018;47(5):1171-1189.
2. Zhang, H., Schneider, T., Wheeler-Kingshott, C. A., & Alexander, D. C. NODDI: practical in vivo neurite orientation dispersion and density imaging of the human brain. Neuroimage. 2012;61(4):1000-1016.
3. Jensen, J. H., Helpern, J. A., Ramani, A., Lu, H., & Kaczynski, K. Diffusional kurtosis imaging: the quantification of non‐gaussian water diffusion by means of magnetic resonance imaging. Magn Reson Med. 2005;53(6) :1432-1440.
4. Froeling, M., Nederveen, A. J., Nicolay, K., & Strijkers, G. J.DTI of human skeletal muscle: the effects of diffusion encoding parameters, signal‐to‐noise ratio and T2 on tensor indices and fiber tracts. NMR Biomed. 2013;26(11) :1339-1352.
5. Veraart, J., Fieremans, E., & Novikov, D. S.Diffusion MRI noise mapping using random matrix theory. Magn Reson Med. 2016;76(5):1582-1593.
6. Sperl, J. I., Sprenger, T., Tan, E. T., Menzel, M. I., Hardy, C. J., & Marinelli, L. Model‐based denoising in diffusion‐weighted imaging using generalized spherical deconvolution. Magn Reson Med. 2017;78(6):2428-2438.
Figures