0129
Deep Learning Pipeline for Automated Identification of Osteoarthritic Degenerative Changes in the Hip1Radiology and Biomedical Imaging, University of California San Francisco, San Francisco, CA, United States
Synopsis
Manual identification of bone and cartilage abnormalities in MR images can be laborious and time consuming. The goal of this study was to develop a fully automated deep learning pipeline to identify morphological and degenerative changes in patients with hip osteoarthritis (OA). It included an object detection deep convolutional neural network (DCNN) that generated cropped images of the hip joint and a classification DCNN that identified the presence of morphological bone and cartilage changes.
Introduction
Osteoarthritis (OA) is a debilitating joint disease that involves the degeneration of the articular cartilage and affects more than 25% of the adult population [1]. Previously, SHOMRI (Scoring Hip Osteoarthritis with MRI) has been proposed as an MR-based hip OA evaluation system, based on the presence of morphological abnormalities, such as bone marrow edema, cartilage lesions, labral abnormalities and cysts [2]. However, manual identification of bone and cartilage abnormalities in MR images can be laborious and time consuming. Thus, the goal of this study was to develop a fully automated deep learning pipeline to identify morphological and degenerative changes in patients with OA of the hip joint that would act as a radiology assist in image interpretation.Methods
133 subjects with radiographic or symptomatic hip OA (as graded by SHOMRI) were recruited for this study (age 42.88±12.75 years, BMI 22.94±3.029 Kg/m3, 75 males, 58 females). T2-weighted, fat-saturated coronal hip images (TR = 60 ms, TR = 2.4s, slice thickness=4 mm, matrix=288x224, FOV=14-20 cm) were acquired on a 3T Discovery 750 MR scanner (GE Healthcare, Waukesha, WI).
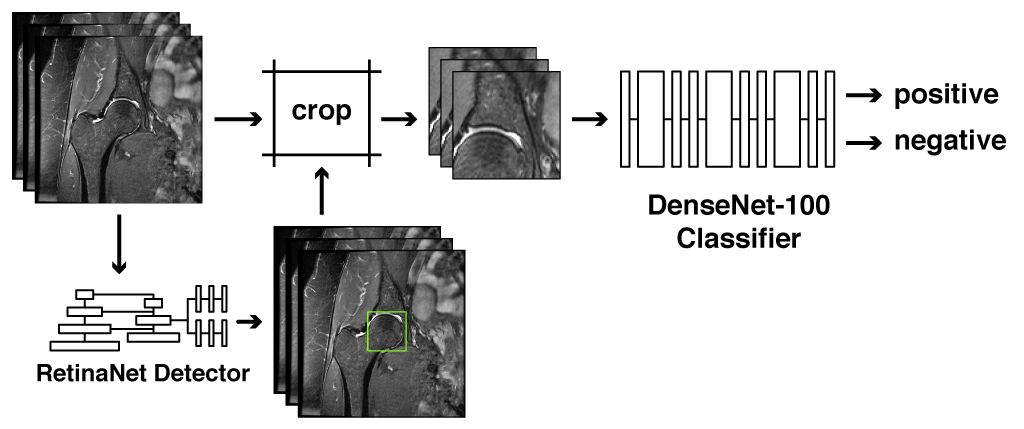
An end-to-end automated pipeline was built to evaluate morphological degenerative changes (Fig. 1). It included an object detection deep convolutional neural network (DCNN) that generated cropped images of the hip joint and a classification DCNN that identified the presence of morphological bone and cartilage abnormalities.
The object detection network was implemented in Python and TensorFlow Object Detection API (Google, Mountain View, CA) on single-shot detector with Resnet-50 feature pyramid network (RetinaNet) architecture [3]. The model was pre-trained on ImageNet classification and COCO object detection datasets and trained with Nvidia Titan X GPU on a dataset of 70 hip MR images with bounding boxes around the femoral head (90% train / 10% validation, random flip augmentation, batch=8, 25000 iterations). The network's output was the central slice and the bounding box over the femoral head, which was used to extract a set of 5 slices, cropped around the weight bearing region of the joint (Fig. 1). These cropped images were labeled by two trained radiologists on the presence of bone marrow edema and cartilage lesions.
The classification DCNN was implemented using PyTorch framework with DenseNet-100 architecture [5,6], pretrained on grayscale CIFAR-32 dataset. The model used an SGD optimizer with initial learning rate of 0.005 reduced to 0.001 after 20 epochs, momentum=0.9, weight_decay=5e-4, and random horizontal flip augmentation. It was trained on datasets of 539 and 647 images (edema, cartilage lesions) with batch of 60, 170 epochs, 65-15-10% train-validation-test split. Saliency maps were generated using Grad-CAM algorithm [7,8].
Results
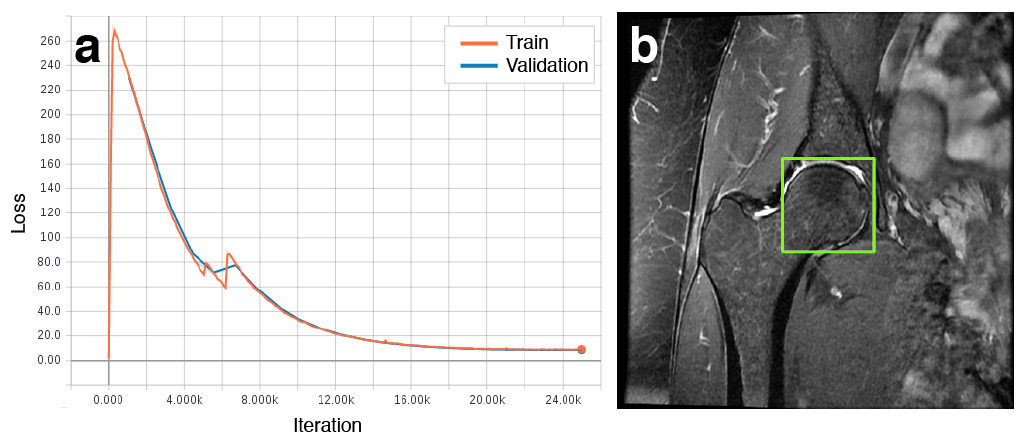
The detection network showed excellent convergence, without overfitting at 25000 iterations (Fig. 2). The object detection showed a mean intersection over union of 0.92±0.04 on the validation dataset.
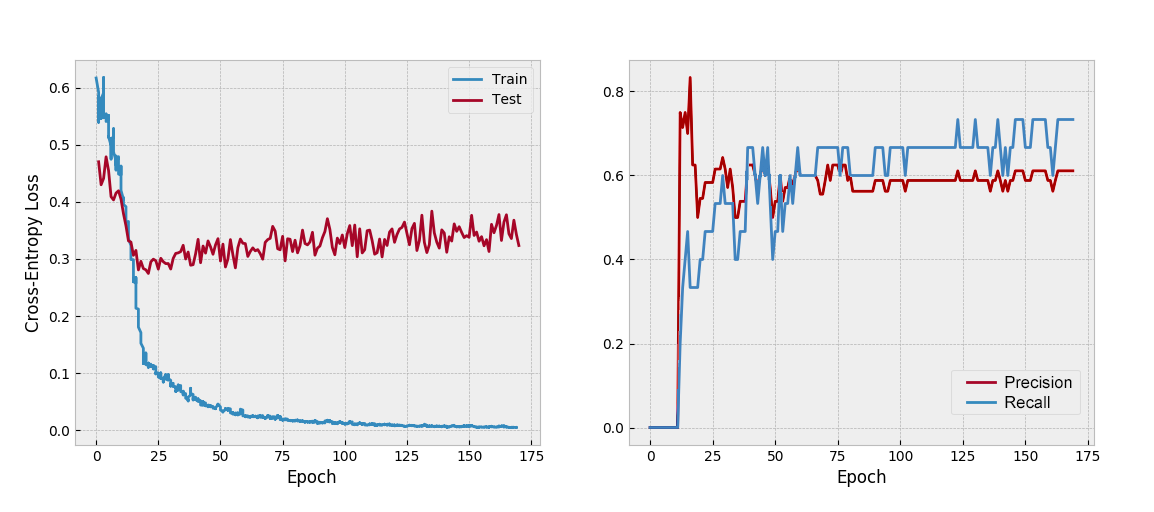
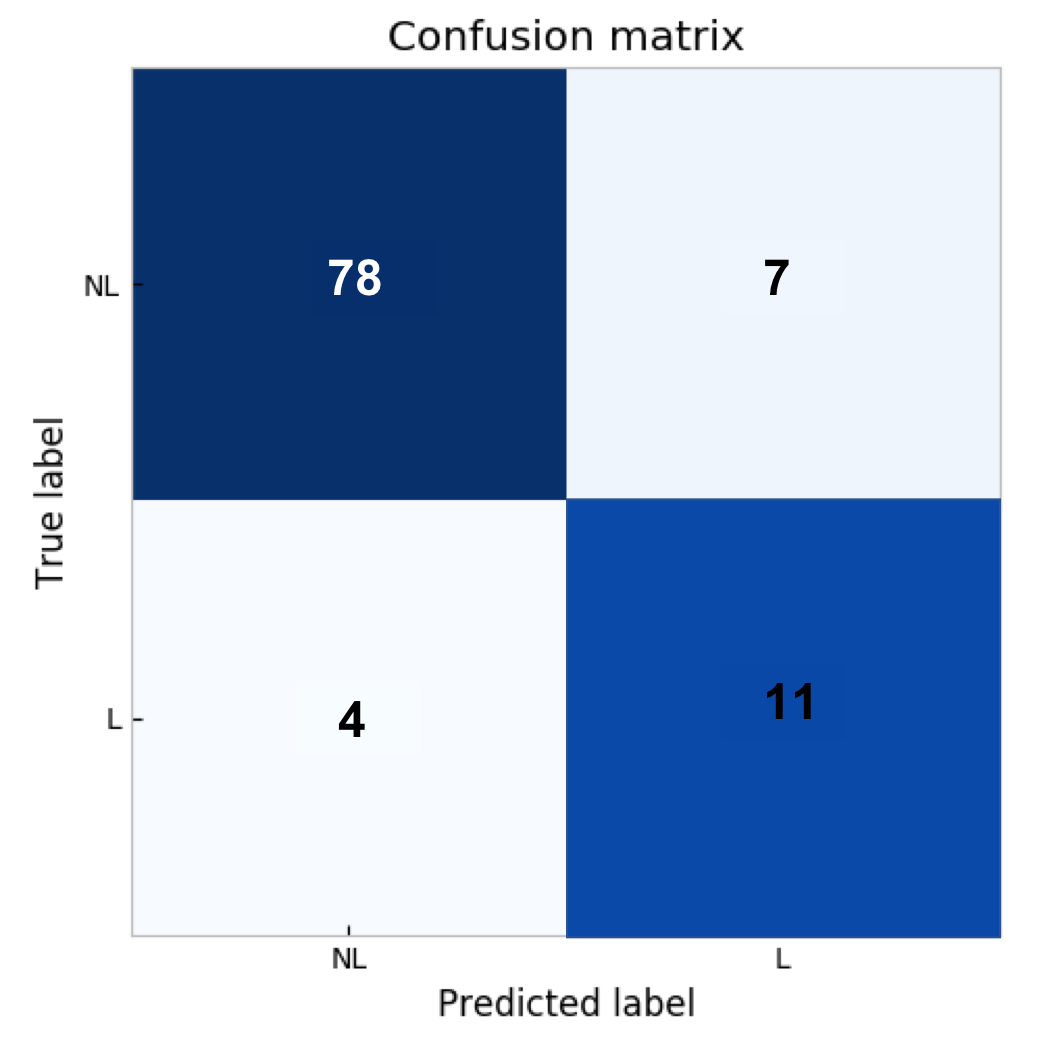
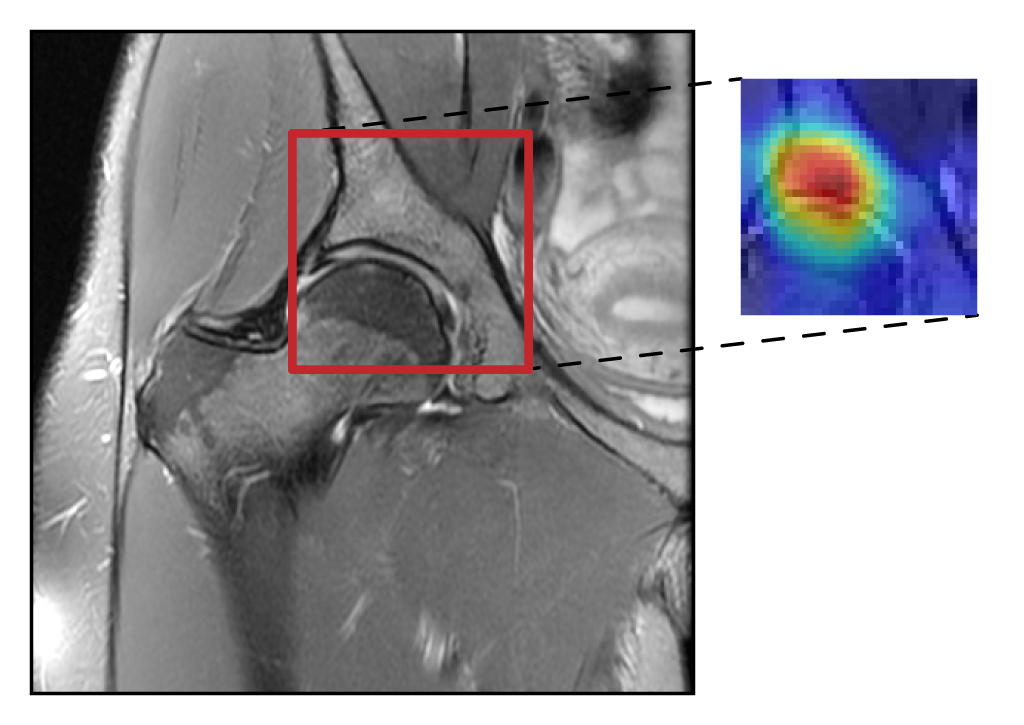
Figure 3 shows cross-entropy loss and precision/recall plots of the bone marrow edema detection network with the corresponding confusion matrix shown in figure 4. It achieved sensitivity of 0.73 and specificity of 0.92 on the validation dataset. The cartilage lesion detection network had sensitivity of 0.67 and specificity of 0.68 after 13 epochs. An example of a saliency map generated during inference with the bone marrow edema classification network is shown in figure 5.
Discussion
Our results have demonstrated the feasibility of automated identification of OA degenerative changes. Automated cropping using deep detection network allowed to focus attention on the weight-bearing area of the joint and reduced the number of parameters. Transfer learning using pre-trained detection and classification checkpoints allowed to achieve good results in a few iterations, despite having an unbalanced dataset for edema classification, and a small number of images in the training set. Future work includes training and evaluating the pipeline with a significantly-larger set of clinical hip MRI exams.Acknowledgements
EO and RT have contributed equally to this work.
This project was supported by NIH-NIAMS grants R01AR069006 and P50AR060752.
References
- Chen D, et al. Osteoarthritis: toward a Comprehensive Understanding of Pathological Mechanism. Bone Research, vol. 5, 2017.
- Lee S, et al. Scoring hip osteoarthritis with MRI (SHOMRI): A whole joint osteoarthritis evaluation system. Journal of Magnetic Resonance Imaging. 2015;41(6):1549-1557.
- Lin T, et al. Focal loss for dense object detection. IEEE Transactions on Pattern Analysis and Machine Intelligence. 2018;:1-1.
- Huang J, et al. Speed/accuracy trade-offs for modern convolutional object detectors. CVPR 2017.
- Huang G, et al. Densely connected convolutional networks. CVPR 2017.
- Amos B, et al. A PyTorch Implementation of DenseNet. https://github.com/bamos/densenet.pytorch.
- Selvaraju RR, et al. Grad-CAM: Visual Explanations from Deep Networks via Gradient-Based Localization. ICCV 2017
- Nakashima K. Grad-CAM with PyTorch. https://github.com/kazuto1011/grad-cam-pytorch
Figures