0128
GagCEST at 3T Can Detect Cartilage Differences Between Healthy and OA Subjects1Department of Radiology, Stanford University, Stanford, CA, United States, 2Department of Bioengineering, Stanford University, Stanford, CA, United States, 3Musculoskeletal Research Laboratory, VA Palo Alto Healthcare System, Palo Alto, CA, United States, 4Department of Mechanical Engineering, Stanford University, Stanford, CA, United States, 5Orthopaedic Surgery, Stanford, Stanford, CA, United States
Synopsis
Chemical exchange saturation transfer of GAG (gagCEST) is a quantitative MR technique that is a useful biomarker for assessing GAG content at 7T. However, its utility at 3T remains unclear. In this study, we compare gagCEST asymmetry values of healthy and osteoarthritic subjects scanned at 3T. Comparisons between healthy and OA subjects indicate a significant difference in the average gagCEST signal across the medial and lateral anterior and medial weight-bearing regions of the femoral cartilage. The results of this study suggest that there is potential for use of gagCEST in the study of OA at 3T.
Introduction
Osteoarthritis (OA) is a degenerative joint disease and one of the leading causes of disability globally1. The study of OA is hampered by a lack of non-invasive tools to detect early and reversible changes associated with the disease. Early OA is characterized by cartilage proteoglycan depletion related to an increase in enzymatic degradation2. Glycosaminoglycan (GAG) side chains attached to proteoglycans may be measured using delayed gadolinium-enhanced magnetic resonance imaging of cartilage (dGEMRIC)3, T1ρ4, sodium imaging5, and chemical exchange saturation transfer of GAG (gagCEST)2. GagCEST is of particular interest due to its specificity to GAG content without the use of exogenous contrast agents or specialized hardware. While gagCEST has been shown to be a useful biomarker for cartilage composition at 7T6, there is limited evidence of its utility at 3T7. In this study, we assess the utility of gagCEST at 3T by comparing gagCEST asymmetry in subjects with established OA to healthy controls.Methods
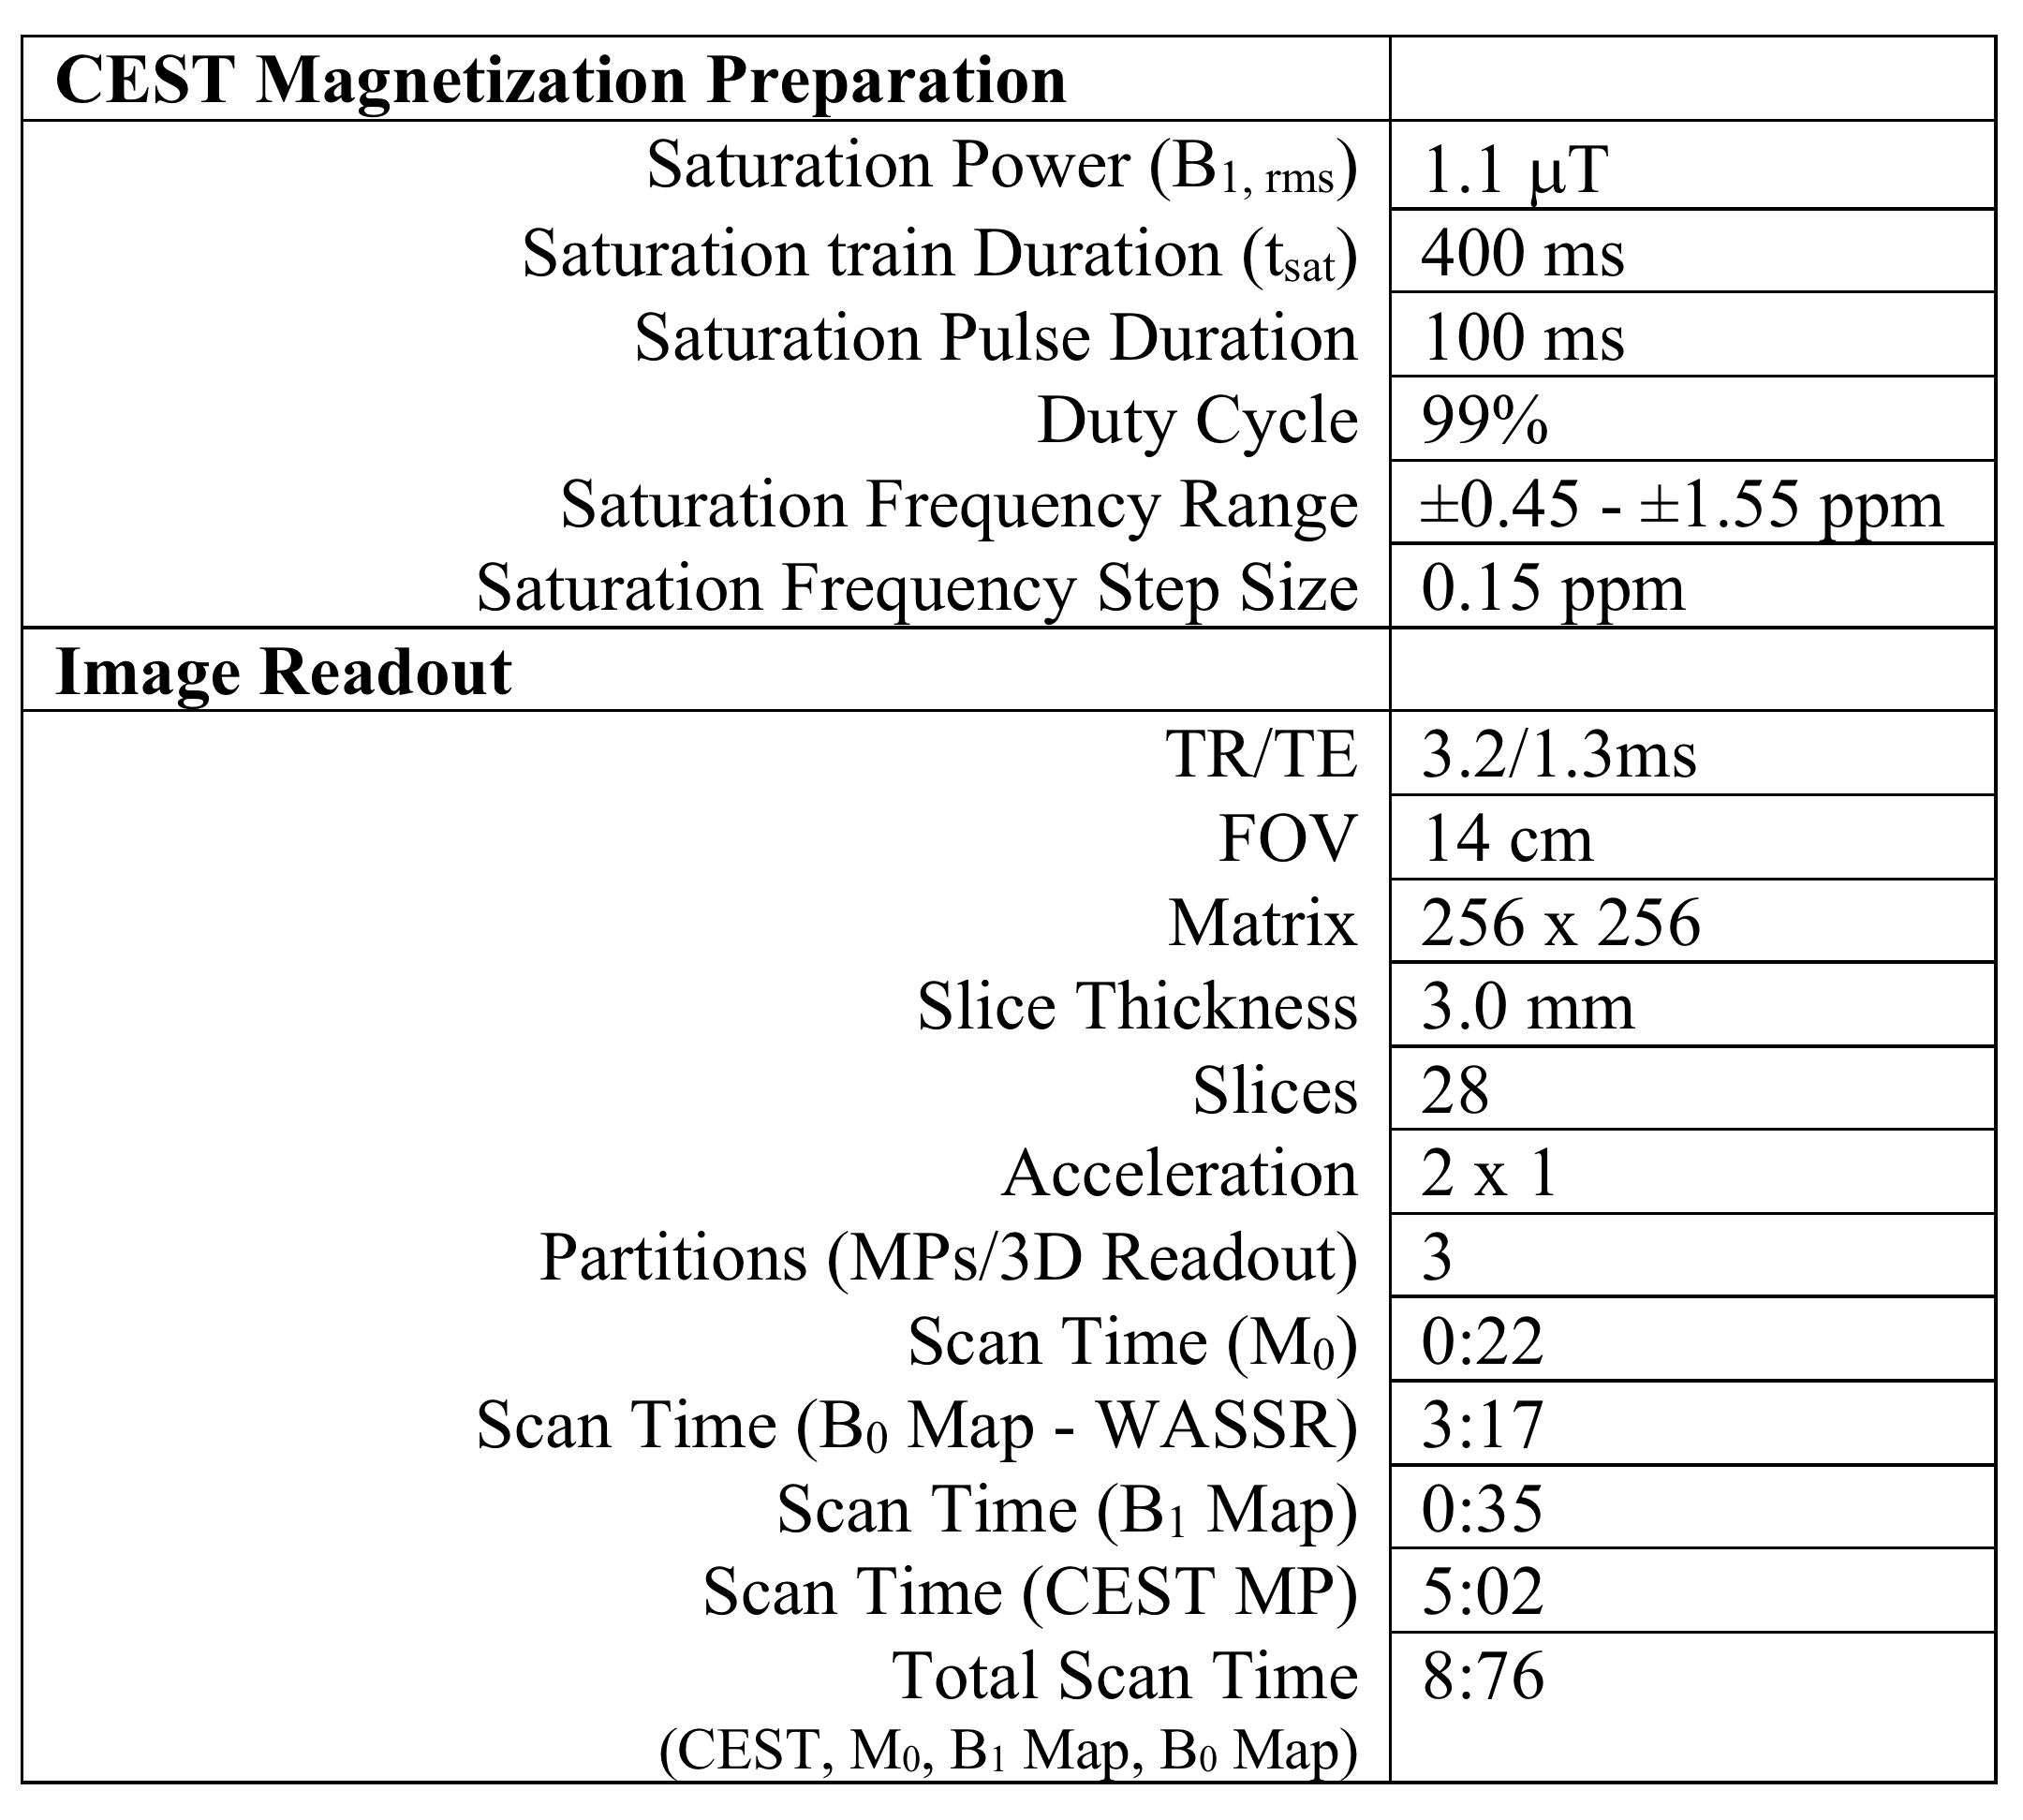
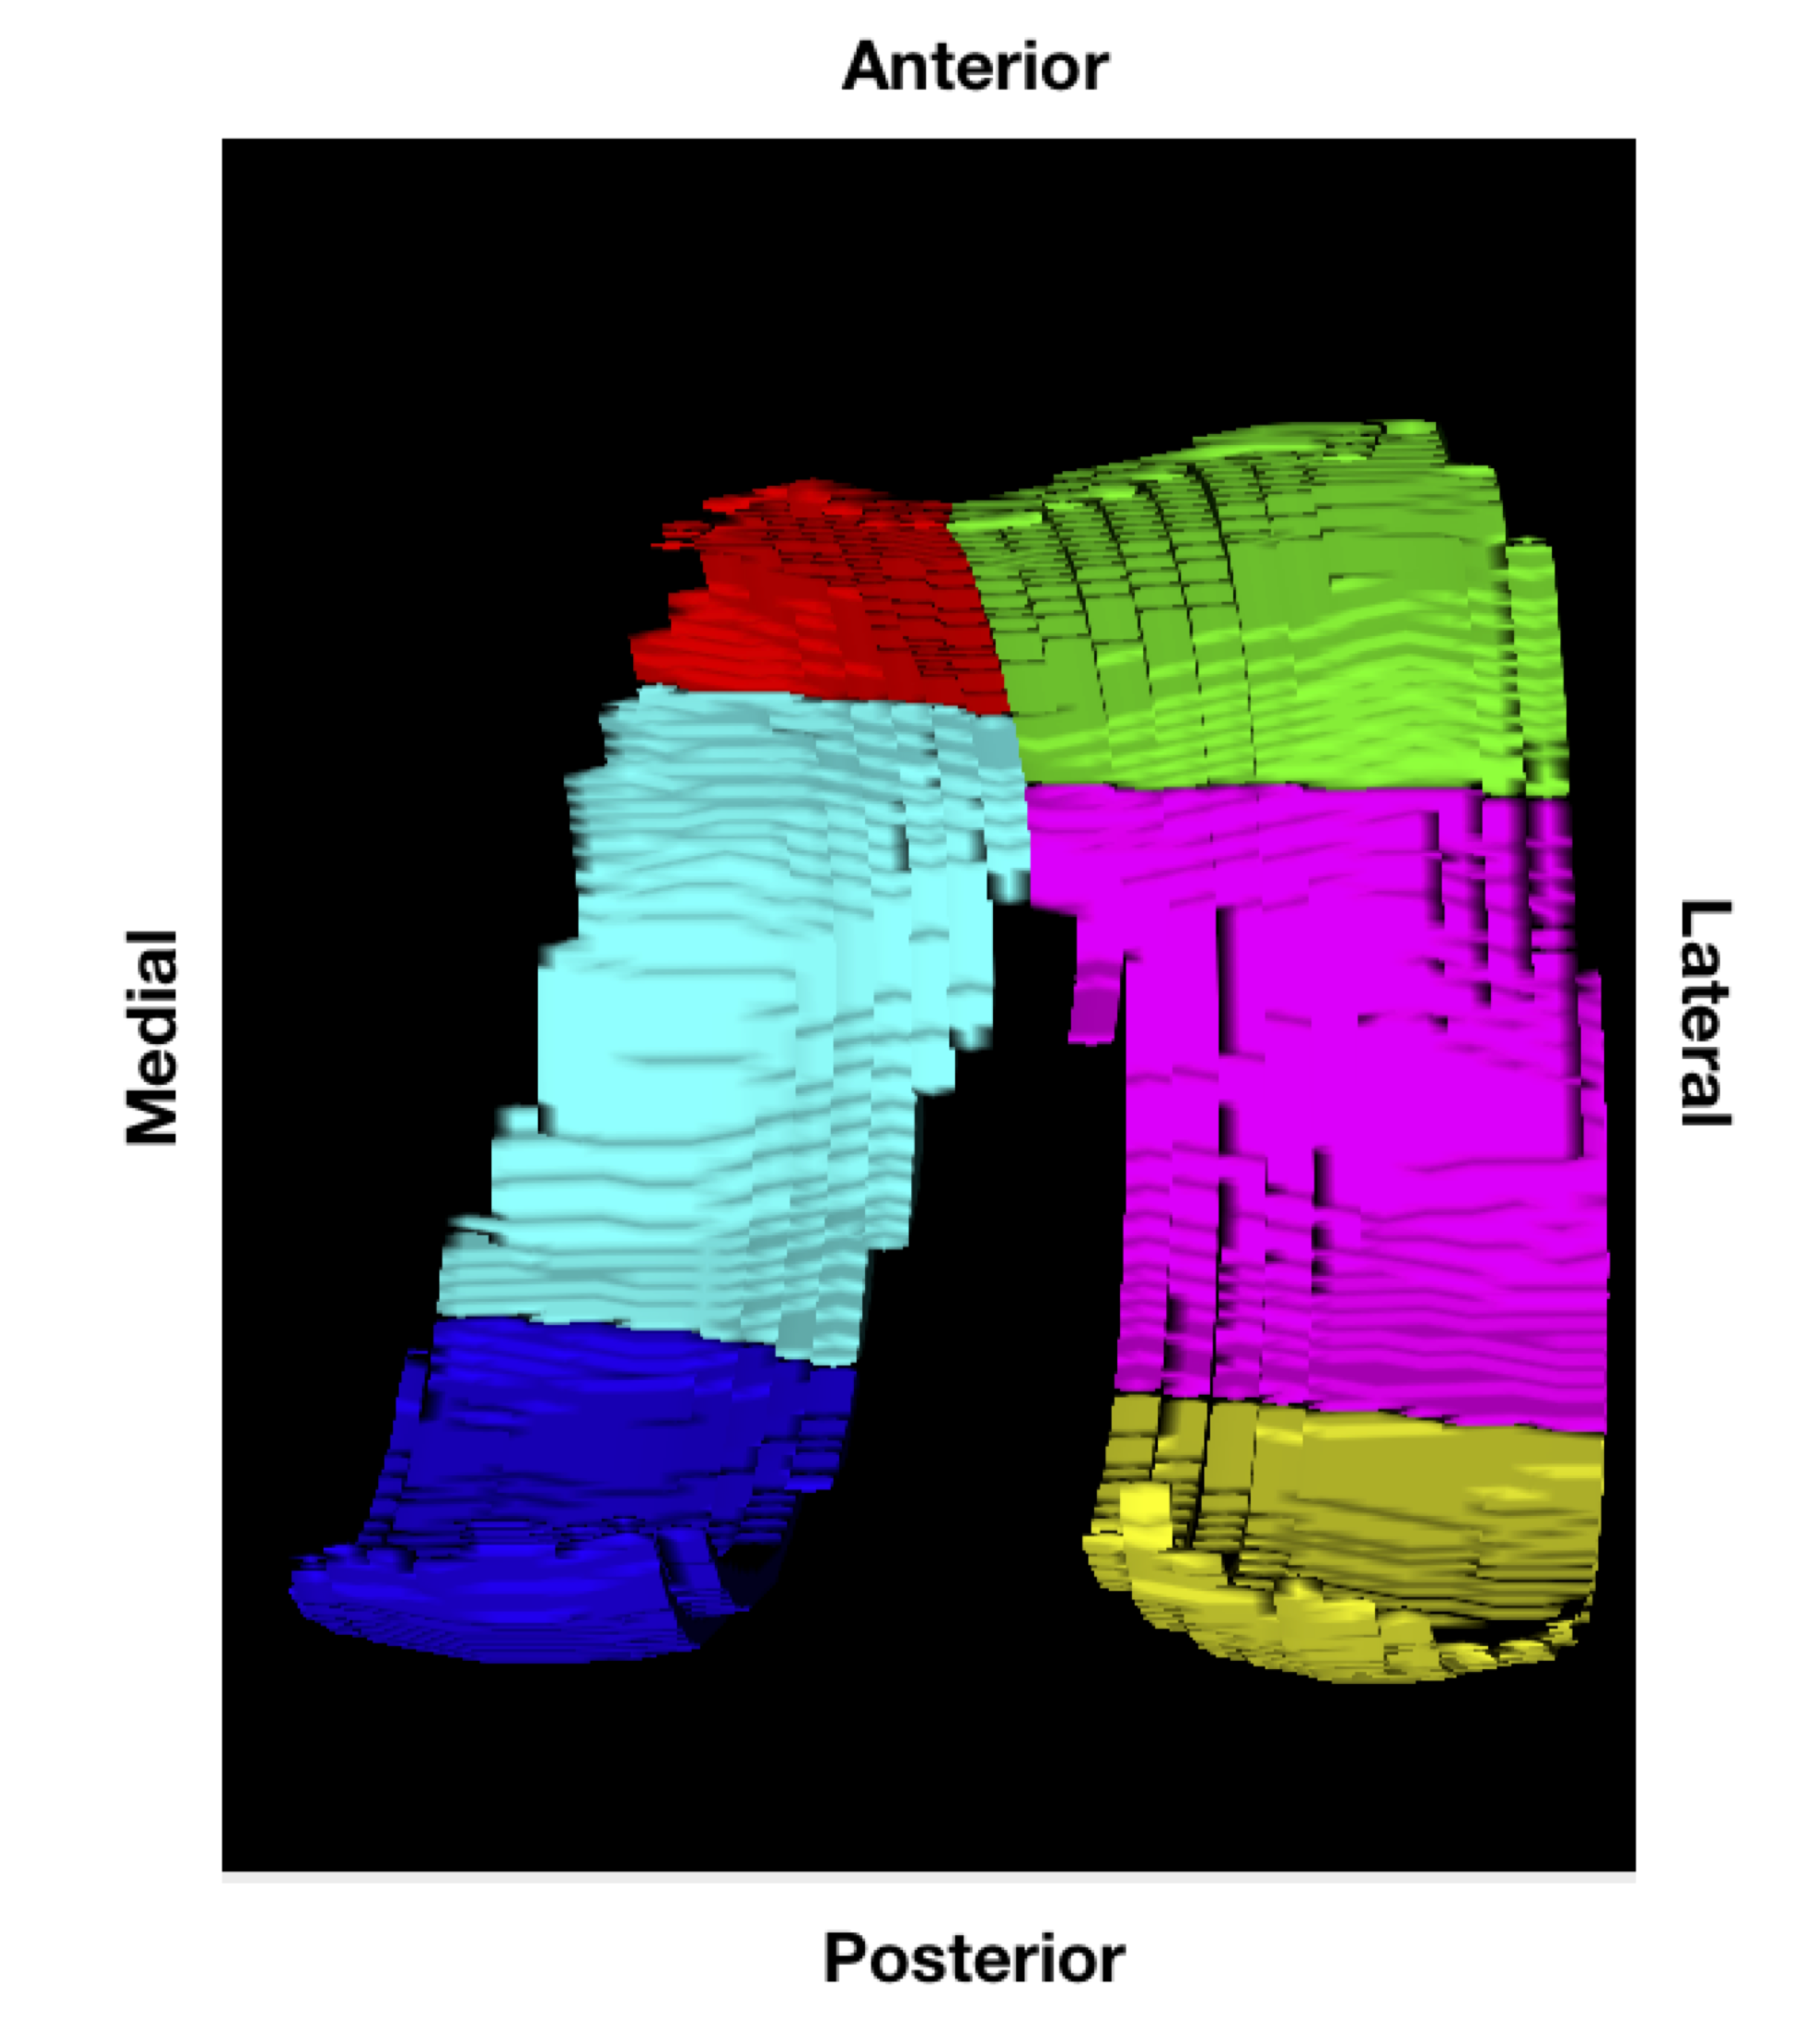
Ten healthy subjects (5 female and 5 male, ages 20-30) and 12 osteoarthritic subjects with medial compartment OA (8 female and 4 male, ages 60-70) with a Kellgren-Lawrence (KL) grade of 2 (assessed using radiography) were imaged at 3T (GE Healthcare) using a 16-channel flex coil. Other inclusion criteria were: no previous ACL reconstruction surgery and BMI < 35. GagCEST images were acquired with a magnetization prepared 3D spoiled gradient-echo sequence2 (imaging parameters in Table 1). B0 and B1 inhomogeneities were corrected using WASSR and double angle methods, respectively2. CEST asymmetry due to GAG was calculated using the normalized B0 corrected signal intensity at ±1.0 ppm, the chemical shift of GAG hydroxyl protons, using the equation: gagCESTasym = [S(-1.0 ppm)-S(+1.0 ppm)]/ S0]. Femoral cartilage was manually segmented and subdivided into 6 regions: anterior, posterior, and weight-bearing (central) for the medial and lateral condyles (Figure 1). Statistical comparisons between groups were made using a Wilcoxon-Mann Whitney test. Results
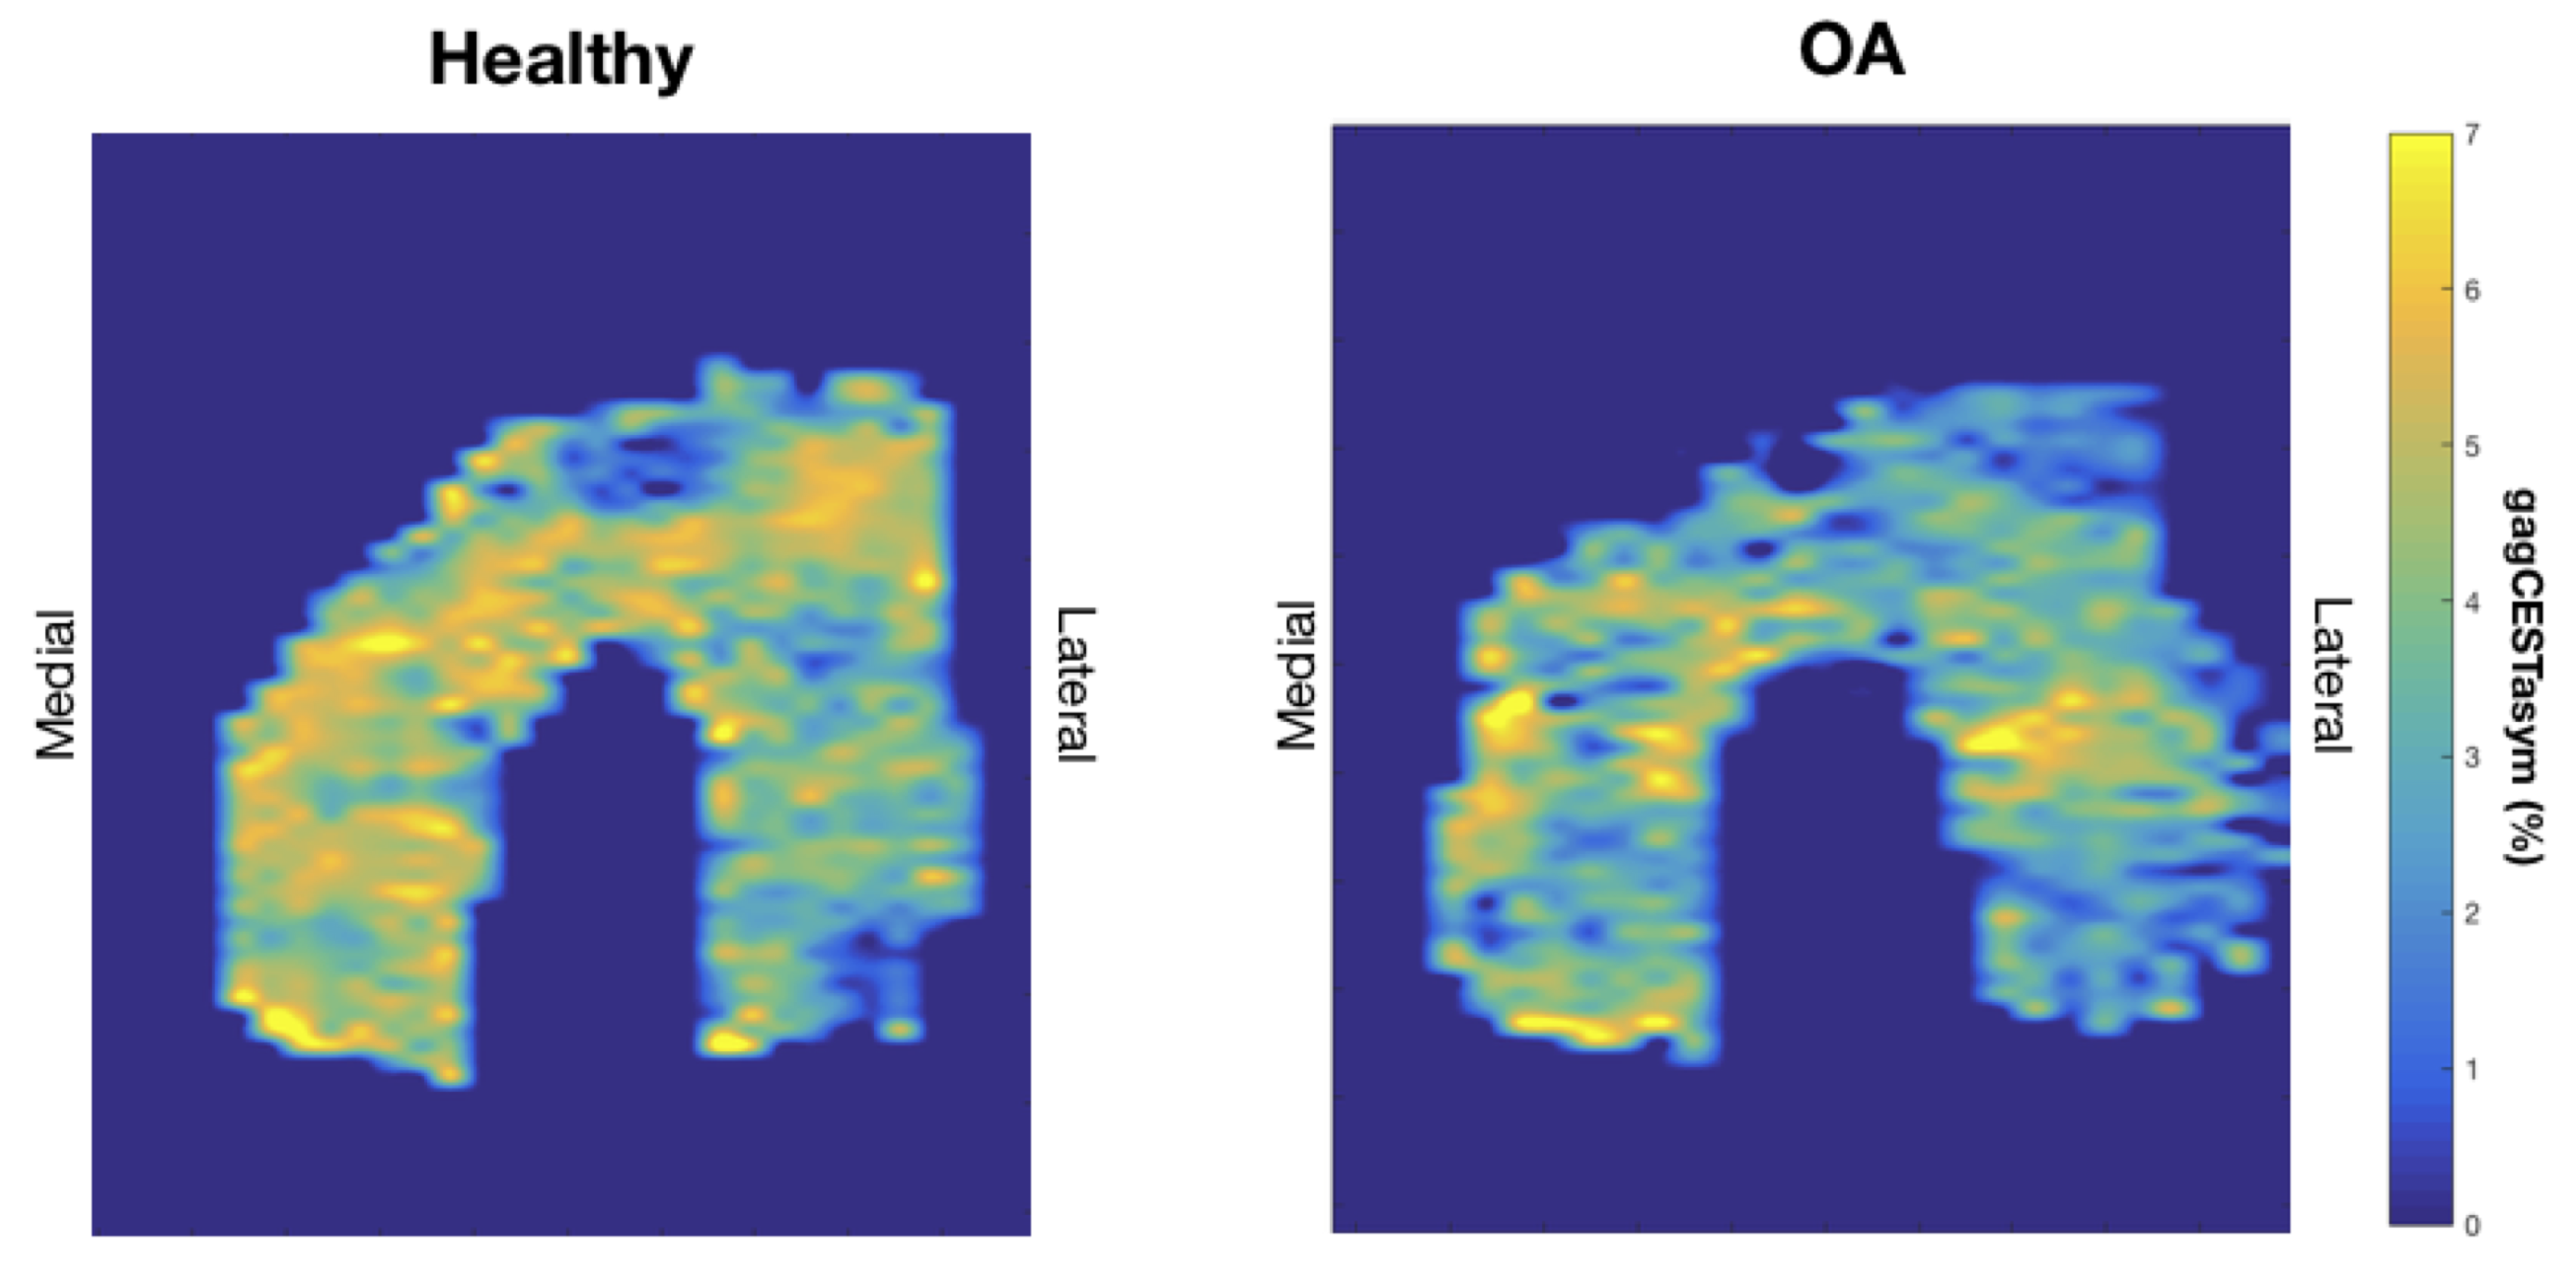
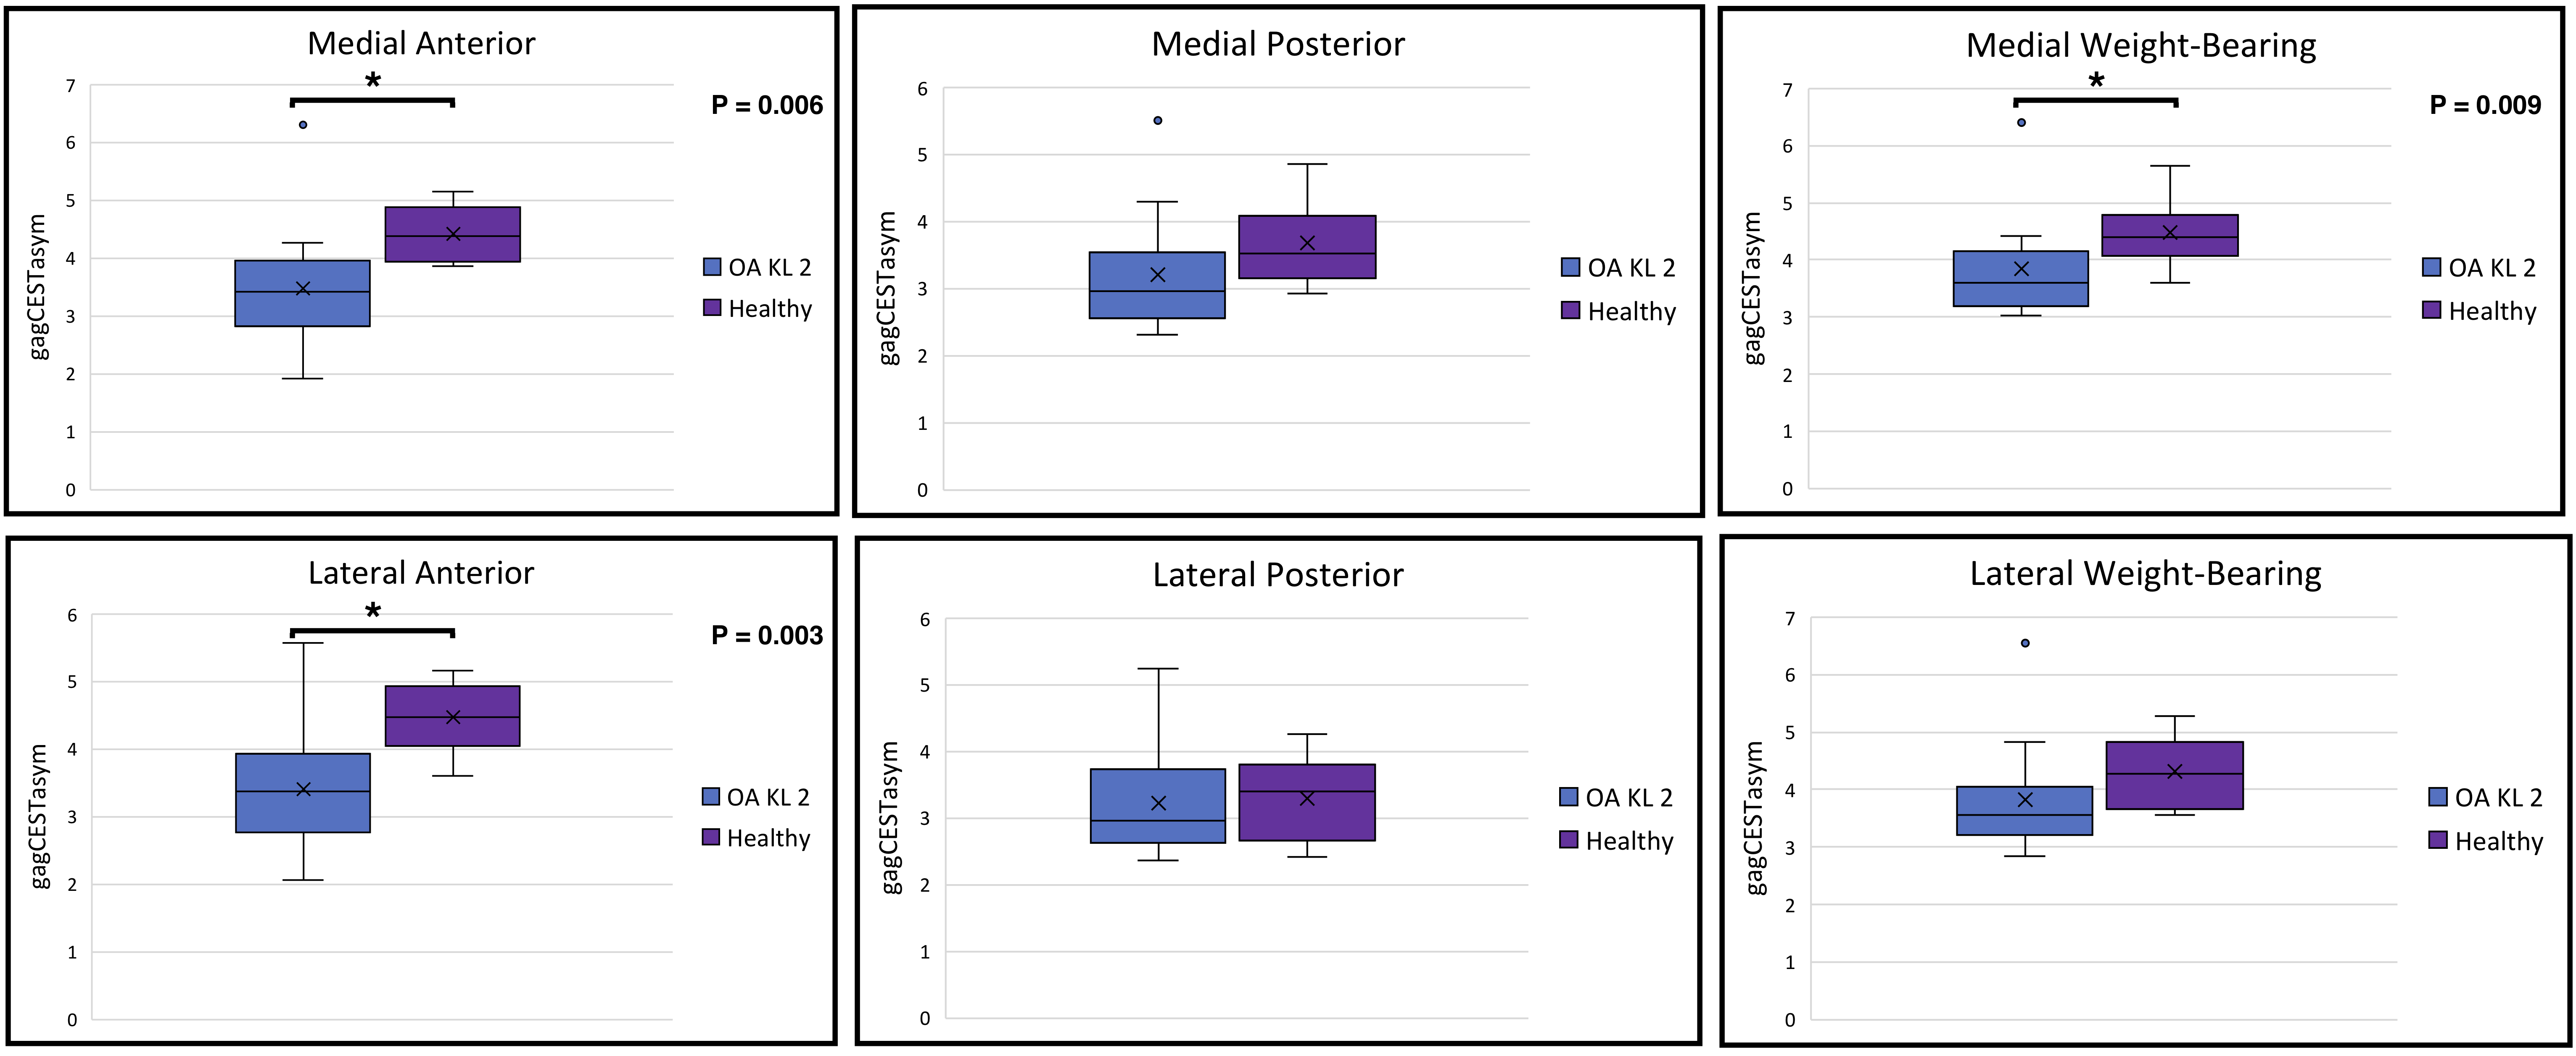
Subjects with mild OA showed a reduced gagCEST asymmetry compared to healthy controls (p = 0.0027) (Figure 2). Compartmental analysis showed a statistically significant reduction in gagCEST asymmetry in the medial weight-bearing femoral condyle (p = 0.009) as well as in the medial (p = 0.006) and lateral (p = 0.003) anterior femoral compartments. There was a trend, though not significant in all of the compartments, of higher medial gagCEST asymmetry compared to lateral in both healthy and OA groups.Discussion
Our gagCEST methods were able to detect a statistically significant reduction in gagCEST asymmetry in osteoarthritic subjects, known to have cartilage degeneration and lower biochemical GAG composition2, compared to healthy controls at 3T. Further, regional analysis showed significant changes in the medial weight-bearing sub-region as well as in the anterior (trochlear) sub-regions, which corresponds well with the medial compartment OA diagnosis in our cohort. Our 3D gagCEST methods showed increased dynamic range compared to previous work7, which was skeptical of the application of gagCEST at 3T. Further, at a total acquisition time of 8:76 minutes for whole joint coverage, these methods offer translational potential. It is important to note that the study used a small number of subjects and that cohorts were not age-matched.
Although our cohort had moderate OA, the results of this preliminary study demonstrate promise for the application of gagCEST at 3T to detect the earlier stages of GAG depletion which may be reversible8.
Conclusion
Our results demonstrate that current methods for gagCEST imaging at 3T may be useful for detecting differences between healthy cartilage and cartilage in subjects with OA. Though these osteoarthritic subjects already show established OA changes in knee radiographs, there is potential for measuring GAG at earlier stages of the disease.Acknowledgements
This work was funded by Stanford Graduate Fellowships (including the William K Bowes Jr. Fellowship), NSF Graduate Research Fellowship #DGE-114747, GE Healthcare, National Institutes of Health (NIH) grants K99EB022634, RO1 EB002524, and K24 AR062068, and the Merit Review Award Number I01 RX001811 from the United States Department of Veterans Affairs Rehabilitation R&D Service.References
1. Neogi, Tuhina. (2013). The epidemiology and impact of pain in osteoarthritis. Osteoarthritis & Cartilage, 21(9), 1145-1153.
2. Kogan, F., Hargreaves, B. A., Gold, G. E. (2016). Volumetric multislice gagCEST imaging of articular cartilage: Optimization and comparison with T1rho. Magnetic Resonance in Medicine, 77(3), 1134-1141.
3. Li X, Majumdar S. (2013). Quantitative MRI of articular cartilage and its clinical applications. J Magnetic Resonance Imaging. 38(5), 991–1008.
4. Singh A, Haris M, Cai K, Kogan F, Hariharan H, Reddy R. (2014). High resolution T1rho mapping of in vivo human knee cartilage at 7T. PloS One, 9(5), e97486. doi: 10.1371/journal.pone.00974865.
5. Bangerter, N. K., Tarbox, G. J., Taylor, M. D., Kaggie, J. D. (2016). Quantitative sodium magnetic resonance imaging of cartilage, muscle, and tendon. Quantitative Imaging in Medicine and Surgery, 6(6), 699-714.
6. Schmitt B, Zbyn S, Stelzeneder D, Jellus V, Paul D, Lauer L, Bachert P, Trattnig S. (2011). Cartilage quality assessment by using glycosaminoglycan chemical exchange saturation transfer and (23) Na MR imaging at 7T. Radiology, 260(1), 257–264.
7. Singh, A., Haris, M., Cai, K., Kassey, V. B., Kogan, F., Reddy, D., Hariharan, H., Reddy, R. (2011). Chemical exchange saturation transfer magnetic resonance imaging of human knee cartilage at 3 T and 7 T. Magnetic Resonance in Medicine, 68(2), 588-94.
8. Karsdal, M. A., Madsen, S. H., Christiansen, C., Henriksen, K., Fosang, A. J., Sondergaard, B. C. (2008). Cartilage degradation is fully reversible in the presence of aggrecanase but not matrix metalloproteinase activity. Arthritis Research & Therapy, 10(3), R63.
Figures