0127
Multi-vendor multi-site T1ρ and T2 quantification of knee cartilage1Program of Advanced Musculoskeletal Imaging (PAMI), Cleveland Clinic, Cleveland, OH, United States, 2University of California, San Francisco (UCSF), San Francisco, CA, United States, 3University of Kentucky, Lexington, KY, United States, 4Albert Einstein College of Medicine, Bronx, NY, United States, 5Arthritis Foundation, Atlanta, GA, United States, 6Siemens Medical Solution Inc, Malvern, PA, United States, 7GE Healthcare, Milwaukee, WI, United States, 8Philips Healthcare, Andover, MA, United States
Synopsis
T1ρ and T2 relaxation times are promising biomarkers for early detection of osteoarthritis due to its sensitivity to cartilage degeneration. Good reliability is essential for these quantitative measures to be widely applicable in clinical trials. We implemented MAPSS T1ρ and T2 imaging on multiple platforms (Siemens, GE, Philips) and evaluated the intra-site repeatability and inter-site reproducibility of T1ρ and T2 data in a multi-site multi-vendor setting.
Purpose
Osteoarthritis (OA) is a degenerative joint disease characterized by deterioration of articular cartilage in the joints. MRI T1ρ and T2 relaxation times have been proposed as potential biomarkers for early detection of cartilage degeneration with excellent in-vivo reliability and validity of discriminating OA from controls, as summarized by a recent systematic review and meta-analysis.1 However, few studies examined their reliability in a multi-site multi-vendor setting,2 which is critical for future large-scale trials and clinical translation of such quantitative measures. Therefore, the purpose of this study was to evaluate the intra-site repeatability and inter-site reproducibility of knee cartilage T1ρ and T2 data acquired by multiple sites and multiple vendors in phantoms and human subjects.Methods
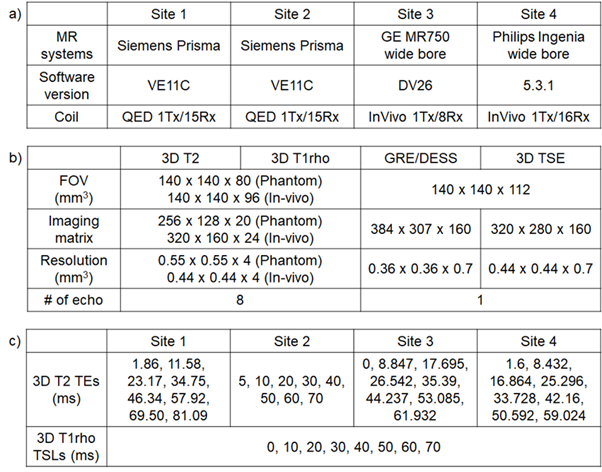
Four 3T MR systems from four different sites and three vendors (Siemens, GE, and Philips) with dedicated knee coils were used for this study (Table 1a). Multiple measures were collected using the agarose gel phantoms (2%, 3%, 4%, manufactured by the Phantom Lab) while varying coil position horizontally (center, left 60 mm, right 60 mm). In addition, five subjects were scanned with same day rescan at each site, including two traveling volunteers whose knees were scanned at all four sites. 3D T1ρ and T2 imaging based on magnetization-prepared angle-modulated partitioned k-space spoiled gradient echo snapshots (MAPSS) with RF cycling and variable flip angles3 were implemented on all three platforms and used at three sites. One site (Site 2) used 3D T1ρ and T2 imaging based on segmented gradient echo acquisition with constant flip angles.4 The imaging protocol included 3D T1ρ and T2 imaging, high-resolution gradient echo (GRE) imaging or dual echo steady state (DESS), and 3D turbo spin echo imaging (Table 1b). Data were transferred to one site for centralized data post-processing using in-house developed software. For all relaxation time fitting, two-parameter mono-exponential fittings were performed. The echo times or spin lock times used for fitting are listed in Table 1c. Cartilage was segmented semi-automatically into six compartments (medial/lateral femur [MFC/LFC], medial/lateral tibia [MT/LT, trochlea [TRO], and patellar [PAT]) using high-resolution DESS/GRE images, and the segmentation was overlaid on T1ρ and T2 maps after registration to calculate means and standard deviations of T1ρ and T2 values in each compartment. Coefficients of variation (CVs) were calculated for scan/rescan repeatability at each site in the phantoms and the volunteers, and for inter-site reproducibility in the phantoms and traveling volunteers.Results
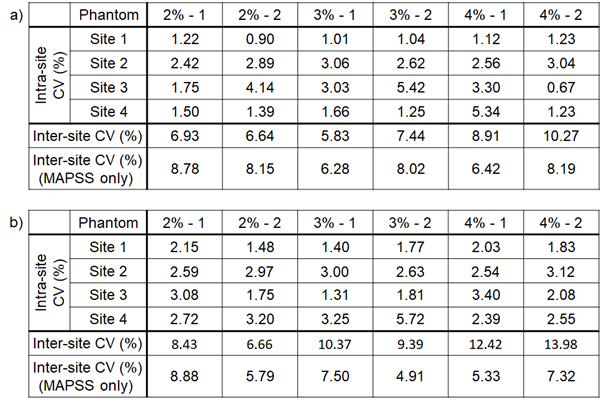
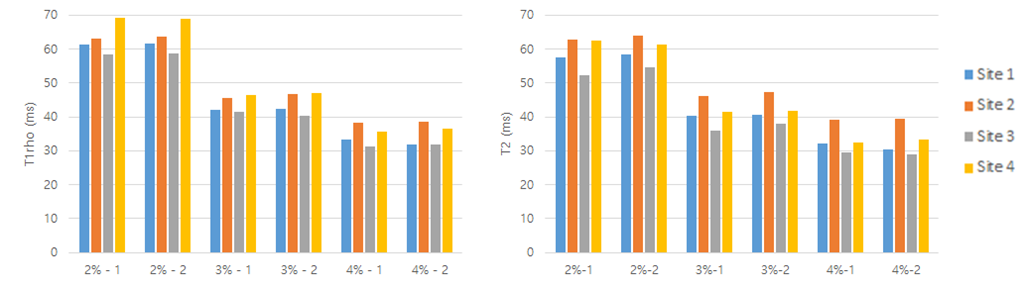
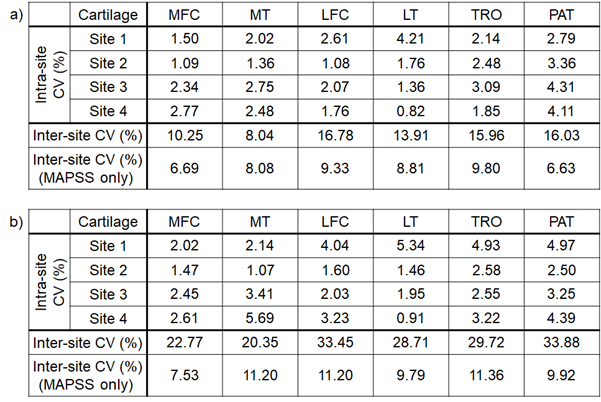
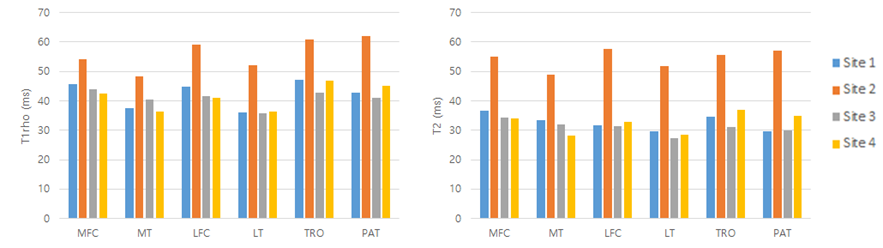
For phantoms, all sites showed excellent intra-site repeatability of T1ρ and T2 values with an average CV of 2.24% for T1ρ and 2.53% for T2 (Table 2, Fig. 1). The average inter-site CVs were 7.67% and 10.21% for T1ρ and T2 respectively with both sequences included (four sites); and 7.64% and 6.62% for T1ρ and T2 respectively with the MAPSS sequence only (three sites). For human subjects, excellent intra-site repeatability was observed for all sites with an average CV of 2.33% for T1ρ and of 2.91% for T2, Table 3. The average inter-site CVs were 13.50% and 28.15% for T1ρ and T2 respectively with both sequences included (four sites); and 8.2% and 10.17% for T1ρ and T2 respectively with MAPSS sequences only (three sites). Fig. 2 shows the T1ρ and T2 values of each cartilage compartment for the traveling volunteers.Discussion
In this work, we implemented MAPSS T1ρ and T2 imaging sequences on three vendors and considerable care was devoted to standardizing the sequence structures and acquisition parameters. The intra-site repeatability of T1ρ and T2 was excellent for all sites and vendors in both phantom and in-vivo measurements. These results are comparable to that in the meta-analysis conducted by MacKay et al.1 For inter-site inter-vendor reproducibility, CVs were higher when we included both sequences (MAPSS and segmented GRE with constant flip angle) due to different readout schemes (MAPSS uses variable flip angle and RF cycling) and different T2 preparation schemes (MAPSS utilizes MLEV scheme with composite inversion pulses, whereas segmented GRE used single inversion pulse for all echo times). With the data collected using MAPSS sequences only from three vendors and three sites, the reduced inter-site CVs were comparable to those in multi-site single-vendor studies reported previously5-7 even with the introduction of different vendors.Conclusion
Cartilage T1ρ and T2 imaging, after standardization of data acquisition and post-processing, demonstrates excellent intra-site repeatability, and inter-site reproducibility, suggesting great promise that T1ρ and T2 may serve as reliable imaging biomarkers for future multi-site multi-vendor studies. Factors that could introduce variations in T1ρ and T2 values such as temperature, B0 and B1 inhomogeneity will be investigated further in future studies.Acknowledgements
The study was supported by the Arthritis Foundation Osteoarthritis Center of Excellence Demonstration Project Award #567857.References
1. MacKay JW, Low SB, Smith TO, et al. Systematic review and meta-analysis of the reliability and discriminative validity of cartilage compositional MRI in knee osteoarthritis. Osteoarthritis and cartilage 2018; 26: 1140-1152.
2. Mosher TJ, Zhang Z, Reddy R, Boudhar S, Milestone BN, Morrison WB, Kwoh CK, Eckstein F, Witschey WR, Borthakur A. Knee articular cartilage damage in osteoarthritis: analysis of MR image biomarker reproducibility in ACRIN-PA 4001 multicenter trial. Radiology. 2011;258(3):832-42.
3. Li X, Han ET, Busse RF, Majumdar S. In vivo T1ρ mapping in cartilage using 3D magnetization‐prepared angle‐modulated partitioned k‐space spoiled gradient echo snapshots (3D MAPSS). Magn Reson Med 2008; 59(2): 298-307.
4. Saxena V, D’Aquilla K, Marcoon S, et al. T1ρ magnetic resonance imaging to assess cartilage damage after primary shoulder dislocation. The American journal of sports medicine. 2016; 44(11): 2800-2806.
5. Li X, Pedoia V, Kumar D, Rivoire J, Wyatt C, Lansdown D, et al. Cartilage T1rho and T2 relaxation times: longitudinal reproducibility and variations using different coils, MR systems and sites. Osteoarthritis Cartilage. 2015; 23(12): 2214-2223.
6. Schneider E, NessAiver M, White D, Purdy D, Martin L, Fanella L, et al. The osteoarthritis initiative (OAI) magnetic resonance imaging quality assurance methods and results. Osteoarthritis Cartilage. 2008; 16(9): 994-1004.
7. Young K, Kogan F, Peters R, Koff M, Pedoia V, Safran M, et al. Advanced Knee Imaging Study in NCAA Division 1 Basketball: Protocol Development and Preliminary Results. Paris, France: ISMRM; 2018.
Figures