0126
Quantitative multiparametric mapping assessment of the rat brain through adolescence into adulthood1Wolfson Brain Imaging Centre, University of Cambridge, Cambridge, United Kingdom, 2Physiology, Development and Neuroscience, University of Cambridge, Cambridge, United Kingdom, 3University of Cambridge, Cambridge, United Kingdom
Synopsis
We demonstrate high-resolution quantitative multiparametric mapping in the rat: scanning animals before and after adolescence and comparing them to the adult. We produce maps sensitive to myelin signal throughout the brain that complement volumetric information normally used in developmental studies. The aim is to better exploit models of neuropsychiatric disorders, particularly those with developmental components.
Introduction
Animal models are crucial to studying the developmental aspects of neuropsychiatric disorders, both for understanding their causes and assessing potential therapeutic interventions. Quantitative MRI methods such as multi-parametric mapping (MPM) provide insight into the microstructural environment, adding to the volumetric information obtained from standard structural imaging. Here, we show that MPM is highly effective in the rat brain and use it to scan animals across adolescence and into adulthood to relate changes in magnetisation transfer parameter MTsat (sensitive to differences in myelin), T1 and local volume changes throughout development in 75 distinct cortical and subcortical regions across the brain.Animals and image acquisition
Cohorts of rats were scanned at post-natal day (PND) 21 (n=21), 35 (n=9), 63 (n=9), with a separate cohort of mature adulthood rats for comparison (PND>200, n=7). Rats were anaesthetised with isoflurane (1-2% in 1l/min O2, adjusted to keep respiratory rates in the normal range).
Scans were performed on a Bruker BioSpec 94/20 system at 9.4T using the manufacturer supplied birdcage transmission coil and rat brain receiver coil (4ch array). Multiparametric mapping (MPM) sequences following1 were based on a multi-gradient echo sequence with RF spoiling at 117°. Echoes were obtained from 2.41ms with a spacing of 2.1ms. For the three contrast weightings MT/PD/T1 parameters were: TR=25/25/18ms, FA=6/6/40° and number of echoes 6/8/6. The matrix was 192×160×128 with field of view 30.72×25.60×20.48mm yielding an isotropic spatial resolution of 160µm. For MT images, a single 4ms (BW 685Hz) Gaussian preparation pulse 2kHz off resonance of 10µT was applied. With acceleration of 1.6 achieved by zero-filling in the phase encoding directions, the total scan time for the MPM sequences was 17m 46s.
In addition to the MPM images, B0 and B1 maps were acquired to correct for static and transmission field homogeneities.
Image processing
Processing followed1, 2 to produce maps of T1 and MTsat for each animal. Images were registered using SPM12 with the SPMMouse toolbox3. Unified segmentation was used to prepare grey matter, white matter and cerebrospinal fluid (GM/WM/CSF) maps for non-linear registration with DARTEL.
Templates were thus generated separately at age PND21, 35, 63 and adulthood. The mean images were registered in turn to facilitate comparison between age points. Jacobian determinants were calculated to give maps of local volume change in the same space for each animal at each age. Delineation of brain regions was based on the Paxinos and Watson rat atlas4, with some cortical segmentations obtained from5. The rat GM and WM masks from SPMMouse were used to calculate summary statistics of parameters at each age.
Results and discussion
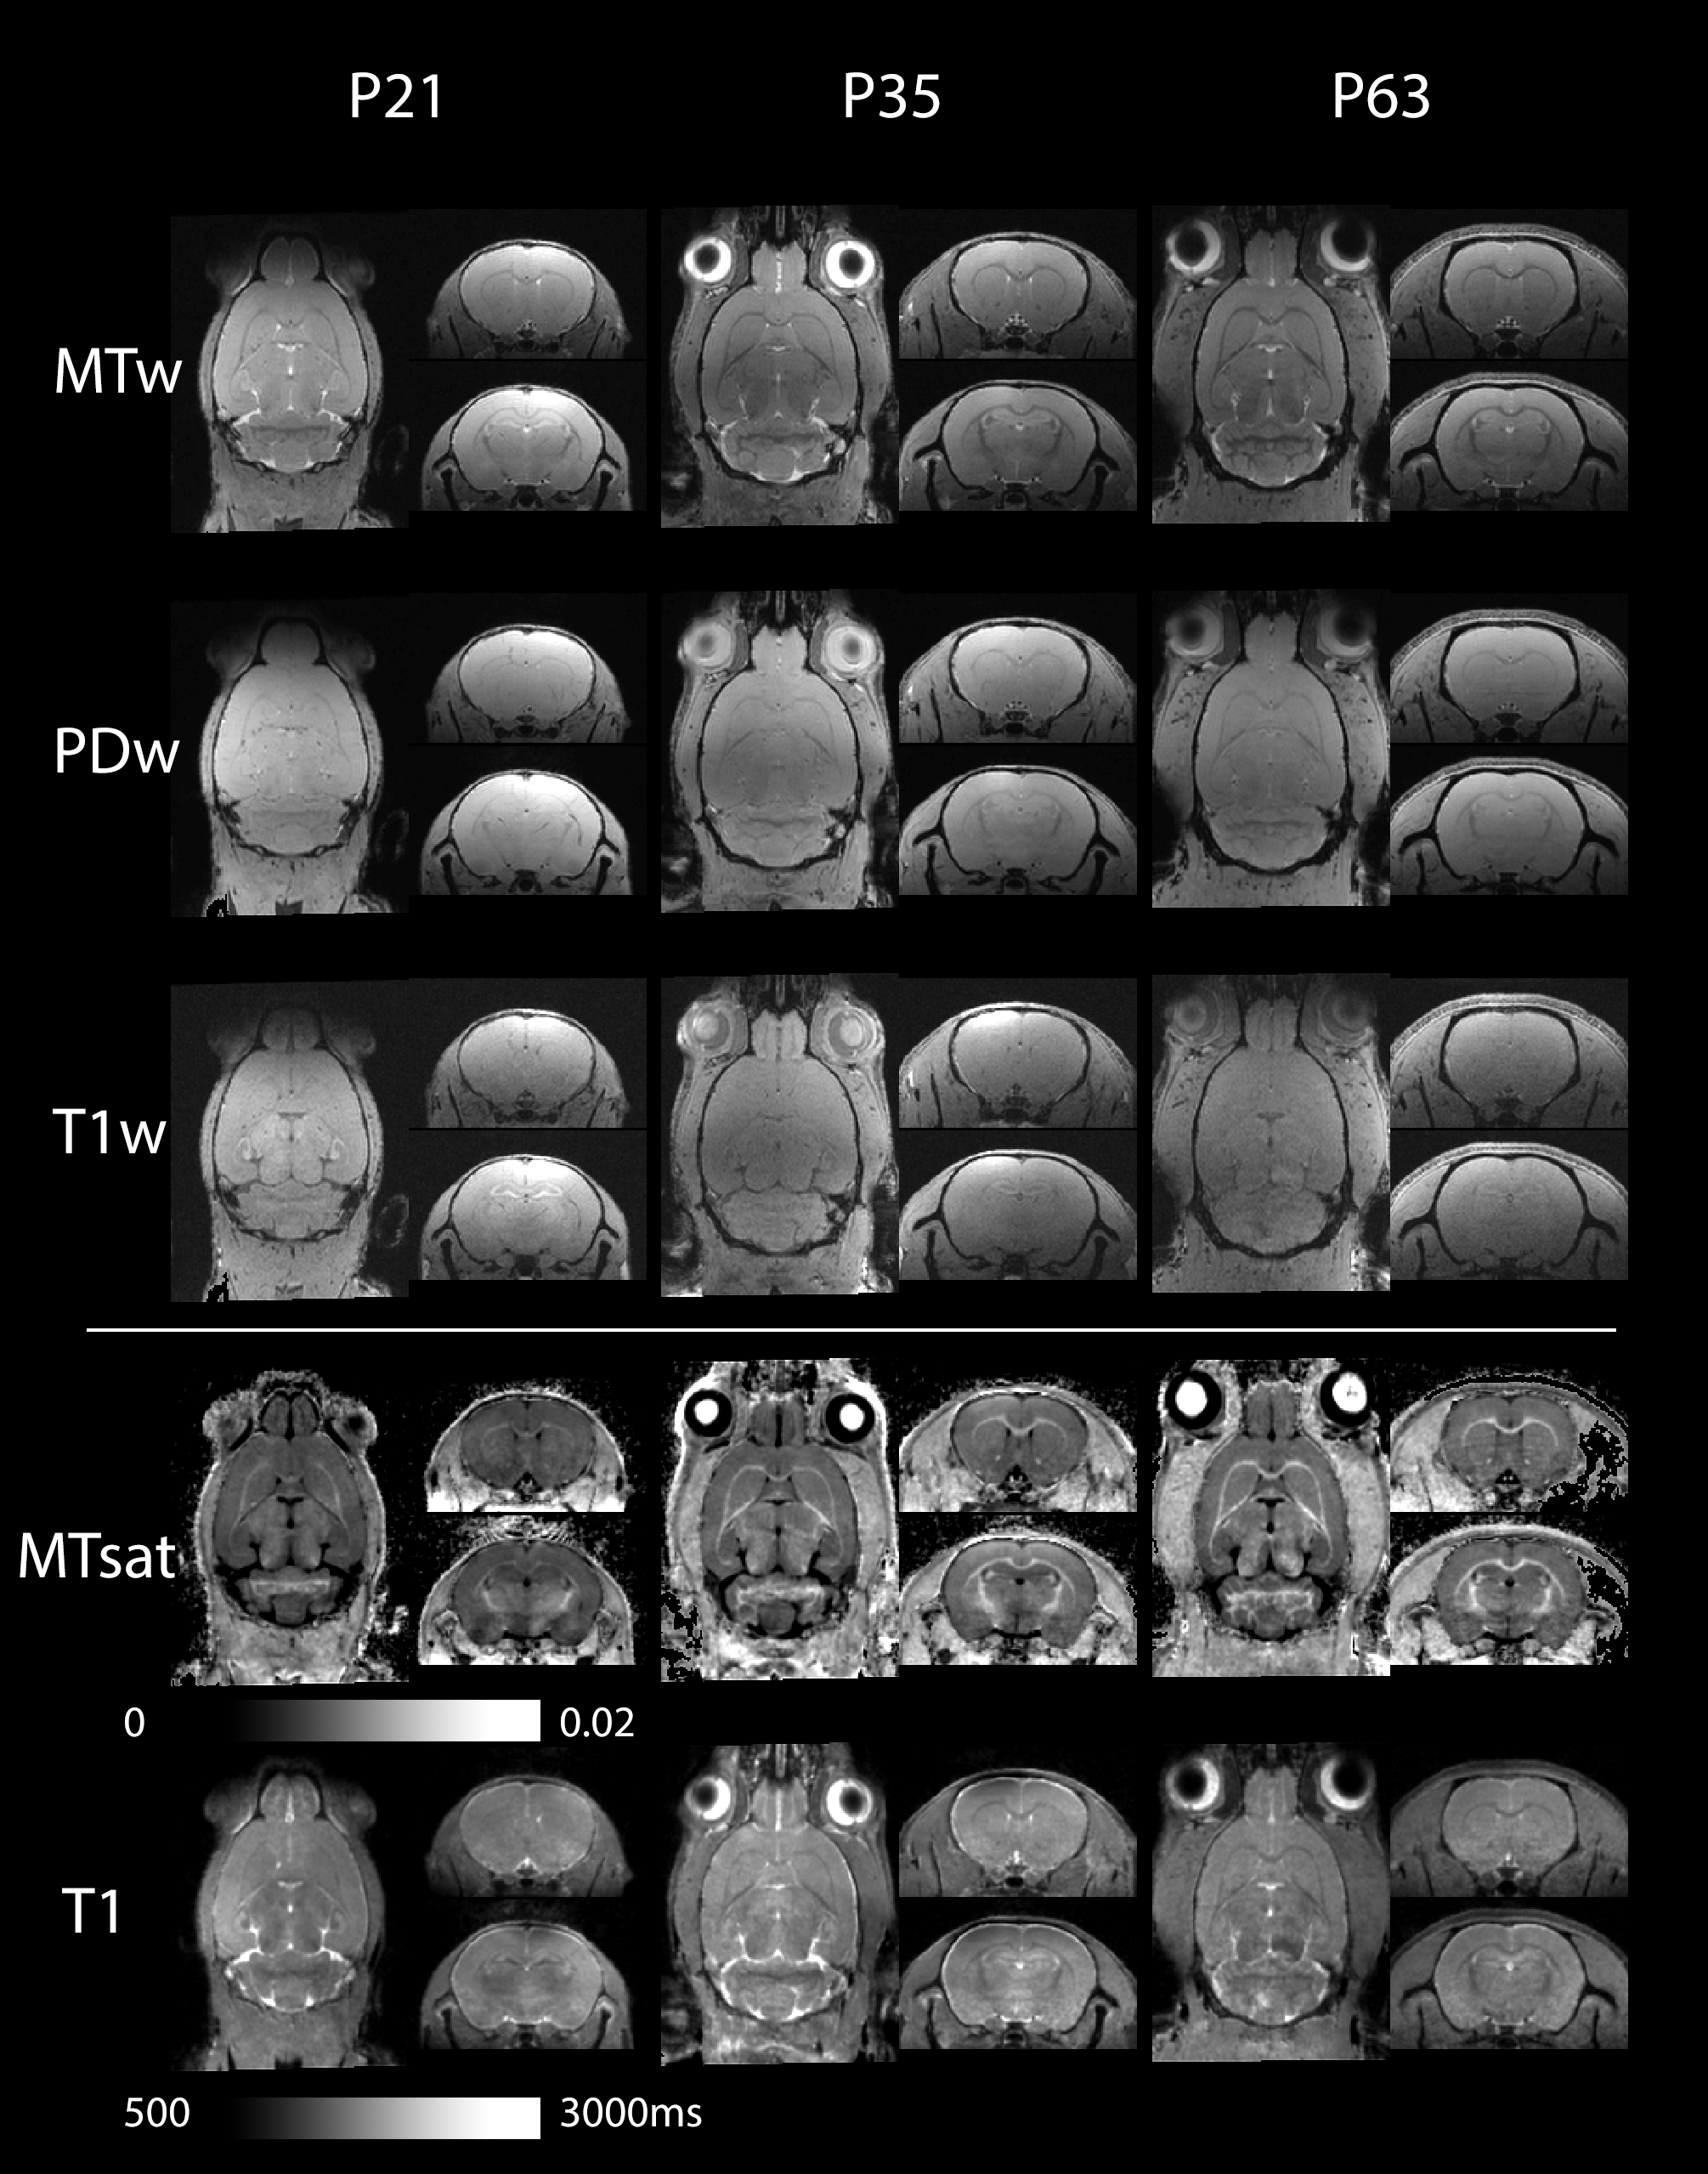
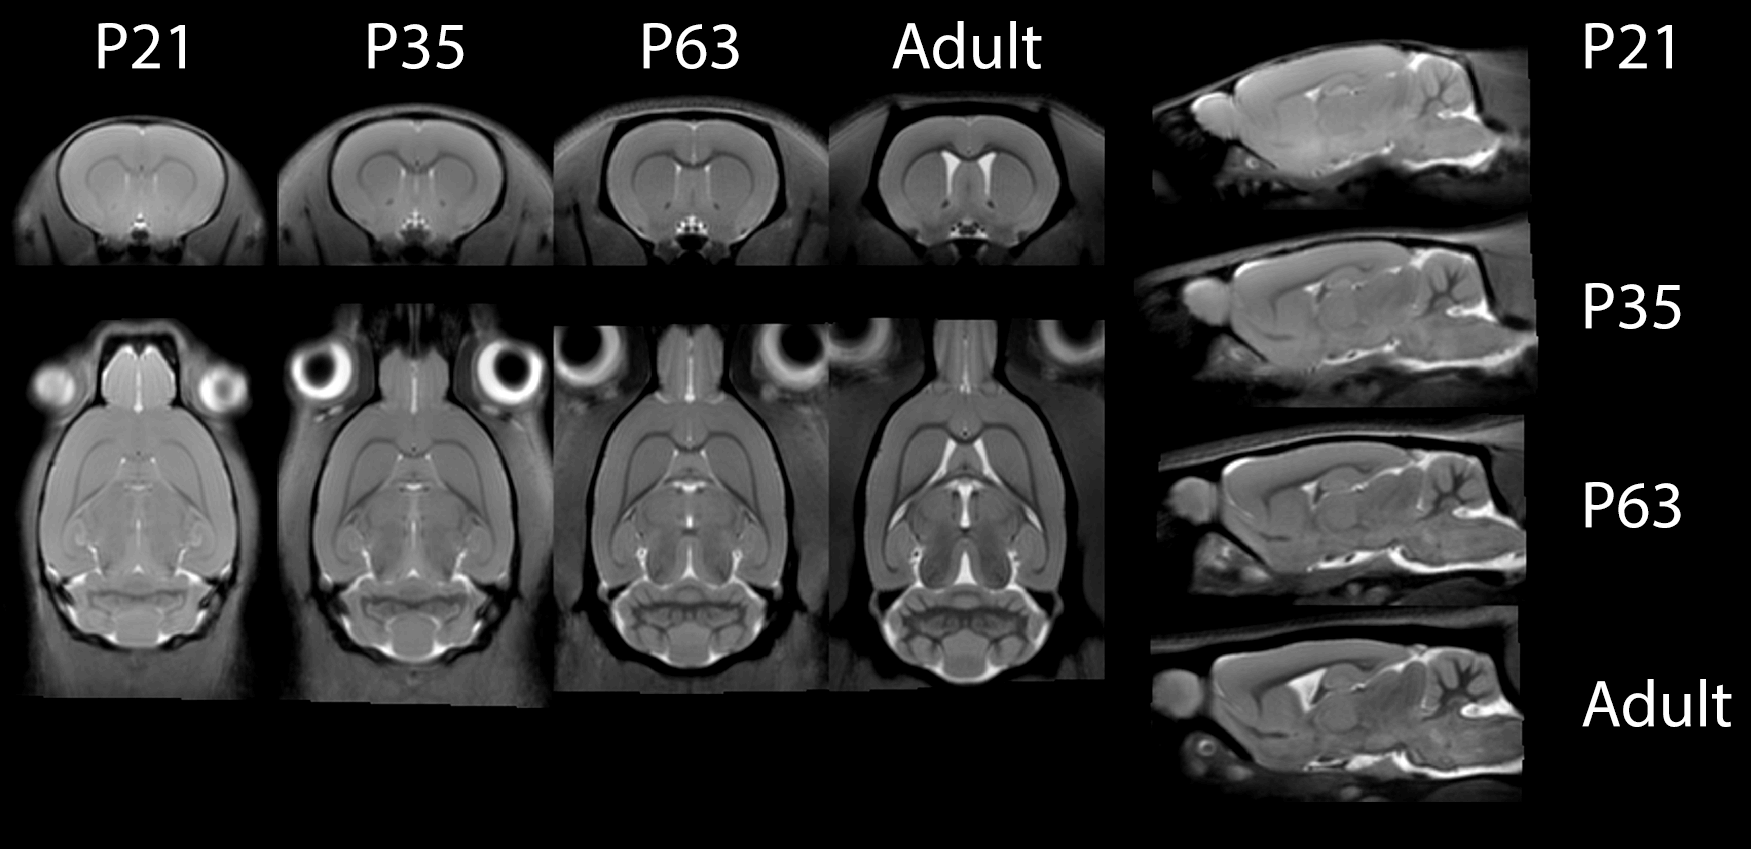
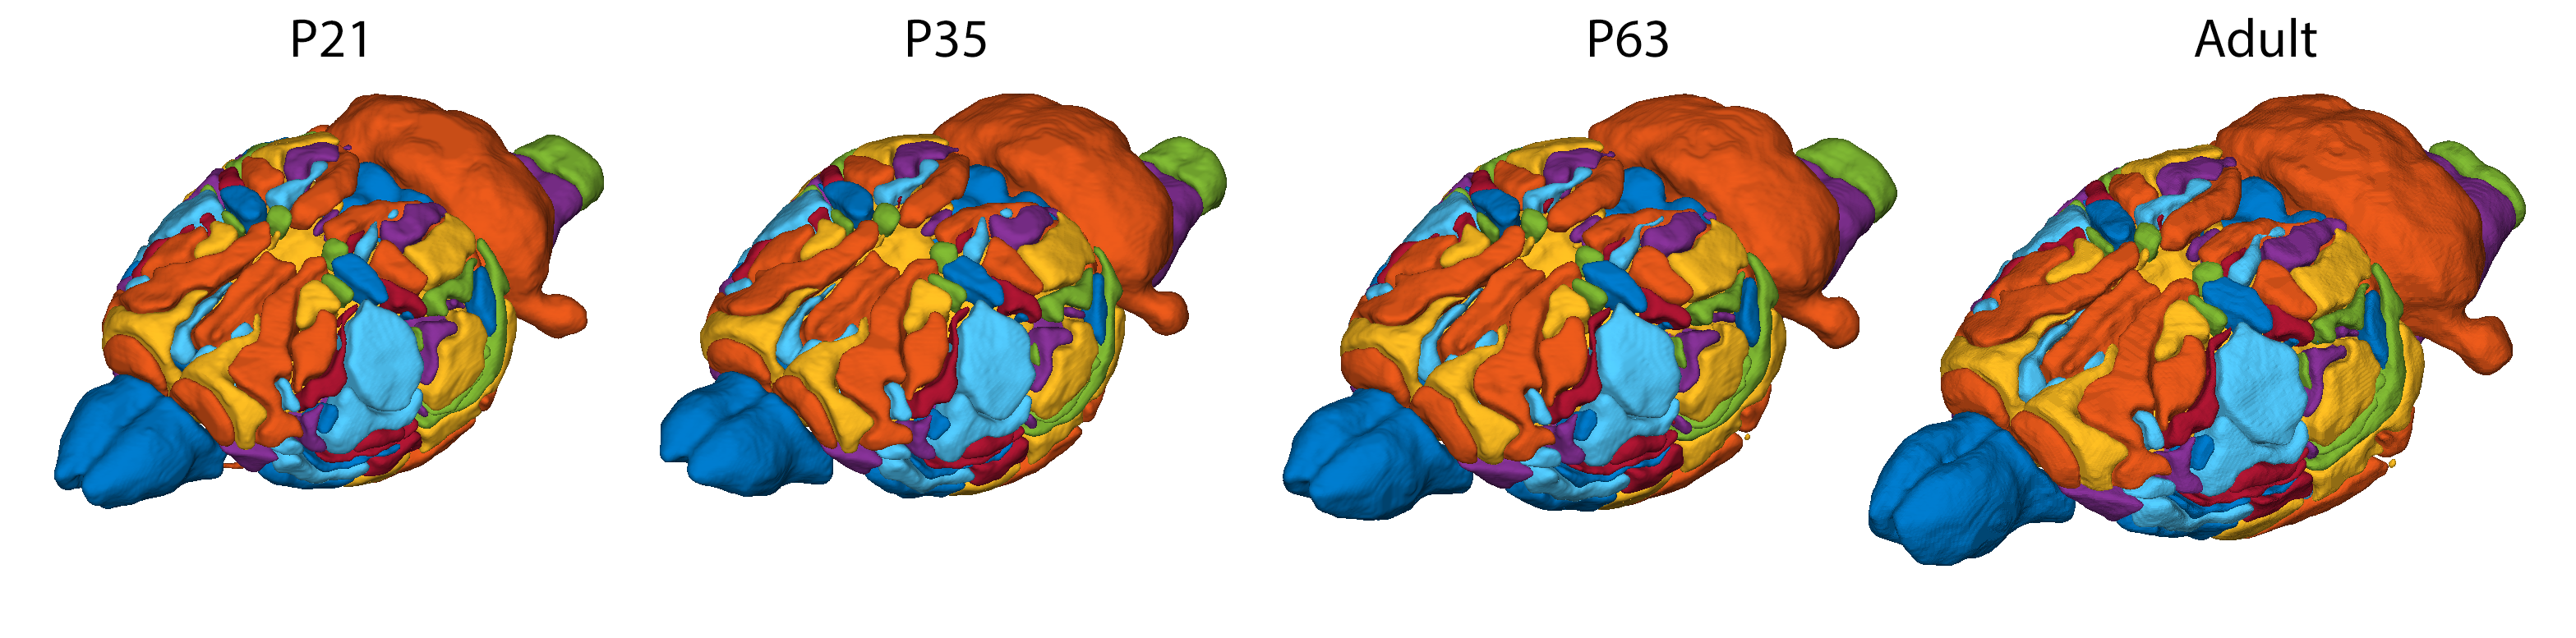
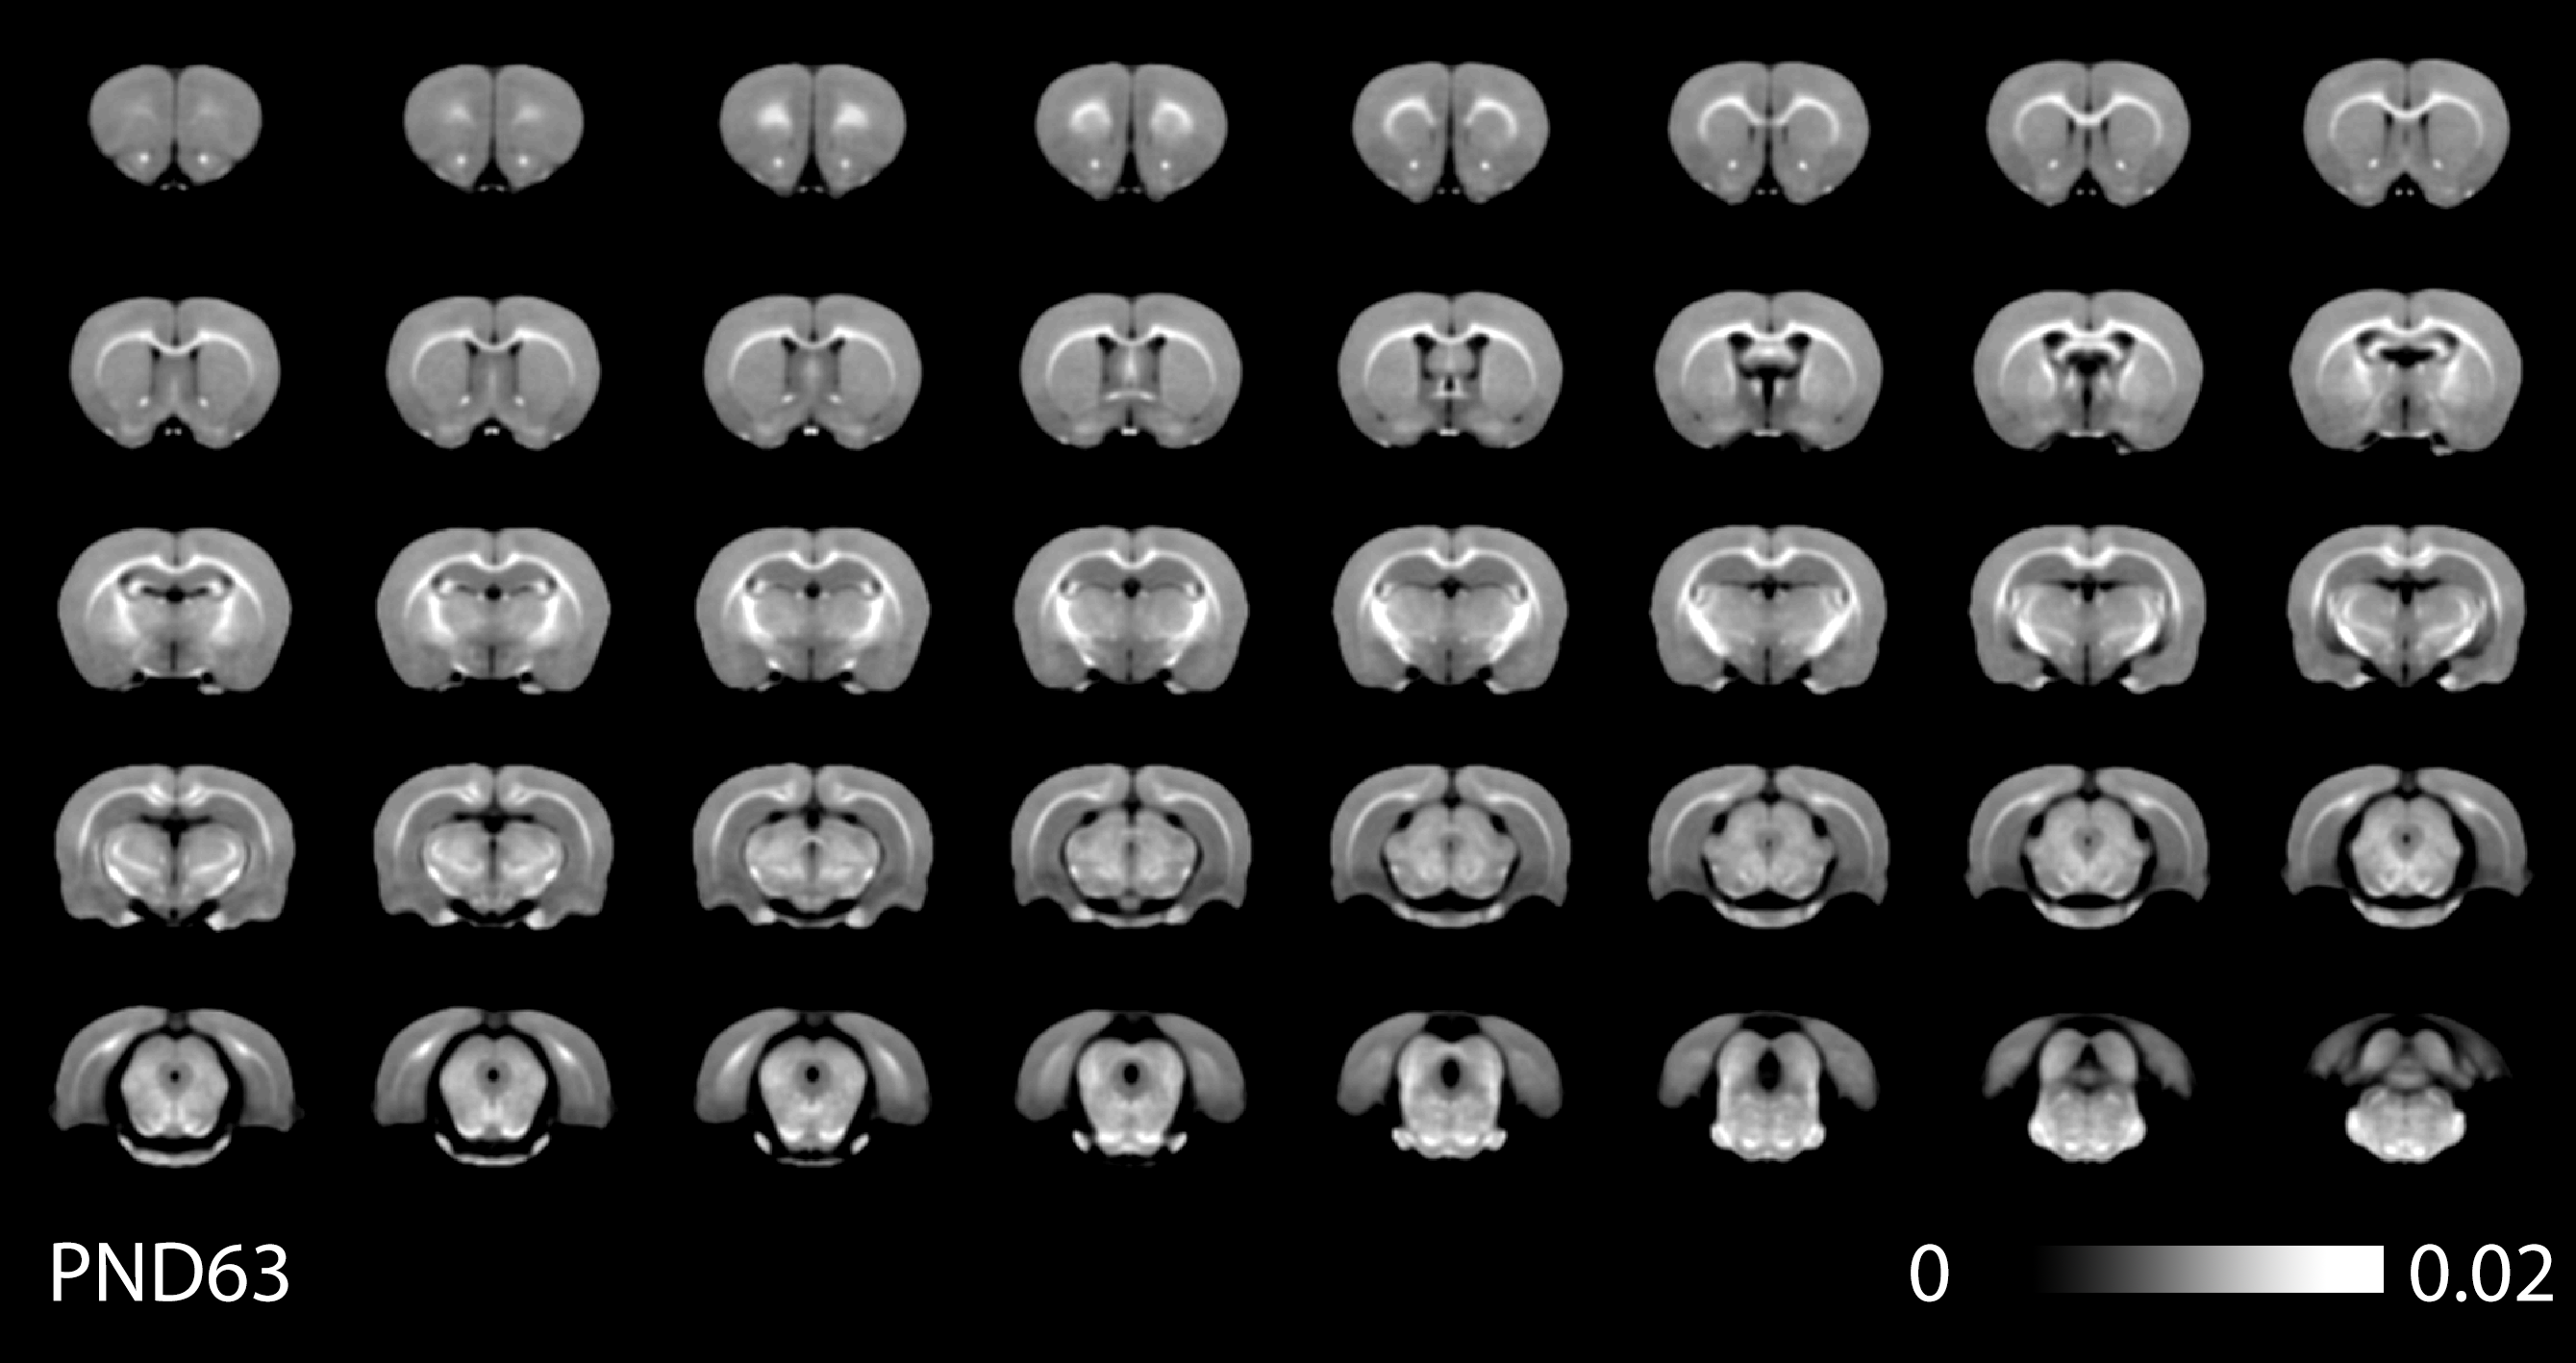
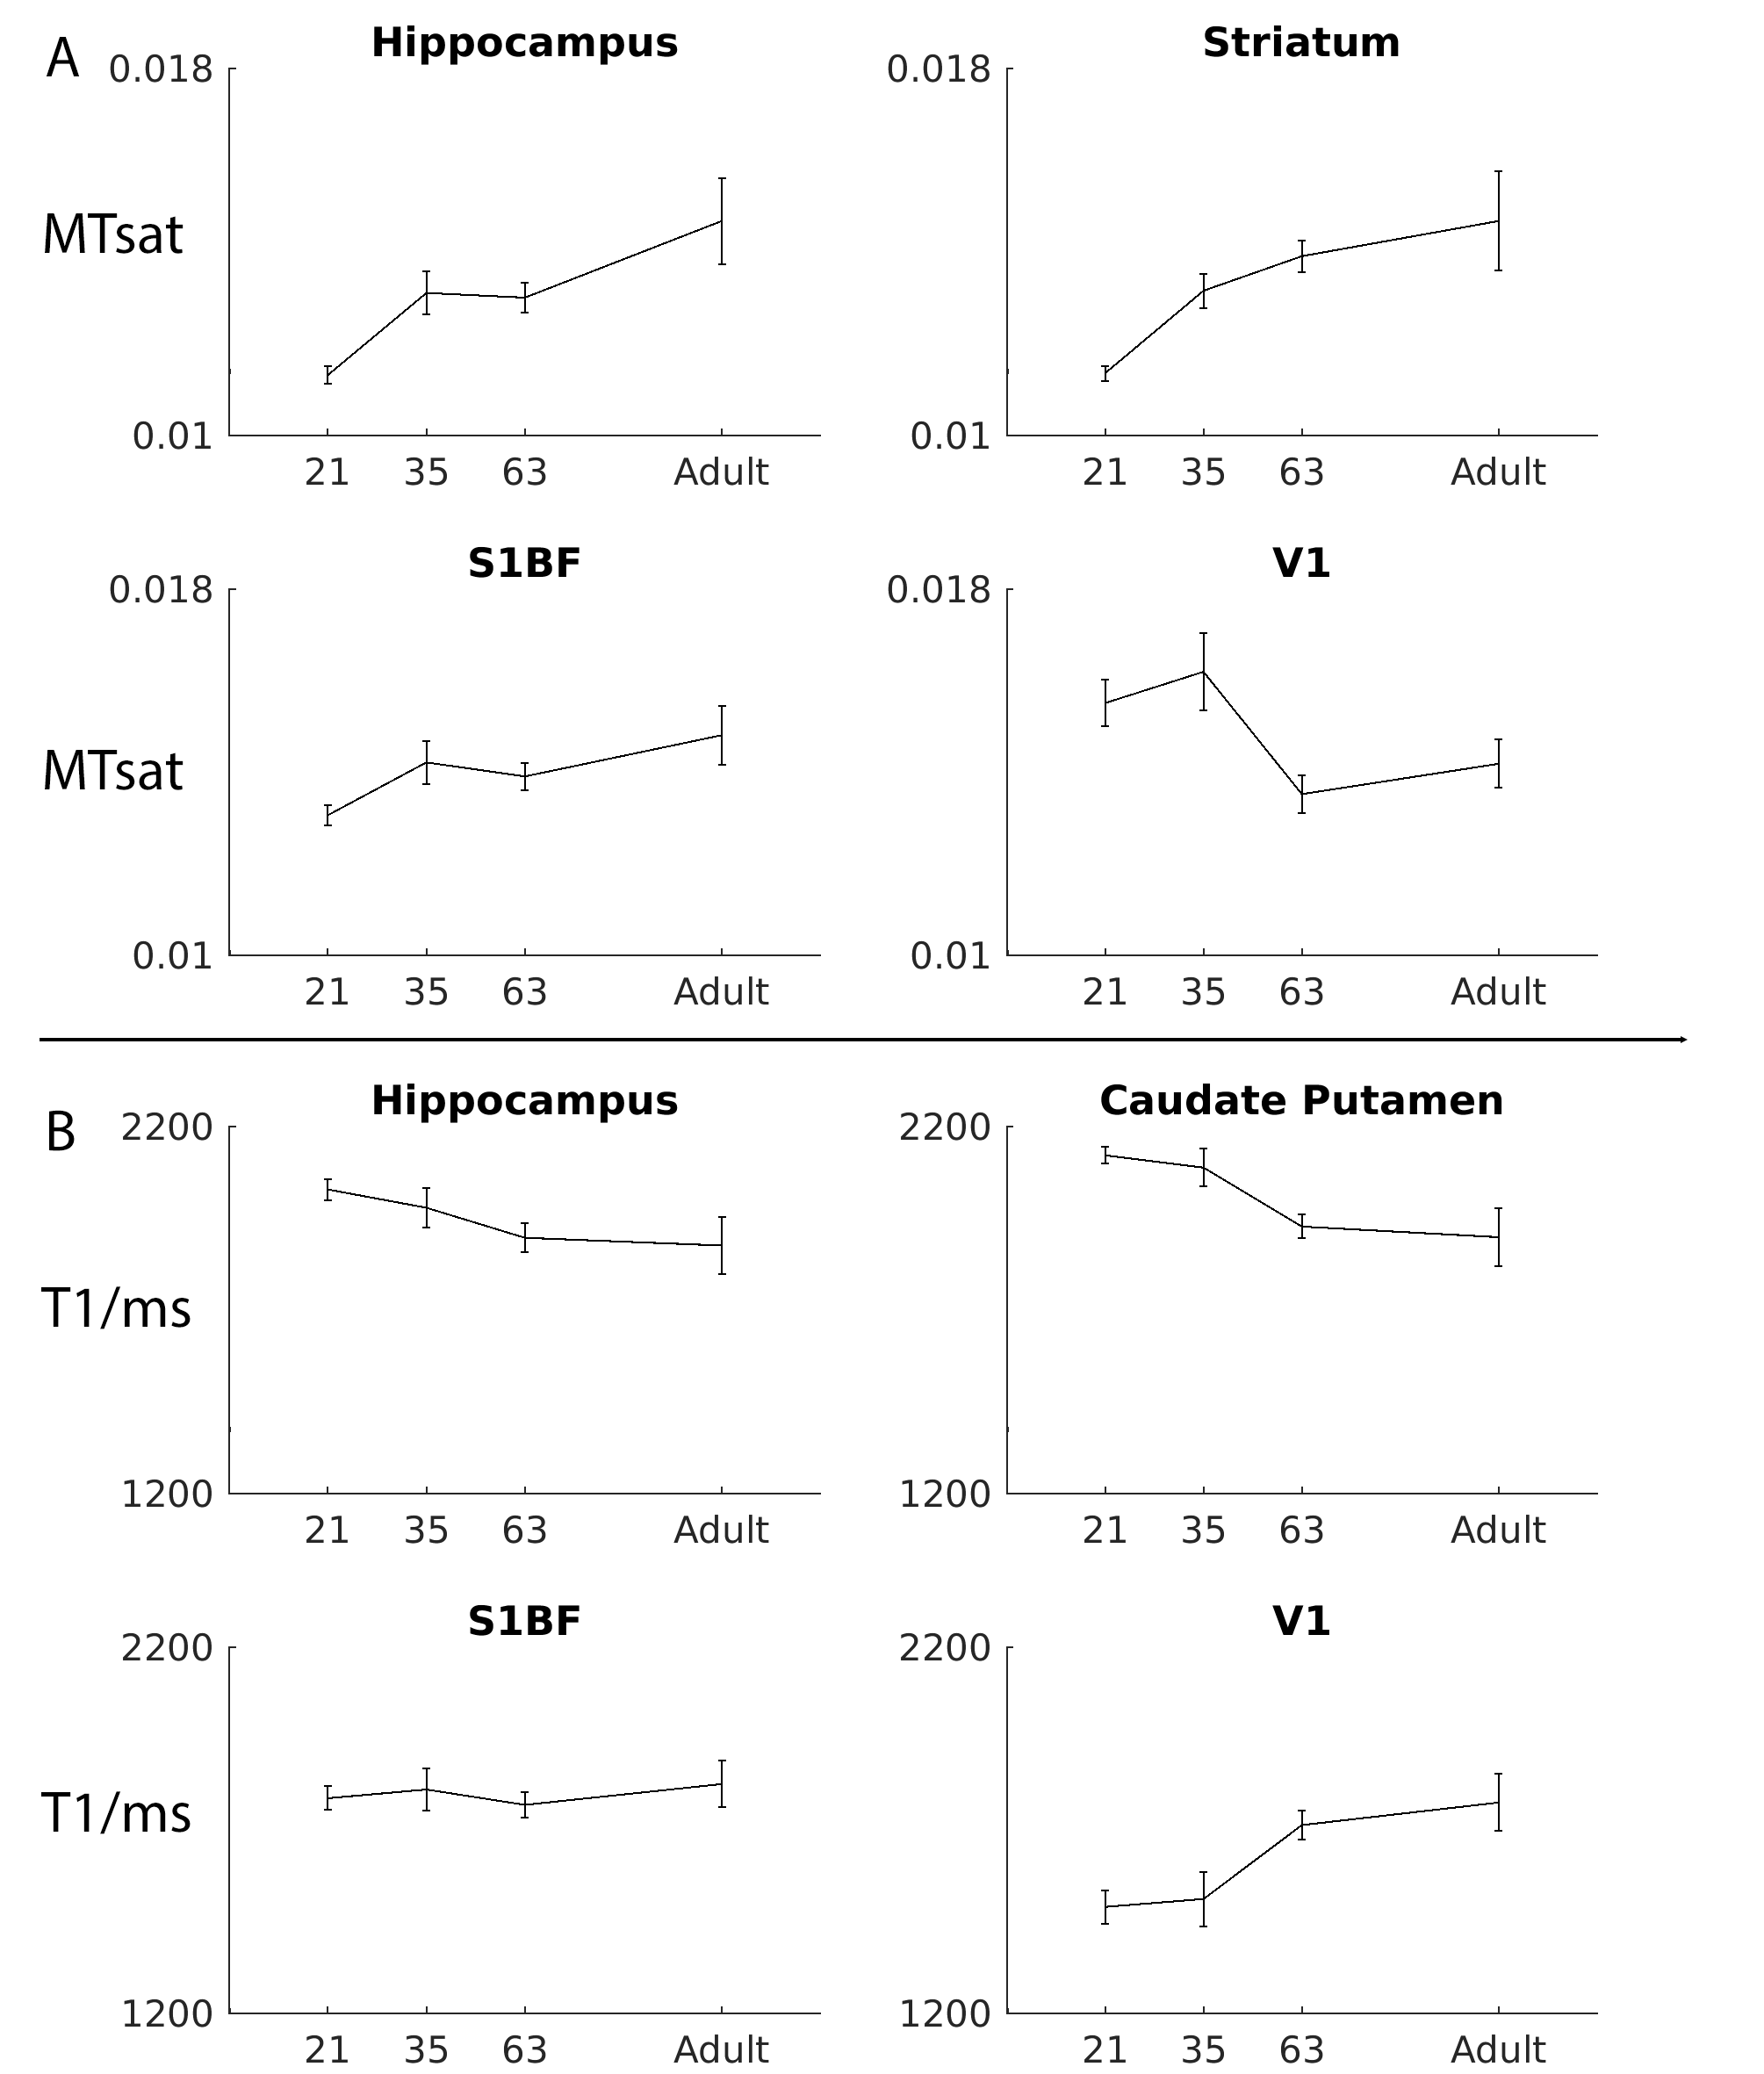
Figure 1 shows typical images at different age points with calculated MTsat and T1 maps, figure 2 shows minimum-deformation templates at each age based on magnetisation transfer weighted images. Figure 3 shows the ROIs at each time point illustrating volume change during this period. Figure 4 shows the MTsat map average for the registered PND63 animals. Quantitative parameters over time for selected regions are shown in Figures 5.
Note that the RF inhomogeneity evident in the raw images of Figure 1 does not affect the quantitative maps. Within both GM and WM, MTsat increases with age (from 0.0115±13% at PND21 to 0.014±14% at adulthood in GM; and 0.013±12% to 0.018±16% in WM). Within CSF, as expected, values are low and do not change over time (0.006±53%).
Consistent with increasing myelin levels, T1 values fell from 2002ms±11% to 1886ms±10% within GM and 1919±8% to 1633±13% within WM over the same age range. The greatest changes occur before PND63, where values become similar to those of mature adults. Detailed WM features are visible in these maps, particularly within heterogeneous structures such as the thalamus and the brainstem. Further work will assess myelin content histologically in the same rats to quantify the extent to which non-myelin contributors to the MTsat signal (e.g. cell membranes etc.) are important.
In sum, we have demonstrated that quantitative multiparametric mapping is a successful approach in the rat. Furthermore, the high-resolution maps presented here allow the assessment of myelin development within distinct cortical layers, which in humans continues to change well into adolescence6 and is emerging as a key area to find abnormalities that may lie behind symptoms associated with neuropsychiatric disorders.
Acknowledgements
Funding source: MRC.References
1. Weiskopf, N., et al., Quantitative multi-parameter mapping of R1, PD(*), MT, and R2(*) at 3T: a multi-center validation. Front Neurosci, 2013. 7: p. 95.
2. Helms, G., et al., High-resolution maps of magnetization transfer with inherent correction for RF inhomogeneity and T1 relaxation obtained from 3D FLASH MRI. Magn Reson Med, 2008. 60(6): p. 1396-407.
3. Sawiak, S.J., et al., Voxel-based morphometry in the R6/2 transgenic mouse reveals differences between genotypes not seen with manual 2D morphometry. Neurobiol Dis, 2009. 33(1): p. 20-7.
4. Paxinos, G. and C. Watson, The rat brain in stereotaxic coordinates. Compact 6th ed. ed. 2009, London: Academic.
5. Valdes-Hernandez, P.A., et al., An in vivo MRI Template Set for Morphometry, Tissue Segmentation, and fMRI Localization in Rats. Front Neuroinform, 2011. 5: p. 26.
6. Whitaker, K.J., et al., Adolescence is associated with genomically patterned consolidation of the hubs of the human brain connectome. Proc Natl Acad Sci U S A, 2016. 113(32): p. 9105-10.
Figures