0125
Effects of myelin on the water resonance line-shape in postmortem mouse brain1Department of Radiology, University of Chicago, Chicago, IL, United States, 2Department of Neurology, University of Chicago, Chicago, IL, United States, 3Department of Radiology, Harvard Medical School, Boston, MA, United States, 4Gordon Center for Medical Imaging, Massachusetts General Hospital, Boston, MA, United States, 5Department of Neurobiology, University of Chicago, Chicago, IL, United States
Synopsis
Dysmyelinating diseases are characterized by abnormal myelin formation and function. Such microstructural abnormalities in myelin have been demonstrated to produce measurable effects on the MR signal. This work examines these effects from post-mortem fixed control and shiverer mouse brains on voxel-wise, high-resolution water spectra acquired using a multi-gradient echo pulse sequence. Results demonstrate that components of the spectra are differentially affected by myelin concentration. This suggests that water proton spectra may be sensitive to the tissue microenvironment, specifically myelin, and could serve as potential MRI based biomarkers of dysmyelinating diseases.
Introduction
Dysmyelinating diseases are characterized by abnormal myelin formation and function1. While structural myelin abnormalities occur at a scale much smaller than that of typical imaging resolutions used in MRI, their effects on the measured MR signal have been reported both clinically2 and in animal models3. Here, multi-gradient echo (MGE) data were acquired, producing voxel-wise, high spectral resolution water spectra from post-mortem fixed control and shiverer mouse brain. Shiverer mice exhibit dysmyelination due to a deficiency of myelin and myelin basic protein in the central nervous system. As such, axons in the central nervous system are grossly myelin deficient4. Asymmetry of the voxel-wise water proton spectra was quantified to investigate whether differences in myelination produces measureable changes in the water resonance line shape.Methods
Resected mouse brains from control (n=2) and shiverer (n=3) mice were imaged at 9.4 Tesla using a 20cm horizontal bore scanner (Bruker Biospin). DTI data were acquired with 125μm isotropic resolution over 30 isotropically distributed directions using a diffusion-weighted 3D spin-echo sequence. 3D-MGE data were acquired with 100μm isotropic resolution, 1.9Hz spectral resolution, from 192 oscillating echoes.
Data were processed and analyzed with IDL, Matlab, and FSL (FMRIB, Oxford, UK).
3D-MGE data were Fourier transformed across all dimensions and phased to produce pure absorption spectra5. Voxel-wise spectral asymmetry was computed by subtracting the integral of the high-field half of the spectrum (out to 30Hz, relative to the main water peak) from the integral of the low-field half of the spectrum, and normalizing by the total area under the curve. Water peak height (PH) images were constructed, where image contrast was produced by the maximum voxel-wise signal intensity of the water spectrum. Mean b=0s/mm2datasets were produced from the DTI data and registered to the respective PH image via affine transformation using FLIRT.
Fractional anisotropy (FA) was computed using DTIFIT and thresholded to produce pseudo-grey/white matter masks. FA threshold values ranged from FA < 0.3 (high grey matter/low white matter volume fraction) to FA≥0.6 (low grey matter/high white matter volume fraction). Intermediate FA ranges (0.3 ≤FA<0.45 and 0.45≤FA<0.6) are suggestive of mixed grey/white tissue types and crossing fibers.
Anatomical white and grey matter masks were manually segmented from respective PH images and used to compute tract dependent grey/white contrast-to-noise ratio (CNR).
Results
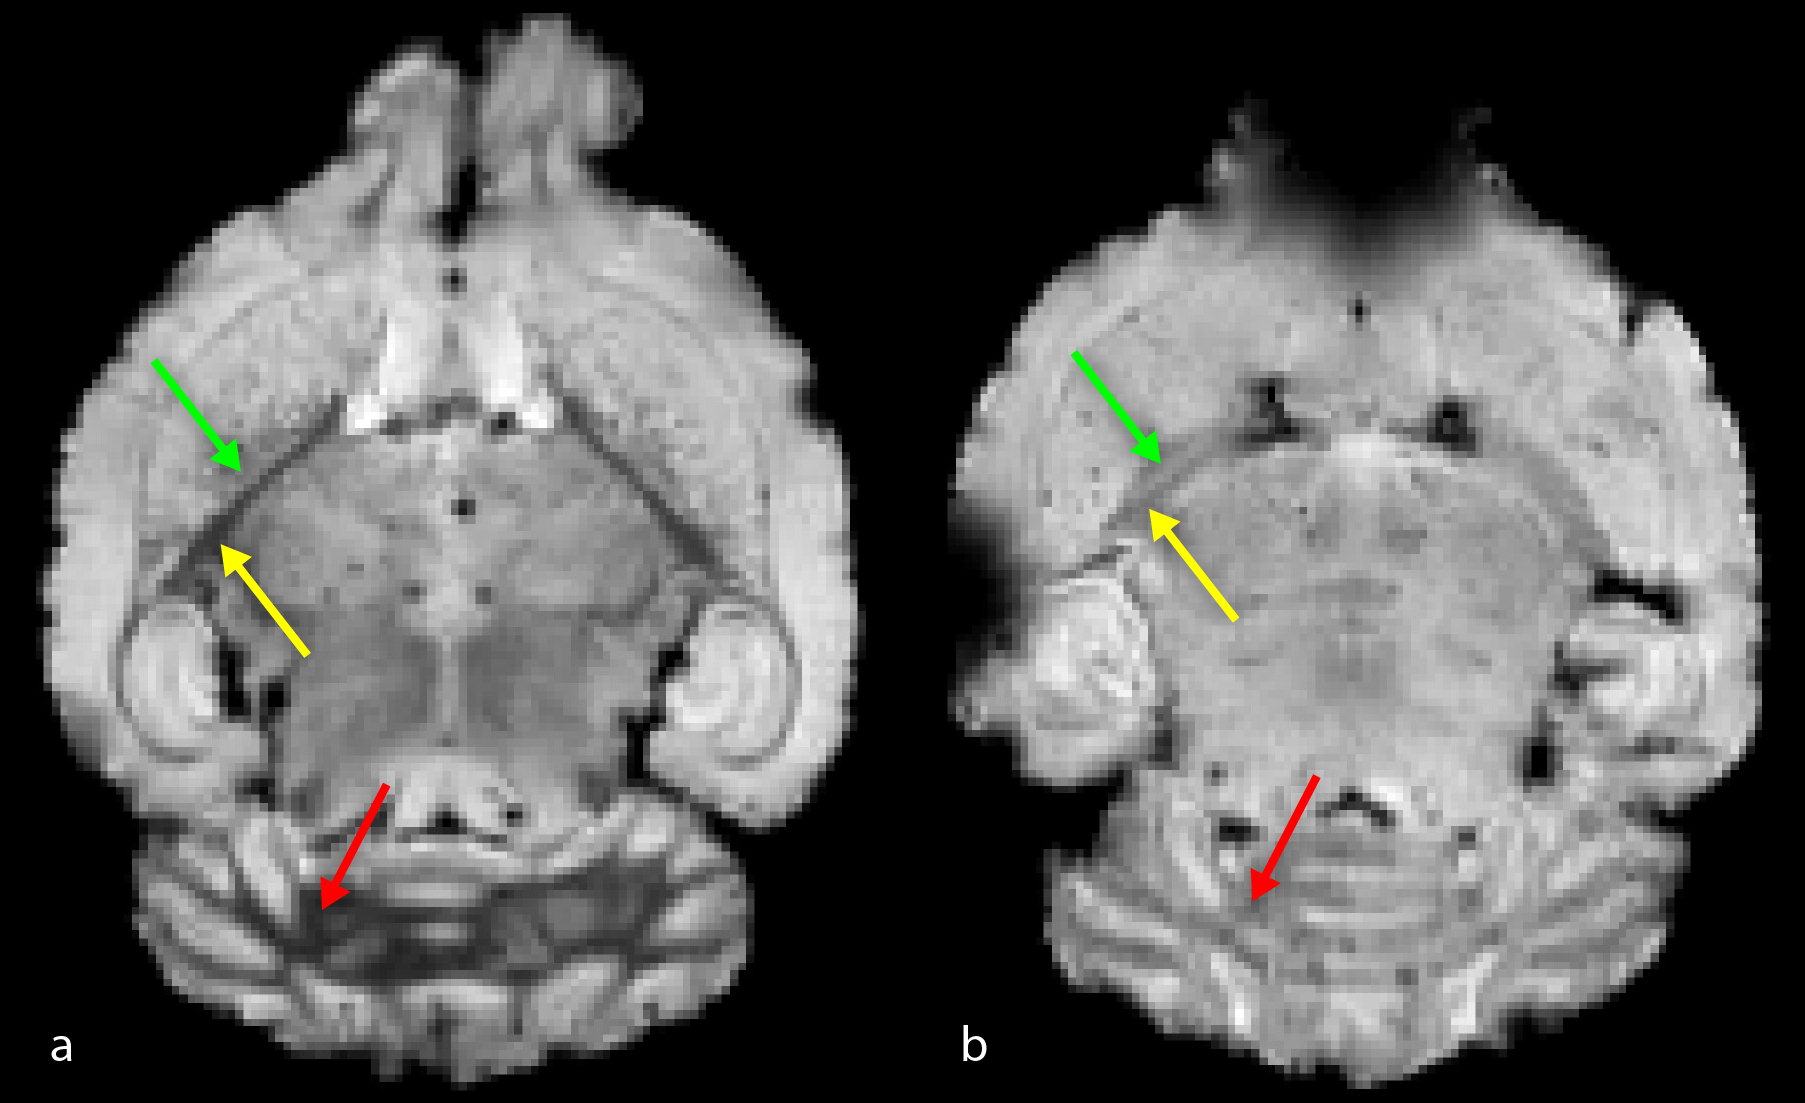
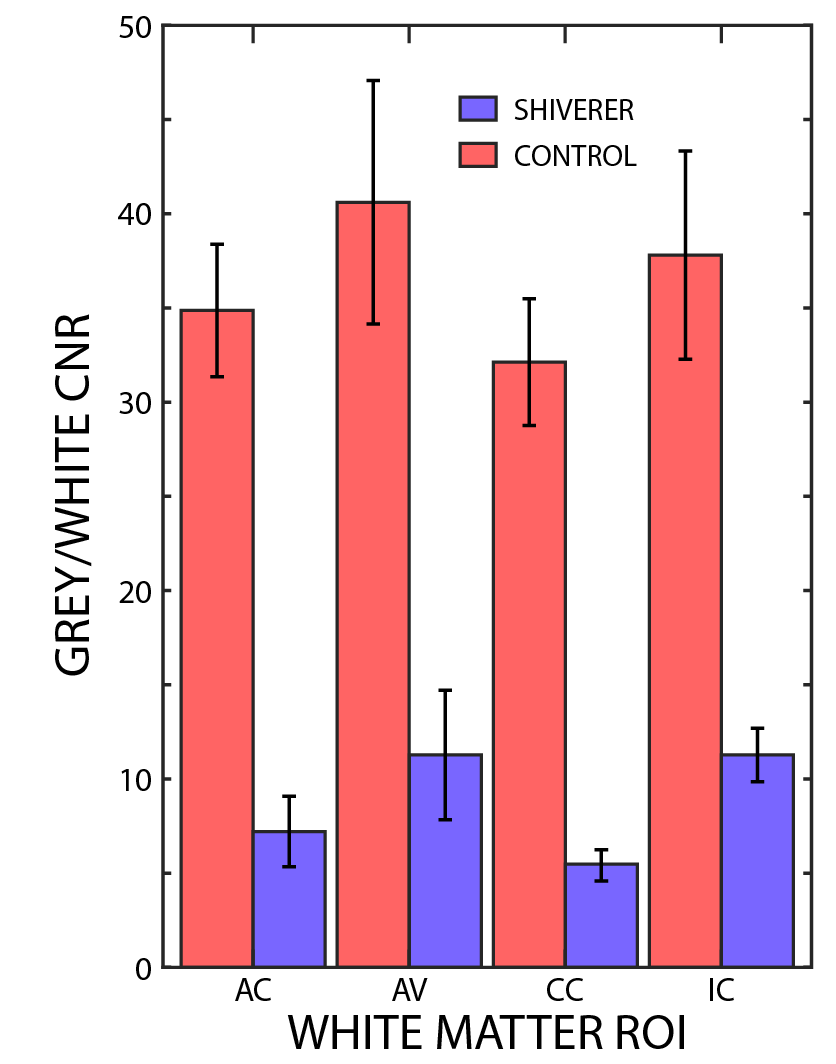
Typical axial PH images of linearly registered control and shiverer mouse brains are shown in figure 1. Grey/white matter contrast is clearly greater in the control than in the shiverer mouse. Grey/white CNR was computed for 4 different white matter tracts, including the anterior commissure (AC), the arbor vitae of the cerebellum (AV), the corpus callosum (CC), and the internal capsule (IC). CNRs from all tracts were larger in the controls than in the shiverer mice (p<0.1, one-way Student’s t-test, figure 2).
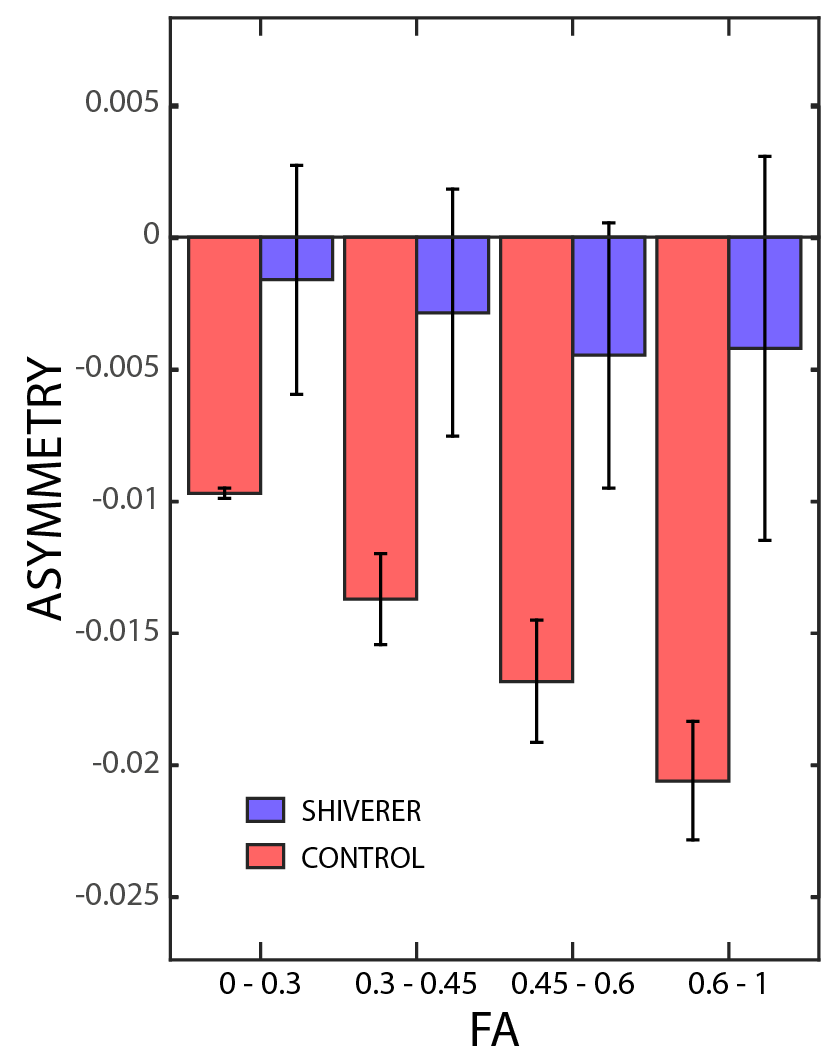
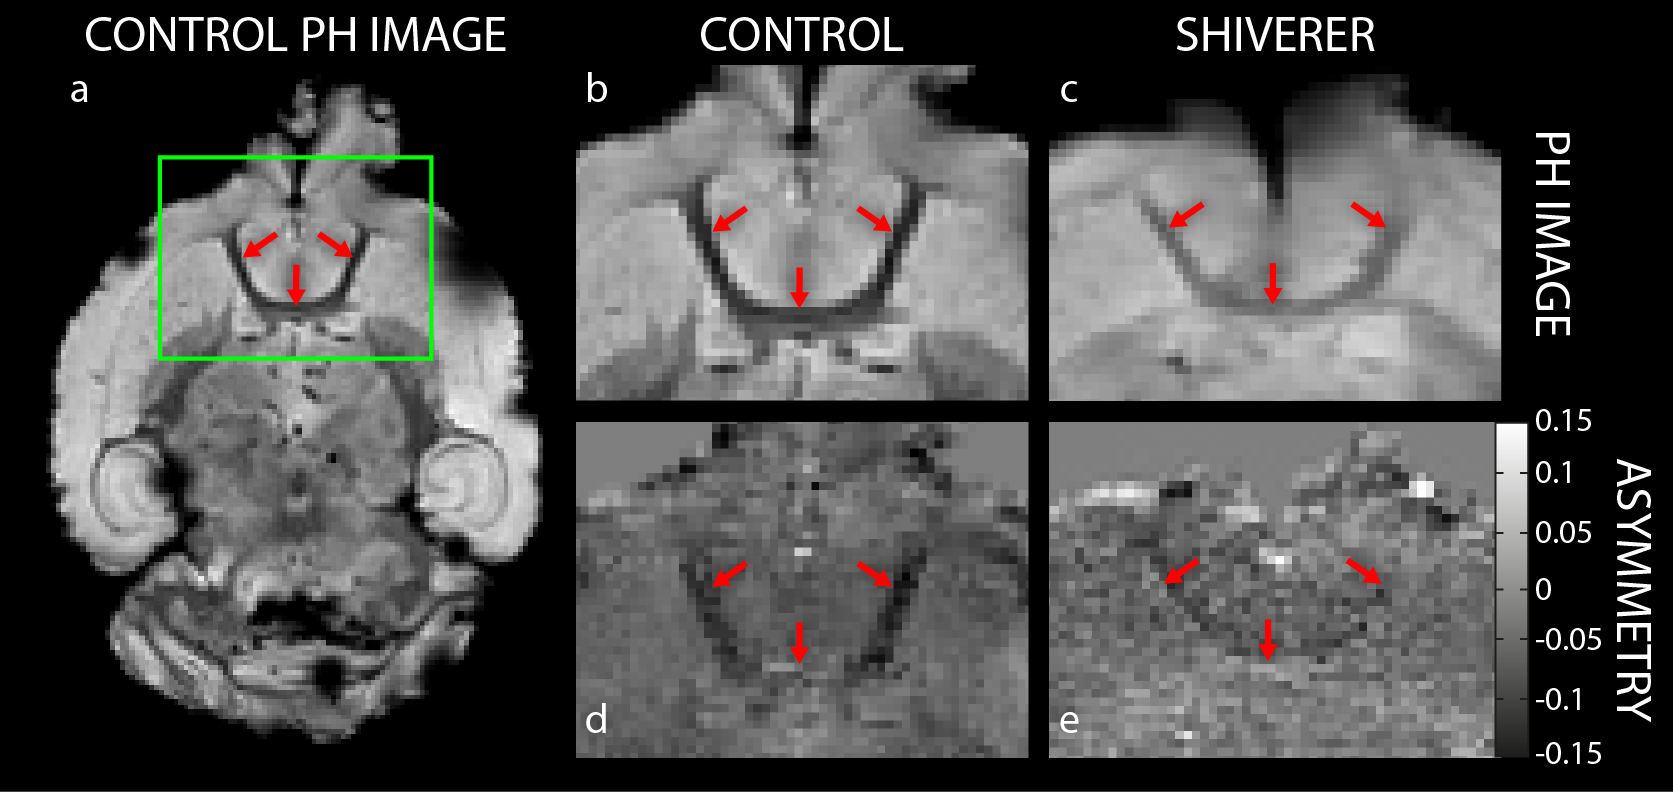
Changes in mean asymmetry with FA for both control and shiverer mice are shown in figure 3. As the threshold range increases, indicating increasing white matter volume fraction, the trend in mean magnitude asymmetry in the spectra from control brains increases as well; mean asymmetry in the shiverer mice, however, demonstrate no such trend. Moreover, for each FA threshold range, the magnitude of the mean asymmetry in the control mice was statistically significantly larger than those in the shiverer mice (p<0.1, one-way Student’s t-test). Figure 4 demonstrates that the asymmetry can be used as a source of contrast. The AC has a larger magnitude mean asymmetry than the surrounding grey matter in the control compared with the shiverer brain and, as such, is more prominent.
Discussion
Consistent with the literature, grey/white matter contrast was larger due to the presence of myelin3. Further, changes in tissue composition (i.e. grey/white volume fraction) were shown to produce measurable and variable asymmetrical broadening of the spectrum. Present results are consistent with simulations: Xu et alshowed that with a 3-compartment, nested cylinder model employing susceptibility anisotropy that the myelin compartment introduces a small, broad peak in the spectrum that is shifted up-field of the intra- and extra-axonal compartments6. Such a feature of the spectrum would clearly introduce a measureable asymmetry in the water spectrum, suggesting that the measured resonance with a 3D-MGE sequence is sensitive to the state of white matter myelination.Conclusion
The experimental results reported here compliment previous results, demonstrating that structural variations in tissue architecture, including both myelin and relative concentration, cause characteristic, reproducible changes in the water resonance shape. This suggests that water spectra are sensitive specifically to variations in myelin content in brain tissue and may provide MRI-based biomarkers for respective pathological changes due to dysmyelinating diseases.Acknowledgements
No acknowledgement found.References
1. Zimmerman R, Gibby W, Carmody R. Neuroimaging Clinical and Physical Principles. New York: Springer; 2000.
2. Cheon JE, Kim IO, Hwang YS, Kim KJ, Wang KC, Cho BK, Chi JG, Kim CJ, Kim WS, Yeon KM. Leukodystrophy in children: a pictorial review of MR imaging features. Radiographics : a review publication of the Radiological Society of North America, Inc 2002;22(3):461-476.
3. Liu C, Li W, Johnson GA, Wu B. High-field (9.4 T) MRI of brain dysmyelination by quantitative mapping of magnetic susceptibility. NeuroImage 2011;56(3):930-938.
4. Rosenbluth J. Central myelin in the mouse mutant shiverer. The Journal of comparative neurology 1980;194(3):639-648.
5. Foxley S, Karczmar GS, Takahashi K. The effects of variations in tissue microstructure from postmortem rat brain on the asymmetry of the water proton resonance. Magnetic resonance in medicine 2018.
6. Xu T, Foxley S, Kleinnijenhuis M, Chen WC, Miller KL. The effect of realistic geometries on the susceptibility-weighted MR signal in white matter. Magnetic resonance in medicine 2018;79(1):489-500.
Figures