0124
Multi-parameter quantitative MRI reveals common distribution of myelin in ex-vivo chimpanzee and in-vivo human brains1Wellcome Centre for Integrative Neuroimaging, FMRIB, Nuffield Department of Clinical Neurosciences, University of Oxford, Oxford, United Kingdom, 2Donders Institute for Brain, Cognition and Behaviour, Radboud University Nijmegen, Nijmegen, Netherlands
Synopsis
Post-mortem investigations of tissue properties can dramatically extend the biological information that can be obtained from bodies or tissue that cannot be easily investigated in-vivo, as is the case for the majority of species of interest to comparative neuroscience. Here, we show the potential of a quantitive MRI method, multi-parameter mapping, to obtain high-resolution information about tissue properties of large non-human primates that generally cannot be studied anatomically. We compare myelination indices, derived from ex-vivo chimpanzee data at 7T to those derived from in-vivo human data at 3T.
Introduction
We investigate the feasibility of applying a quantitative MRI method, multi-parameter mapping (MPM)1, to post-mortem samples of non-human primates.
Investigations of post-mortem tissue allow us to compare MRI-related signals and histology within the same brain, which is an essential step towards understanding our diagnostic in-vivo MRI tools. By working with tissue from non-human primates we investigate the feasibility of studying the most common animal model of the human brain.
Studying post-mortem tissue allows us to investigate a much wider range of animals than previously possible, invaluable for understanding specialisations of the human brain2,3. Quantitative data can be used to derive and compare indices of myelination and other tissue parameters, both in- and ex-vivo. While the feasibility of in-vivo non-human myelin mapping has been shown4, legal, ethical and technical challenges exist for in-vivo data collection in non-human species. Post-mortem investigation offers a competing option to substantially increase our knowledge of myelination beyond what is achievable with existing data.
Methods
Post-mortem MRI data was acquired in the formalin-fixed brain of a chimpanzee (Pan troglodytes, female, age 28 at death) obtained from the Primate Brain Bank. Before scanning, the tissue was soaked in PBS for a 7 days to remove the fixative and immersed in flourinert. MRI data were collected on a 7T Magnetom scanner (Siemens, Erlangen, Germany), using a 28-channel dedicated knee coil (QED, Mayfield Village, USA).
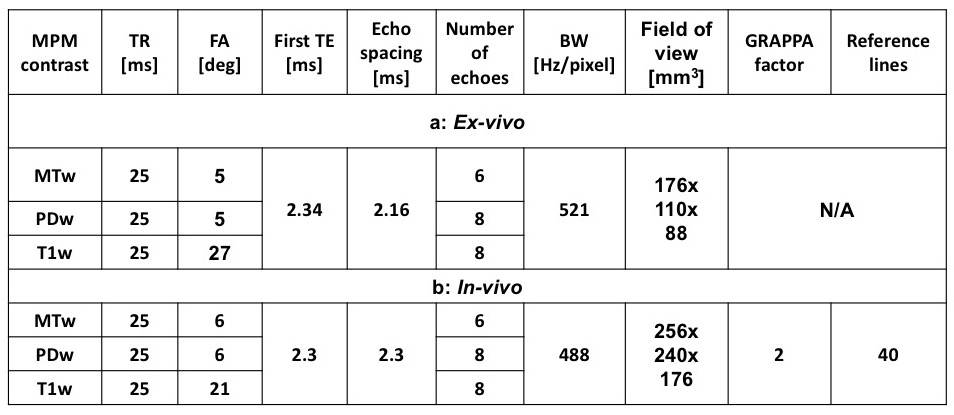
Quantitative data was acquired in the MPM framework, using three 3D FLASH scans with predominantly T1 (T1w), proton density (PDw), or magnetisation transfer (MTw) contrast, at 550 um isotropic resolution, eleven repetitions per contrast. Other parameters detailed in Table Ia. The transmit field was mapped using an AFI scan, 2mm isotropic resolution; FOV=180x120x96mm3; TR1/TR2/TE=7/21/2.6ms FA=45°.
Maps of the longitudinal (R1) and effective transverse (R2*) relaxation rate and magnetisation transfer saturation (MT) were derived from in-vivo and ex-vivo data using the hMRI toolbox5. R2* was estimated from signal decay across echoes of all contrasts6, R1 using the variable-flip-angle method, extended to include saturation for MT. R1 and MT are markers for myelin via sensitivity to macromolecular content, cortical R2* is a marker for iron, indicating oligodendrorctyes. Transmit field maps were used to correct B1+ inhomogeneities. To increase SNR, the eleven post-mortem acquisitions were averaged prior to map creation.
Whole-brain grey and white matter tissue probability maps were derived from the data using FAST7 after brain extraction, thresholded at 90% probability to create tissue-specific masks. Brain regions were identified based on anatomical markers. Quantitative values were investigated ex-vivo in three representative areas known to show differences in cortical myelin distribution8. In the prefrontal cortex (PFC), where comparatively low cortical myelin content was expected. In the central sulcus (CS), the highly myelinated primary motor cortex was compared with the opposite bank using a pairs of 3x3x1 voxel ROIs. In the lateral fissure (LF), the auditory cortex was investigated.
For comparison, in-vivo human data (10 subjects, mean age 27.7, 6 female, CUREC R55787/RE001 ethical permission) were collected using a 3T Prisma scanner (Siemens, Erlangen, Germany), using a 32-channel head coil, 1.5 mm isotropic resolution, other parameters in Table Ib. 3D EPI with spin (SE) and stimulated (STE) echoes; FOV=256x192x192mm3; matrix size 64x48x48; TR/TE(SE)/TE(STE)=500/39.08/72.88ms was used to map the transmit field. A 2D field map; FOV=192x192x192 mm3, TR/TE1/TE2=1020/10/12.46ms, was used to correct the 3D EPI scan for distortions.
Results and discussion
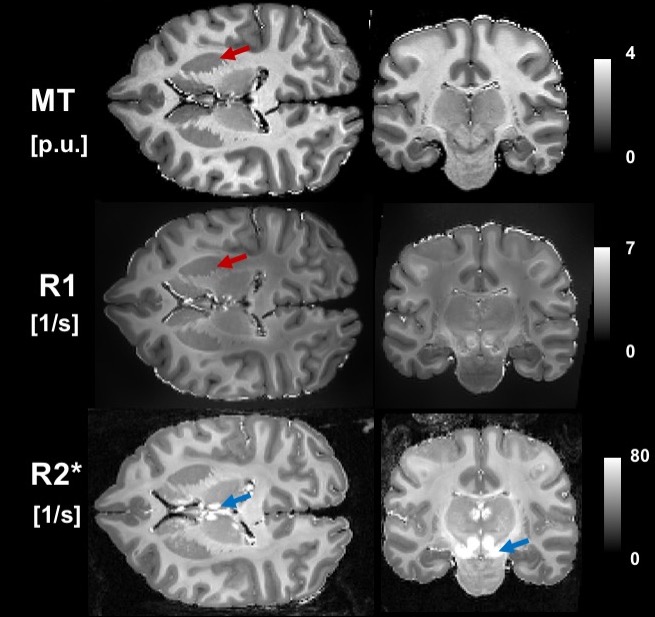
Ex-vivo quantitative maps show excellent grey/white matter contrast, even for deep brain grey matter structures (Figure 1).
Whole-brain quantitative values for in-vivo and ex-vivo data are shown in Table II. In-vivo results compare well to previous studies8,9. The overall increase of R1 in ex-vivo tissue can be explained by fixation, and residual transmit field effects.
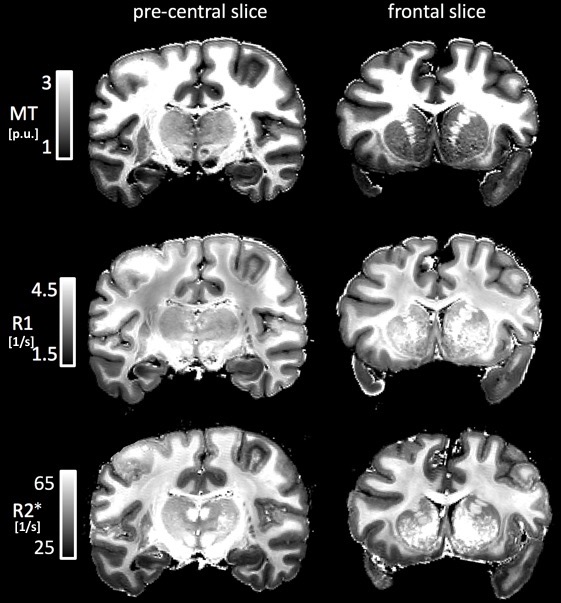
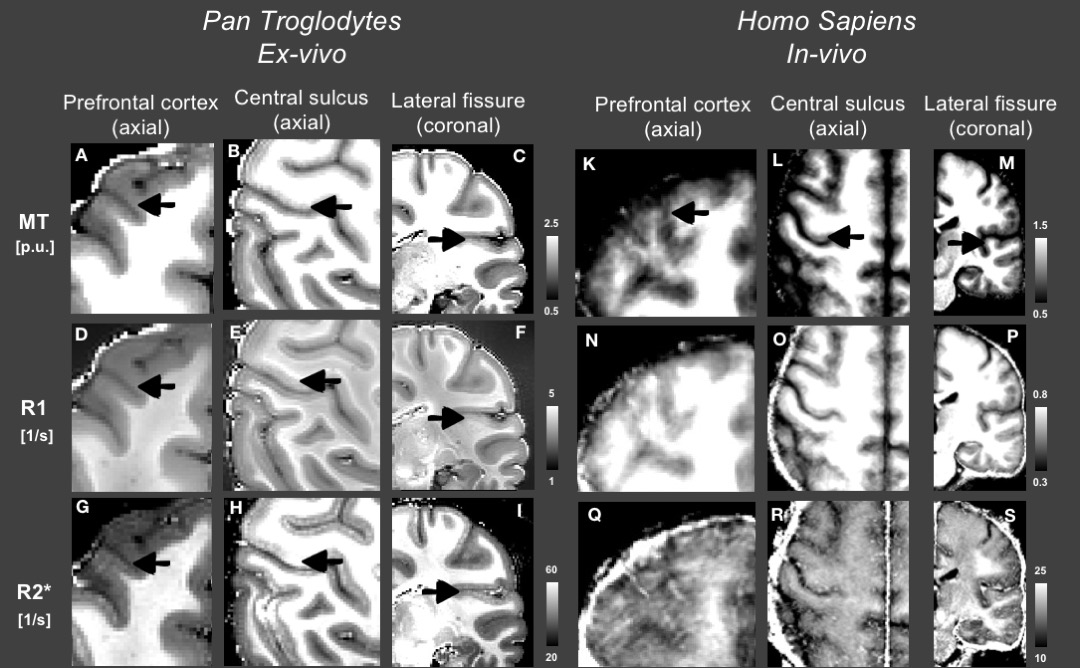
Ex-vivo, quantitative values found in PFC grey matter were consistently lower than those in more central tissue (Figure 2). Differential cortical myelination of the anterior and posterior banks of CS and of LR grey matter is clearly indicated for both in-vivo and ex-vivo data on the quantitative maps (Figure 3).
Ex-vivo, the quantitative values for the anterior and posterior banks of CS were 2.48±0.28 / 1.86±0.33 pu for MT, 4.07±0.29 / 3.1±0.41 1/s for R1, and 64.49±5.1 / 47.36±5.82 1/s for R2*, respectively. These results clearly indicate the higher relative cortical myelination in the primary motor cortex of the chimpanzee brain, in line with previous findings human10 and animal4 findings.
Conclusion
We have successfully demonstrated the applicability and viability of a quantitative MRI method to generate myelin-sensitive maps in-vivo and ex-vivo. Future work will focus on extending the approach to other non-human primate species, and to surface-based analysis.Acknowledgements
The Wellcome Centre for Integrative Neuroimaging is supported by core funding from the Wellcome Trust (203139/Z/16/Z). R.B.M. and C.F. are supported by the Biotechnology and Biological Sciences Research Council UK [BB/N019814/1 to R.B.M.], N.E. is supported by the Wellcome Trust [203730/Z/16/Z].
The authors would like to thank Dr. Martina Callaghan of the Wellcome Centre For Human Neuroimaging, London, and Dr. Kerrin Pine of the Max Planck Institute of Human Cognitive and Brain Sciences, Leipzig for the MPM sequences used at 3T and 7T, respectively.
References
1: Weisskopf N et al: Quantitative multi-parameter mapping of R1, PD*, MT, and R2* at 3T: a multi-center validation, Front. Neurosci, 2013
2: Mars RB et al: Primate comparative neuroscience using magnetic resonance imaging: promises and challenges, Front Neurosci, 2014
3: Rilling JK: Comparative primate neuroimaging: insights into human brain evolution, Trends Cogn Sci, 2014
4: Glasser MF et al: Trends and Properties of Human Cerebral Cortex: Correlations with Cortical Myelin Content, Neuroimage, 2014
5: Balteau E et al: hMRI - A toolbox for using quantitative MRI in neuroscience and clinical research, WIAS, 2018 (pre-print)
6: Weisskopf N et al: Estimating the apparent transverse relaxation time (R2*) from images with different contrasts (ESTATICS) reduces motion artifacts, Front Neurosci, 2014
7: Zhang Y et al: Segmentation of brain MR images through a hidden Markov random field model and the expectation-maximization algorithm, IEEE Trans Med Imag, 2001
8: Lutti A et al: Using high-resolution quantitative mapping of R1 as an index of cortical myelination, Neuroimage, 2014
9: Carey D et al: Quantitative MRI provides markers of intra-, inter-regional, and age-related differences in young adult cortical microstructure, Neuroimage, 2017
10: Glasser MF et al: Mapping Human Cortical Areas In Vivo Based on Myelin Content as Revealed by T1- and T2-Weighted MRI, J Neurosci, 2011
Figures