0123
Pitching the Cuprizone Mouse Model for Testing (re-) myelination therapies: robustness and reproducibility1Roche Pharma Research & Early Development, Neuroscience, Ophthalmology and Rare Diseases Discovery & Translational Area, Roche Innovation Center Basel, F. Hoffmann-La Roche Ltd., Basel, Switzerland
Synopsis
We assessed robustness and reproducibility of the cuprizone mouse model of de- and remyelination for its use in testing novel pharmacological treatments of demyelinating disorders such as multiple sclerosis. In several multimodal MRI studies using independent batches of animals, increases in T2, decreases in MTR and FA and biphasic responses in MK upon cuprizone feeding, as well as partial recoveries after cuprizone withdrawal, showed huge effect sizes and high cross-study consistency, especially in the corpus callosum. Our results substantiate the suitability of the cuprizone mouse model for longitudinal monitoring of the pathology using multimodal MRI.
Introduction
Demyelination is a hallmark of multiple sclerosis and other neurodegenerative diseases. Feeding of the copper chelator cuprizone to mice has become an accepted animal model of de- and remyelination, which would be very appealing for longitudinal MRI assessments to test novel pharmacological treatment strategies for remyelination and axonal recovery. However, reports on cuprizone-induced demyelination and spontaneous remyelination upon withdrawal are rather heterogeneous, describing varying degrees and temporal patterns of MRI-derived parameter changes, and thus questioning the utility of the cuprizone mouse model.1 Hence, we set out to demonstrate robustness and reproducibility of the model using a fast MRI protocol for clinically translatable multiparametric readouts of myelination in 6+1 groups of mice across 3 studies performed months apart on independent batches of animals.Methods
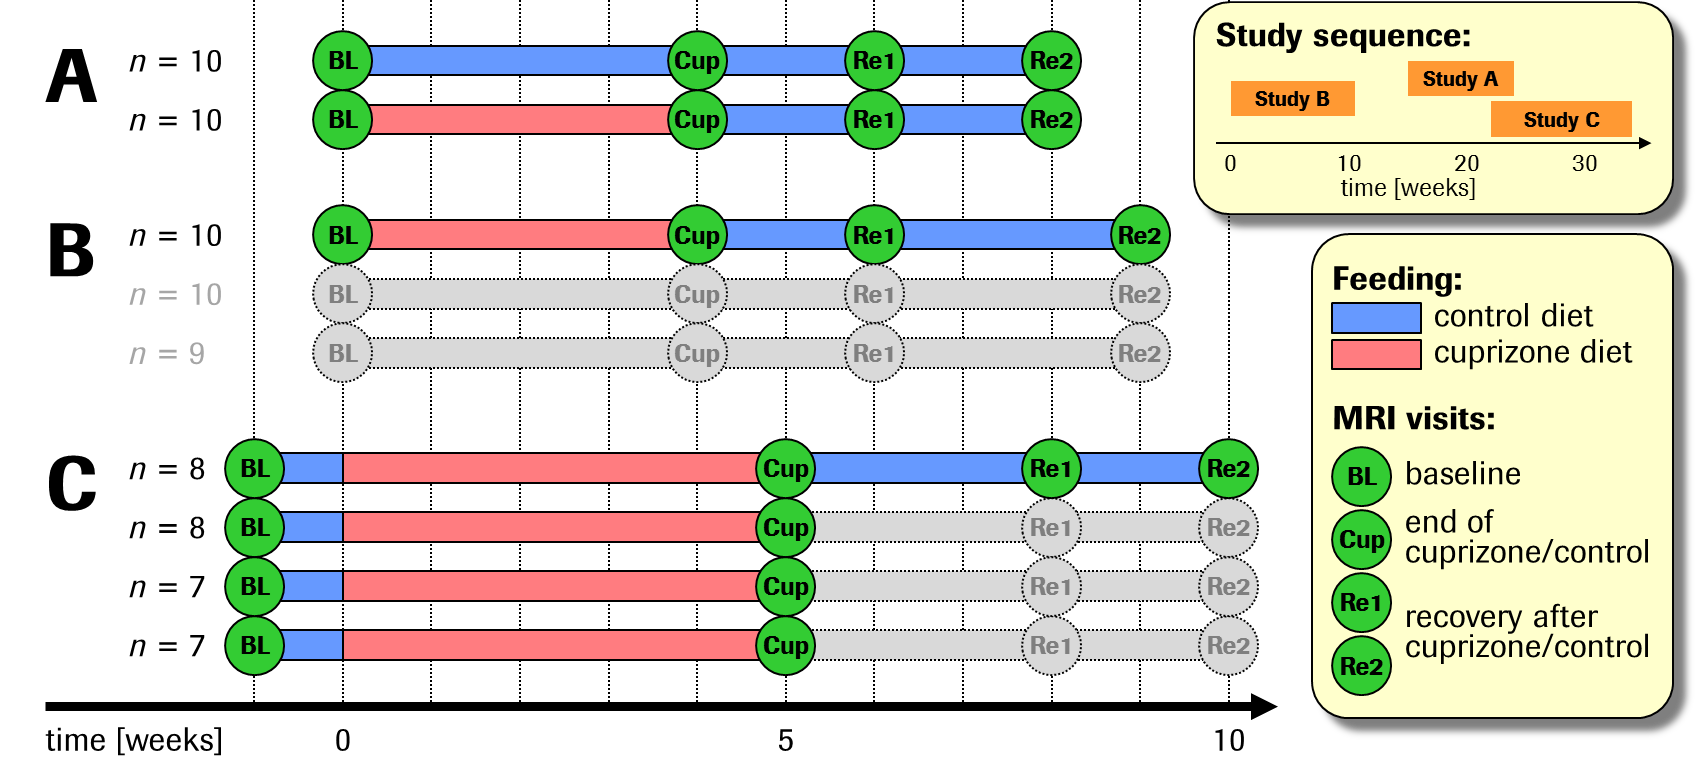
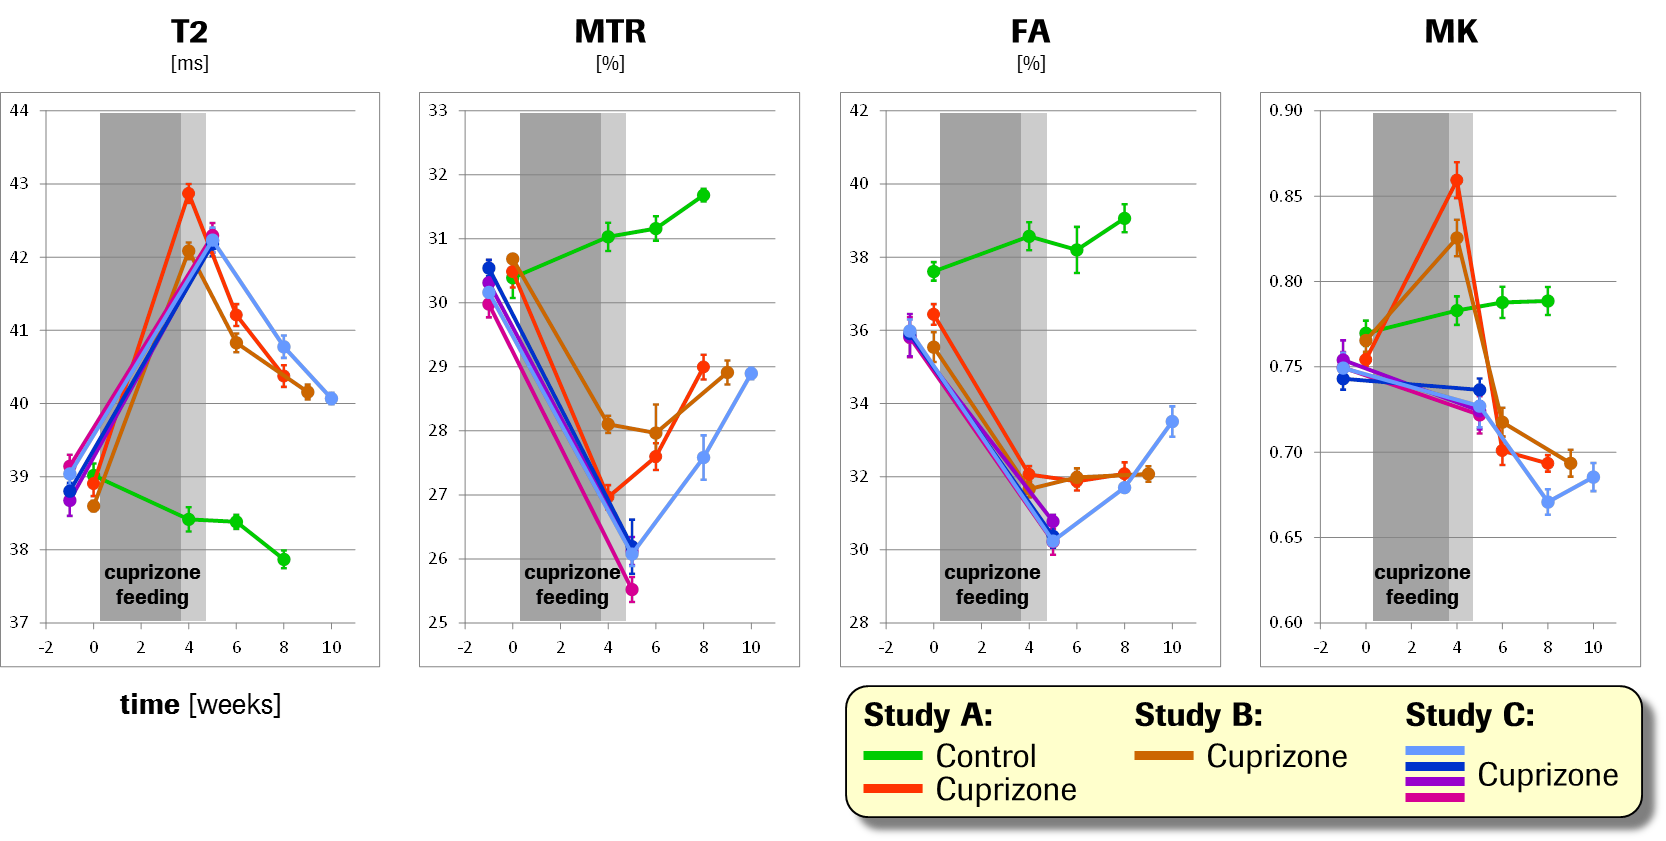
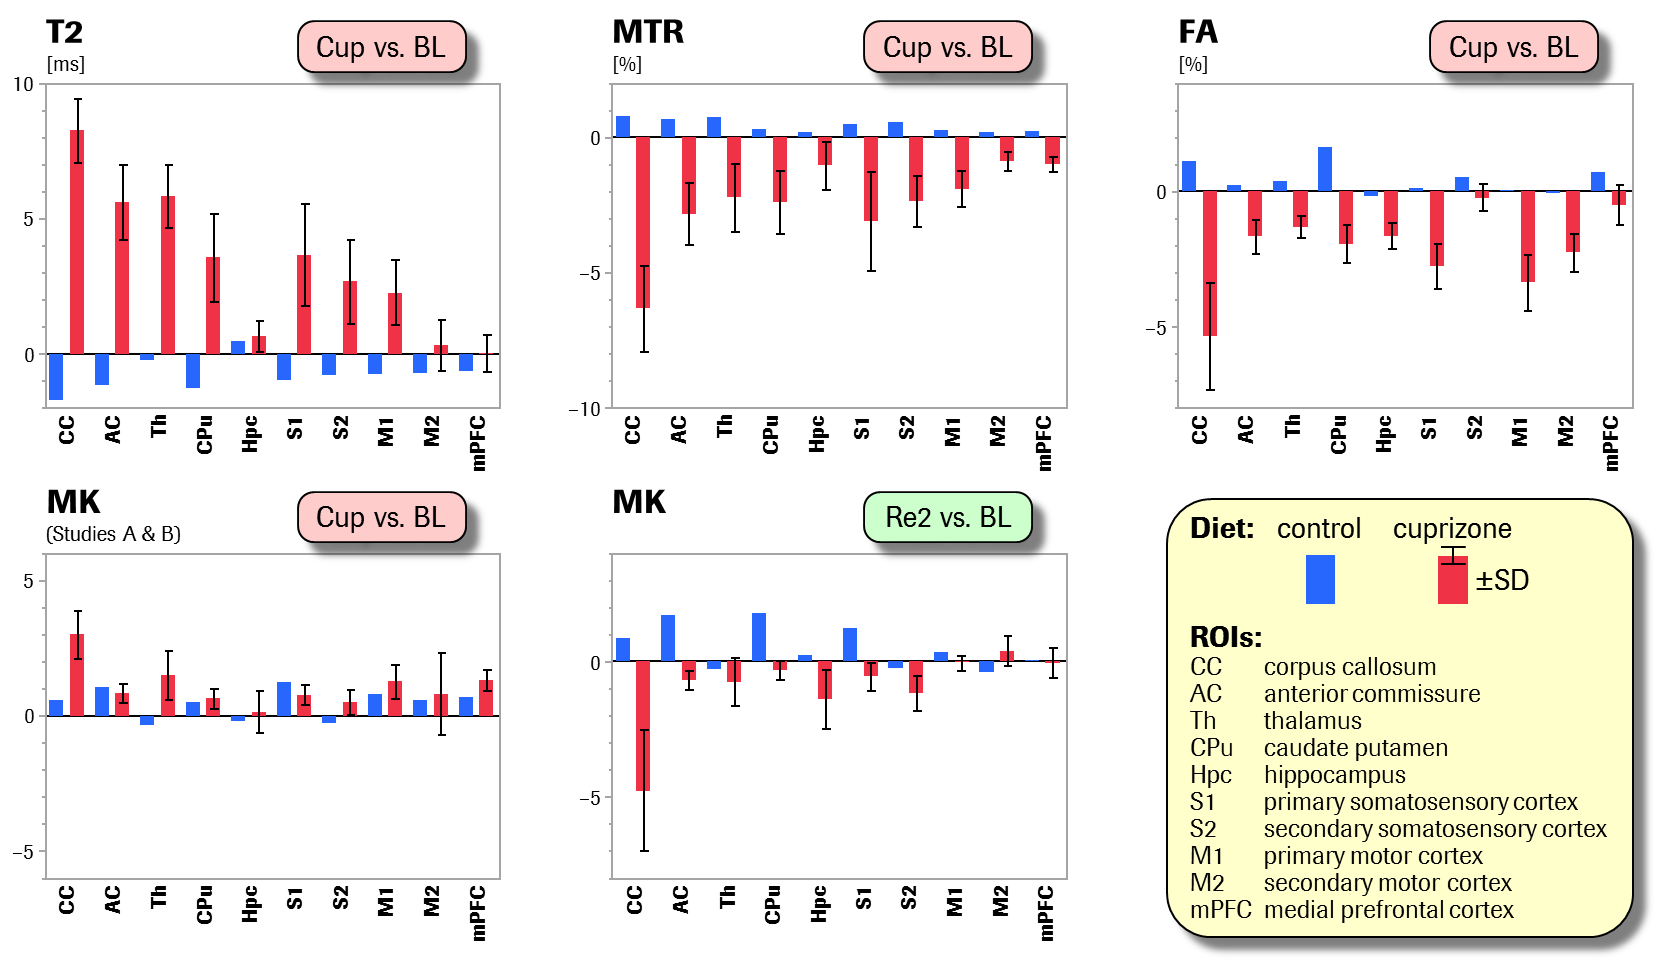
In 3 related though independent studies, 60 adult male C57Bl/6 mice received standard diet (n=10) or diet with 0.2% cuprizone as food-admix (n=50) during 4–5 weeks, followed by 4–5 weeks of cuprizone withdrawal to allow for remyelination. Progression and regression of pathology were assessed by multiparametric MRI including T2 relaxation time, magnetisation transfer ratio (MTR), fractional anisotropy (FA) and mean kurtosis (MK), performed prior to and repeatedly after cuprizone feeding (study designs: Fig.1). During imaging, freely breathing animals were kept under isoflurane anaesthesia. MRI was performed on a Bruker BioSpec 9.4T/20cm scanner equipped with a body coil and a receive-only brain surface coil. The acquisition protocol comprised T2 maps (multi-slice multi-spin-echo sequence, TR=2200ms, TE=10–120ms, 2 averages), MTR maps (RARE-4 sequence, TEeff/TR=16/2365ms, 4 averages; preceded by magnetisation transfer module, 10μT irradiation 8.5kHz downfield of water), and diffusion tensor and kurtosis imaging (DTI/DKI) (1-9-9 scheme, i.e., 1 A0 image and 9 gradient directions at b-values 1000s/mm2 and 2000s/mm2, respectively; EPI readout, TE/TR=23.5/3000ms, 4 averages).2 Images were collected over a 20´20mm2 field-of-view and 15 or 16 coronal slices of 0.6mm and 0.8mm thickness, respectively. Images were registered to an anatomical template, and parameters were averaged within 10 pre-defined brain regions of interest (ROIs) of white or grey matter, respectively (cf. Fig.3 legend). In order to quantify robustness and reproducibility of parameter changes, longitudinal effect sizes (Cohen’s d) were determined within each of the 6+1 groups and for each ROI. Their cross-group means and standard deviations were taken as measures of response strength (robustness) and consistency (reproducibility), respectively. In addition, a variance components analysis with factors Visit and Group/Study was used to estimate the percent variance explained by cuprizone- and recovery-related within-group changes (Visit) as compared to the total variance.Results
Baseline starting values of all parameters were highly consistent across groups and studies on an absolute quantitative scale (cross-group coefficients-of-variation (CVs) for T2, MTR, FA and MK: 0.5%, 0.8%, 1.9% and 1.2%). The strongest changes after cuprizone feeding and withdrawal were seen in the corpus callosum, i.e., the largest white-matter region accessible to MRI in rodents (Fig.2). While the negative-control group showed only a moderate, presumably age-related, trend in each parameter, the active groups exhibited massive increases in T2 (Cohen’s d mean ± standard deviation: 8.3±1.2, i.e., CV=14 %) and decreases in MTR (d=–6.3±1.6) and FA (d=–5.3±2.0) upon cuprizone feeding, as well as partial recoveries during the subsequent withdrawal phase. Notably, the temporal evolutions of these parameters were highly consistent across groups and studies: the relative variance explained by Visit was 86%, 68% and 71%, respectively, as opposed to 2%, 8% and 2% explained by Group/Study. MK displayed a pronounced cuprizone-induced increase (d=3.0±0.9) followed by a rapid drop towards smaller values as compared to baseline (d=–2.8±0.5) in studies A and B. (In study C, this transient increase occurring at week ~4 was apparently missed due to longer cuprizone feeding.) Effects in other ROIs were weaker, yet still prominent, consistent and qualitatively equivalent to changes in the corpus callosum (Fig.3).Discussion
The MRI parameter changes induced by cuprizone, primarily in the white matter, are in line with common hypotheses and previous reports, i.e., demyelination (1) reducing the relative amount of water bound to macromolecules, thereby increasing T2 and decreasing MTR; and (2) degrading myelin/axonal integrity, thereby decreasing FA. The precise association between MK and microstructural integrity is still under debate, in which respect it is particularly interesting that we observed a transient MK increase rapidly followed by a reversal and overshoot into the opposite, which precisely replicates a recent finding from a different lab.3Conclusion
The plausibility of the changes, their huge effect sizes and the highly consistent spatio-temporal patterns that we observed in independent studies substantiate the robustness and reproducibility of the cuprizone mouse model and its suitability for future use, e.g., in drug research, using multimodal MRI.Acknowledgements
We thank our technical staff Stephanie Schöppenthau and Sébastien Debilly for the extremely reliable animal handling and data acquisition, as well as Thomas Bielser for implementing the powerful in-house data management and image preprocessing software.References
Kipp M, Clarner T, Dang J, Copray S, Beyer C (2009): The cuprizone animal model: new insights into an old story. Acta Neuropathol 118, 723-736.
Hansen B, Lund TE, Sangill R, Stubbe E, Finsterbusch J, Jespersen SN (2016): Experimental Considerations for Fast Kurtosis Imaging. Magnetic Resonance in Medicine 76, 1455-1468.
Guglielmetti C, Veraart J, Roelant E, Mai Z, Daans J, Van Audekerke J, Naeyaert M, Vanhoutte G, Palacios RDY, Praet J, Fieremans E, Ponsaerts P, Sijbers J, Van Der Linden A, Verhoye M (2016): Diffusion kurtosis imaging probes cortical alterations and white matter pathology following cuprizone induced demyelination and spontaneous remyelination. Neuroimage 125, 363-377.
Figures