0119
A comparison between diffusion metrics, macromolecular proton fraction, and g-ratio for quantitative in vivo myelin mapping1New York University School of Medicine, New York, NY, United States, 2Department of Radiology, New York University School of Medicine, New York, NY, United States, 3Department of Radiology, University of Wisconsin at Madison, Madison, WI, United States, 4Bernard and Irene Schwartz Center for Biomedical Imaging, New York, NY, United States
Synopsis
Myelination as one of the most reliable indicators of postnatal brain maturation and cognitive ability, supports white matter function by facilitating efficient neural signaling and pathway remodeling. The current study aimed to compare in healthy young adults several recently developed myelin mapping metrics including g-ratio, macromolecular proton fraction, and metrics from diffusion tensor/kurtosis imaging. Relationships between these individual metrics and their specific sensitivity to different aspects of white matter microstructure are discussed.
Introduction
Myelin plays an important role in white matter functioning by ensuring efficient flow and synchronization of neural signals [1]. Dysmyelination occurs across a range of neurological and psychiatric disorders, thus the accurate assessment of myelination is essential to the development of effective targeted treatments. However, existing in vivo myelin measures using MRI are usually either non-specific to myelin content or do not distinguish myelin decrease from dysmyelination or axonal loss. To better understand measures from various imaging modalities in terms of their specificity in characterizing myelin, we examined here correlations among several recently developed quantitative myelin metrics derived from magnetization transfer imaging (MTI) and diffusion imaging (dMRI), namely, macromolecular proton fraction (MPF) from quantitative MTI [2,3,4], radial diffusivity (RD) and radial kurtosis (RK) from DTI/DKI [5,6], compartment-specific white matter tract integrity (WMTI) metrics axonal water fraction (faxon) and extra-axonal radial diffusivity (RDextra), a putative marker of myelination [7,8]. Quantitative g-ratio (the ratio of inner axonal diameter to the outer diameter), which is a multimodal metric directly reflecting axonal myelin thickness, was also examined in relation to MPF and dMRI metrics [9].Methods
27 healthy volunteers (11 females, 16 males, age: 23.6 ± 3.3 years) participated in the study. All experiments were performed on a 3T Siemens Prisma scanner.
For qMT mapping, a three-dimensional gradient echo MT-weighted sequence was acquired with a voxel size of 1.5x1.5x1.5 mm3 and approximately full brain coverage. One MT-weighted (TR = 29 ms; FA = 10°) and two non-MT-weighted datasets (TR = 21ms; FA = 4° and 25°) were collected. Off resonance saturation was achieved by applying a Gaussian pulse with effective saturation FA = 560°, pulse duration = 12.3 ms, and offset frequency = 4 kHz.
Diffusion MRI acquisition was based on an augmented Human Connectome protocol and included b-values of 600, 800, 1000, 1500, 2000, and 3000 s/mm2 for a total of 120 uniformly distributed directions and an isotropic voxel size of 1.5x1.5x1.5 mm3.
High resolution (voxel size = 0.8x0.8x0.8 mm3) 3D T1w MPRAGE images were also acquired using the Human Connectome Protocol for brain segmentation. FreeSurfer Deskian/Killiany atlas was used for white matter ROI analysis.
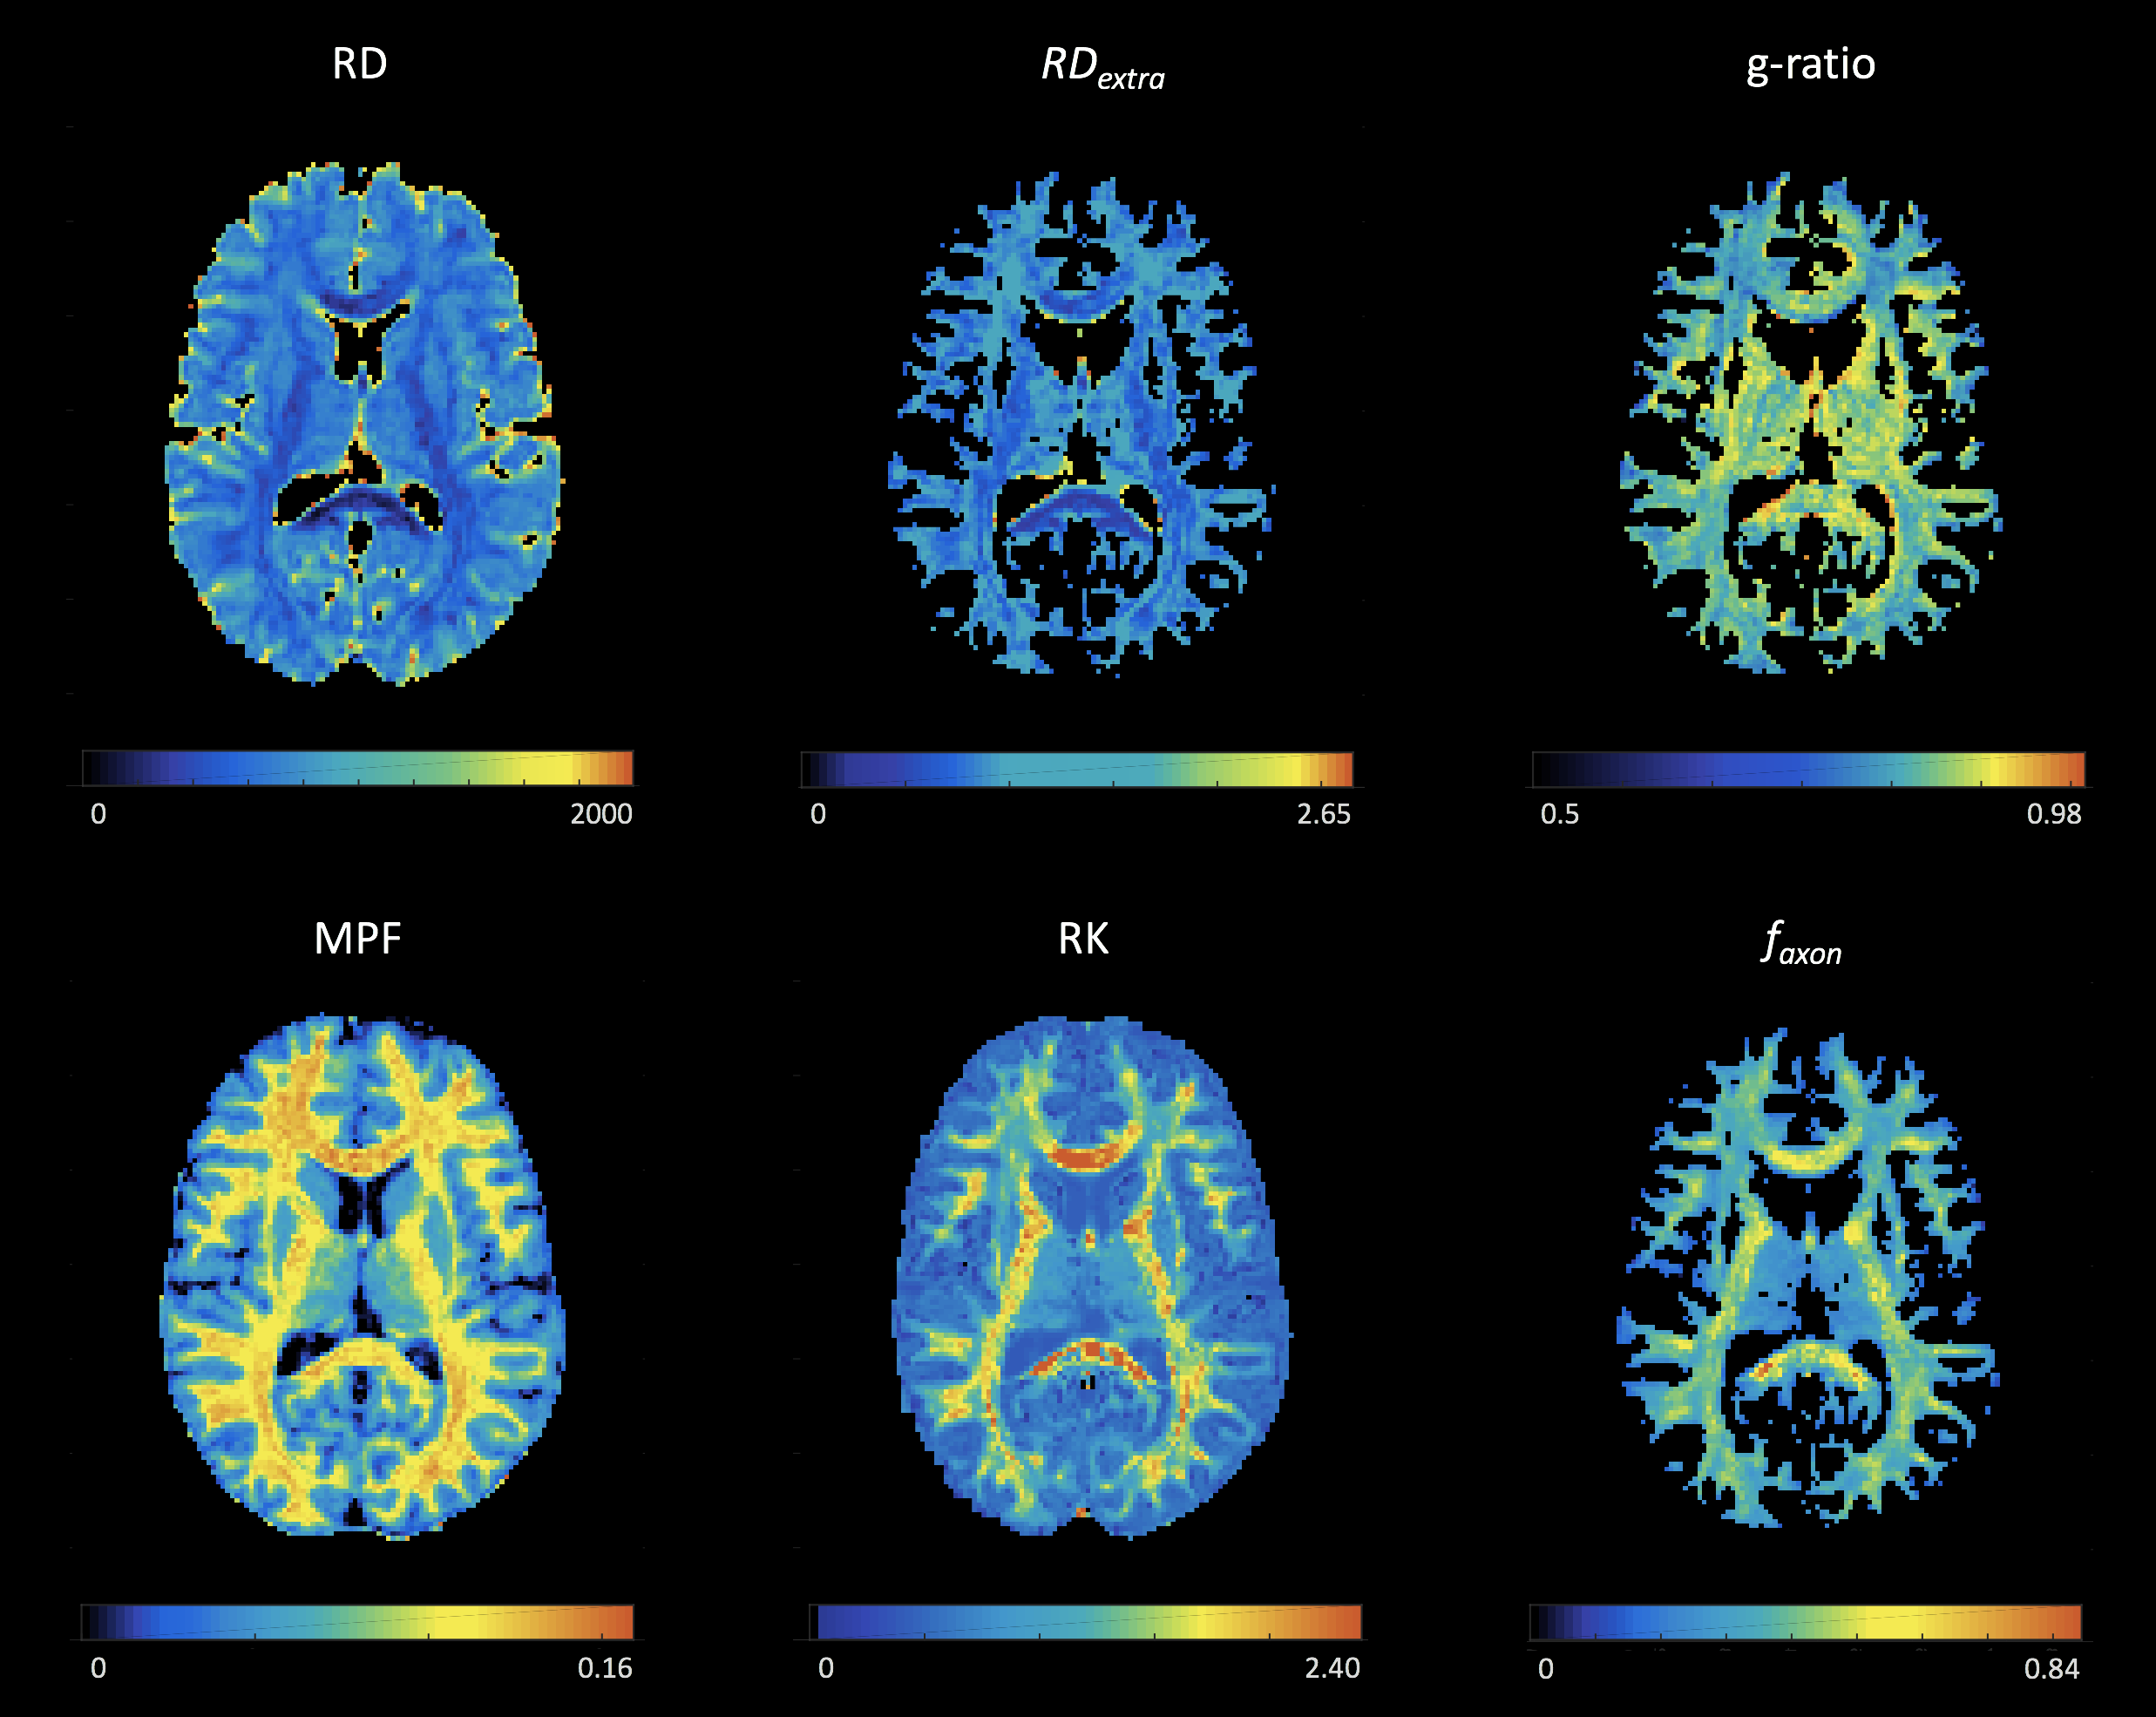
MPF was calculated from MT-weighted images as previously described [4]. Diffusion data were fitted using the DKI and WMTI model to obtain diffusion and kurtosis tensors, from which related metrics were calculated, including radial, axial, and mean diffusivity (RD, AD, MD), kurtosis indices (RK, AK, MK), and WMTI parameters faxon, RDextra, ADextra. g-ratio was calculated using faxon and MPF values as described in [9] (Fig 1). Correlation and regression analyses for these myelin metrics were performed across white matter regions and across subjects. FSL, Interactive Data Language, and Matlab were used for imaging data processing, ROI extraction, and statistical analyses.
Results
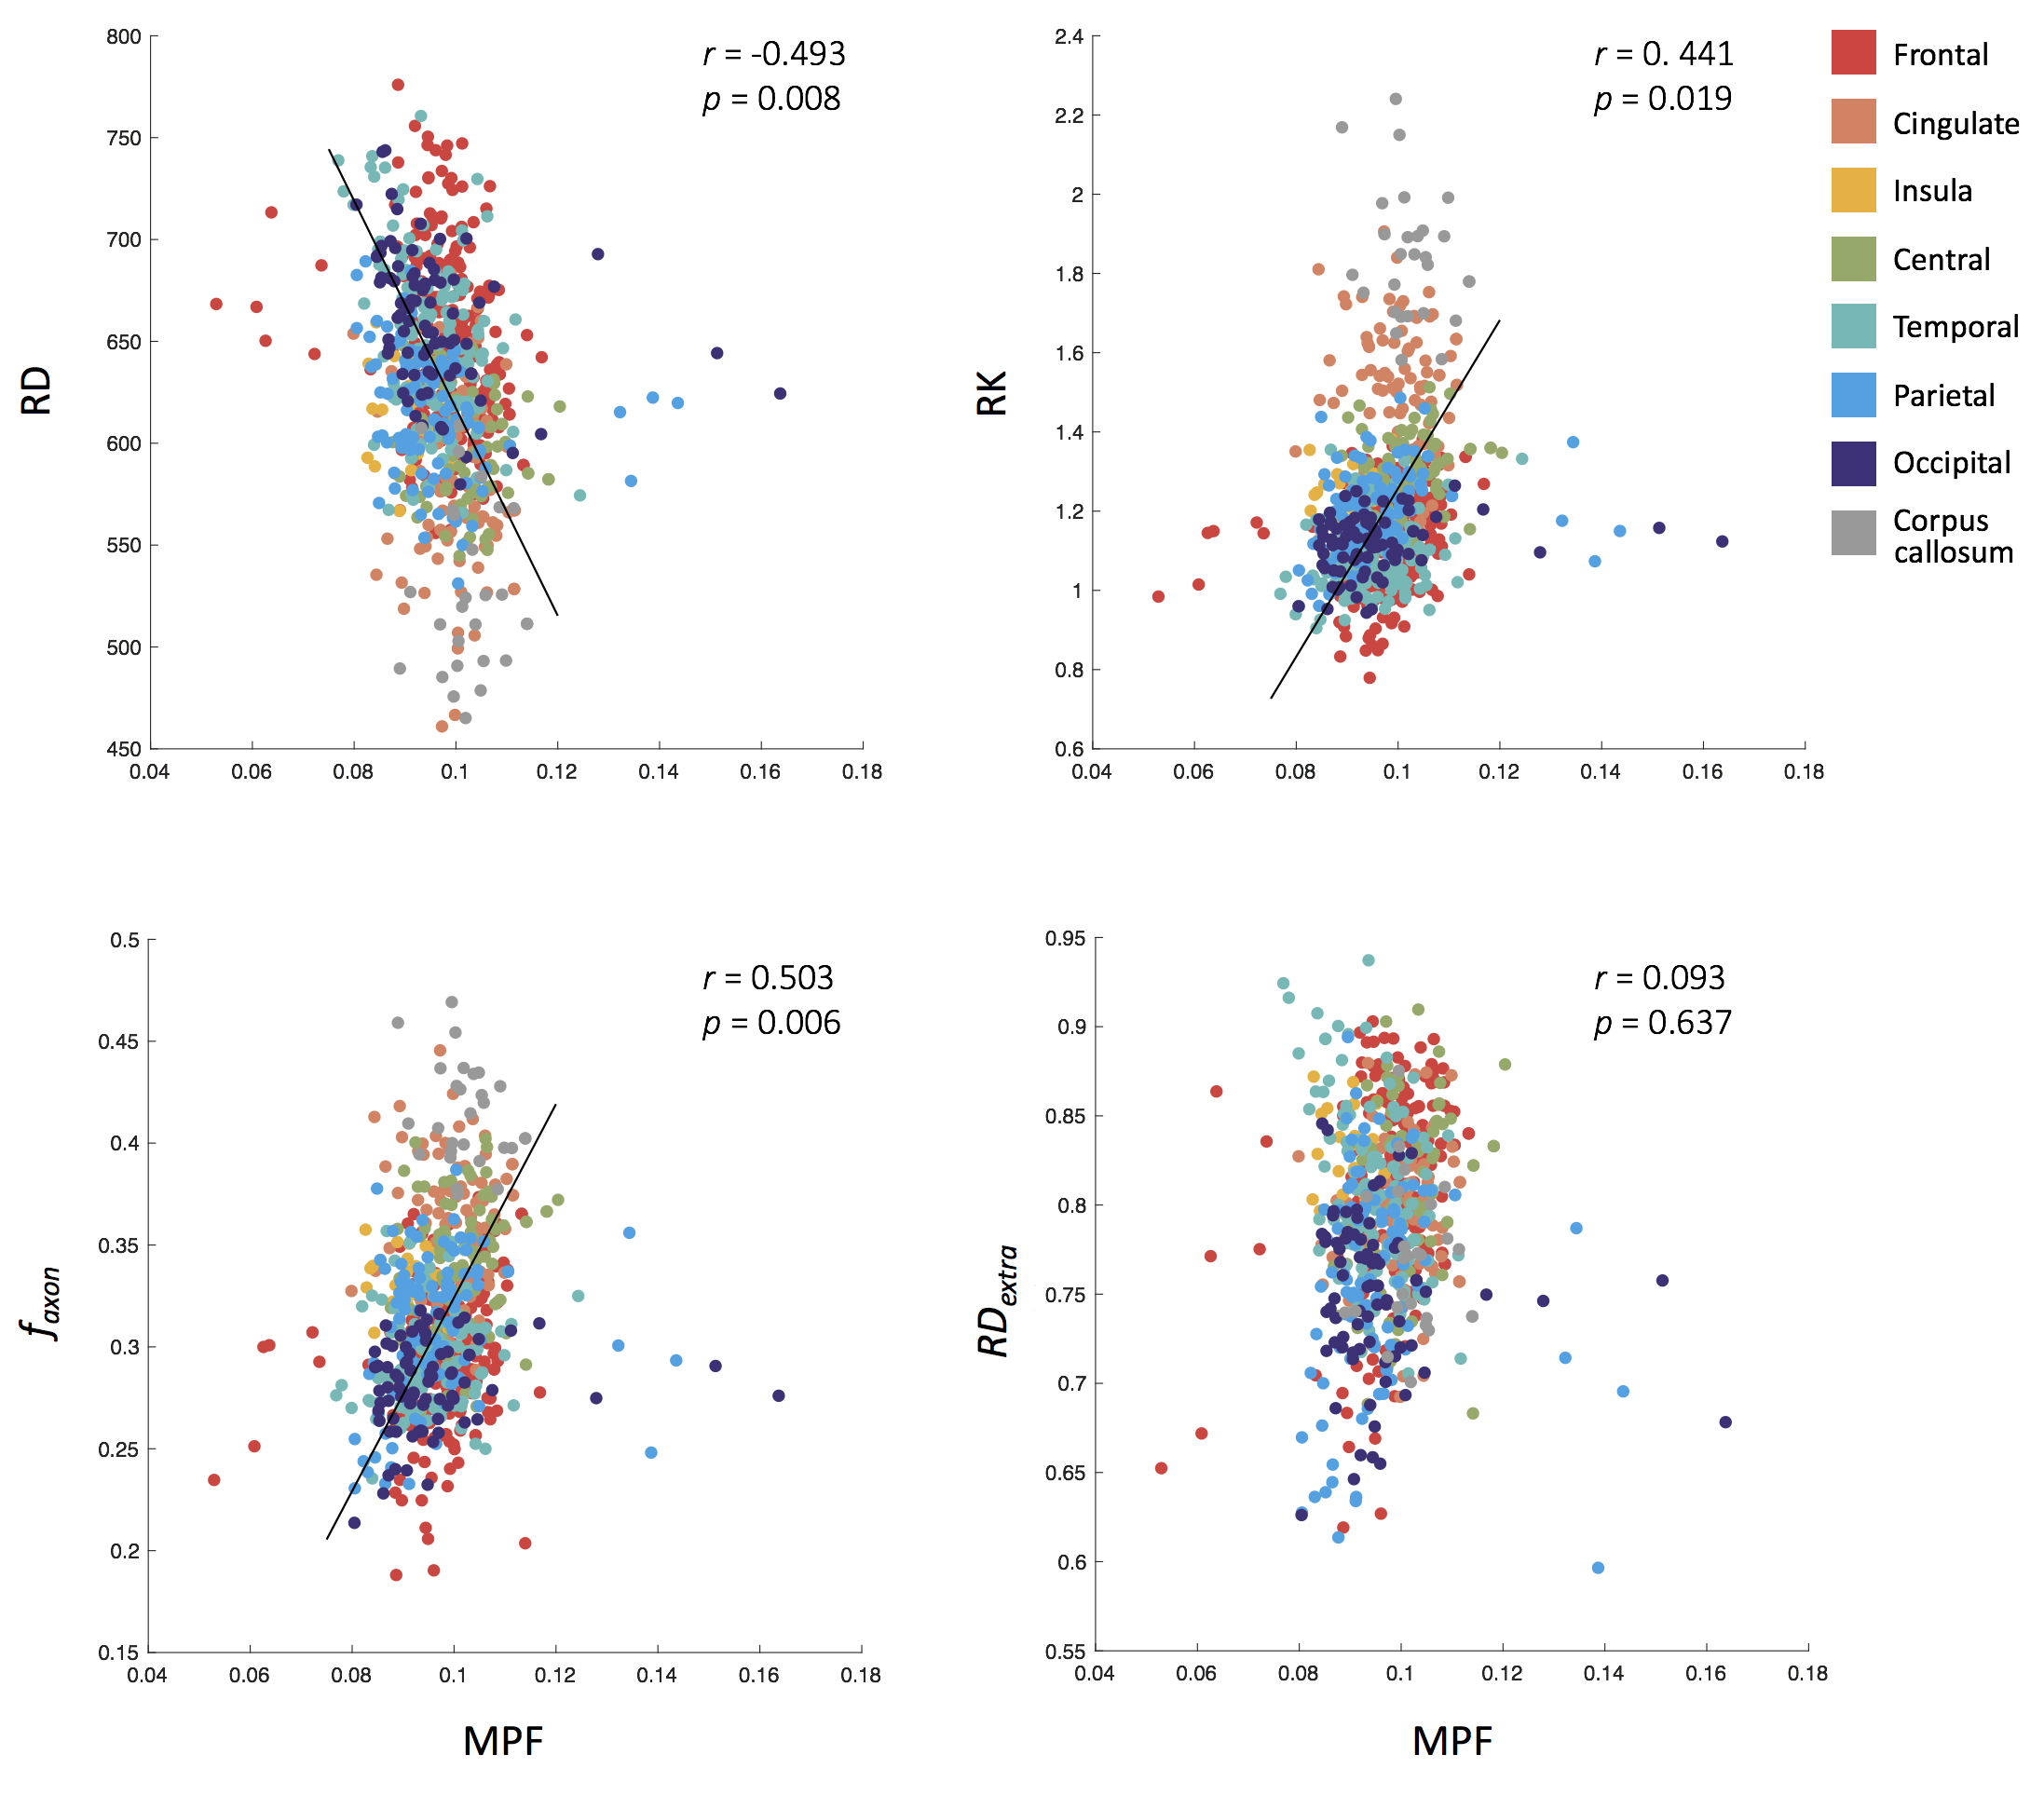
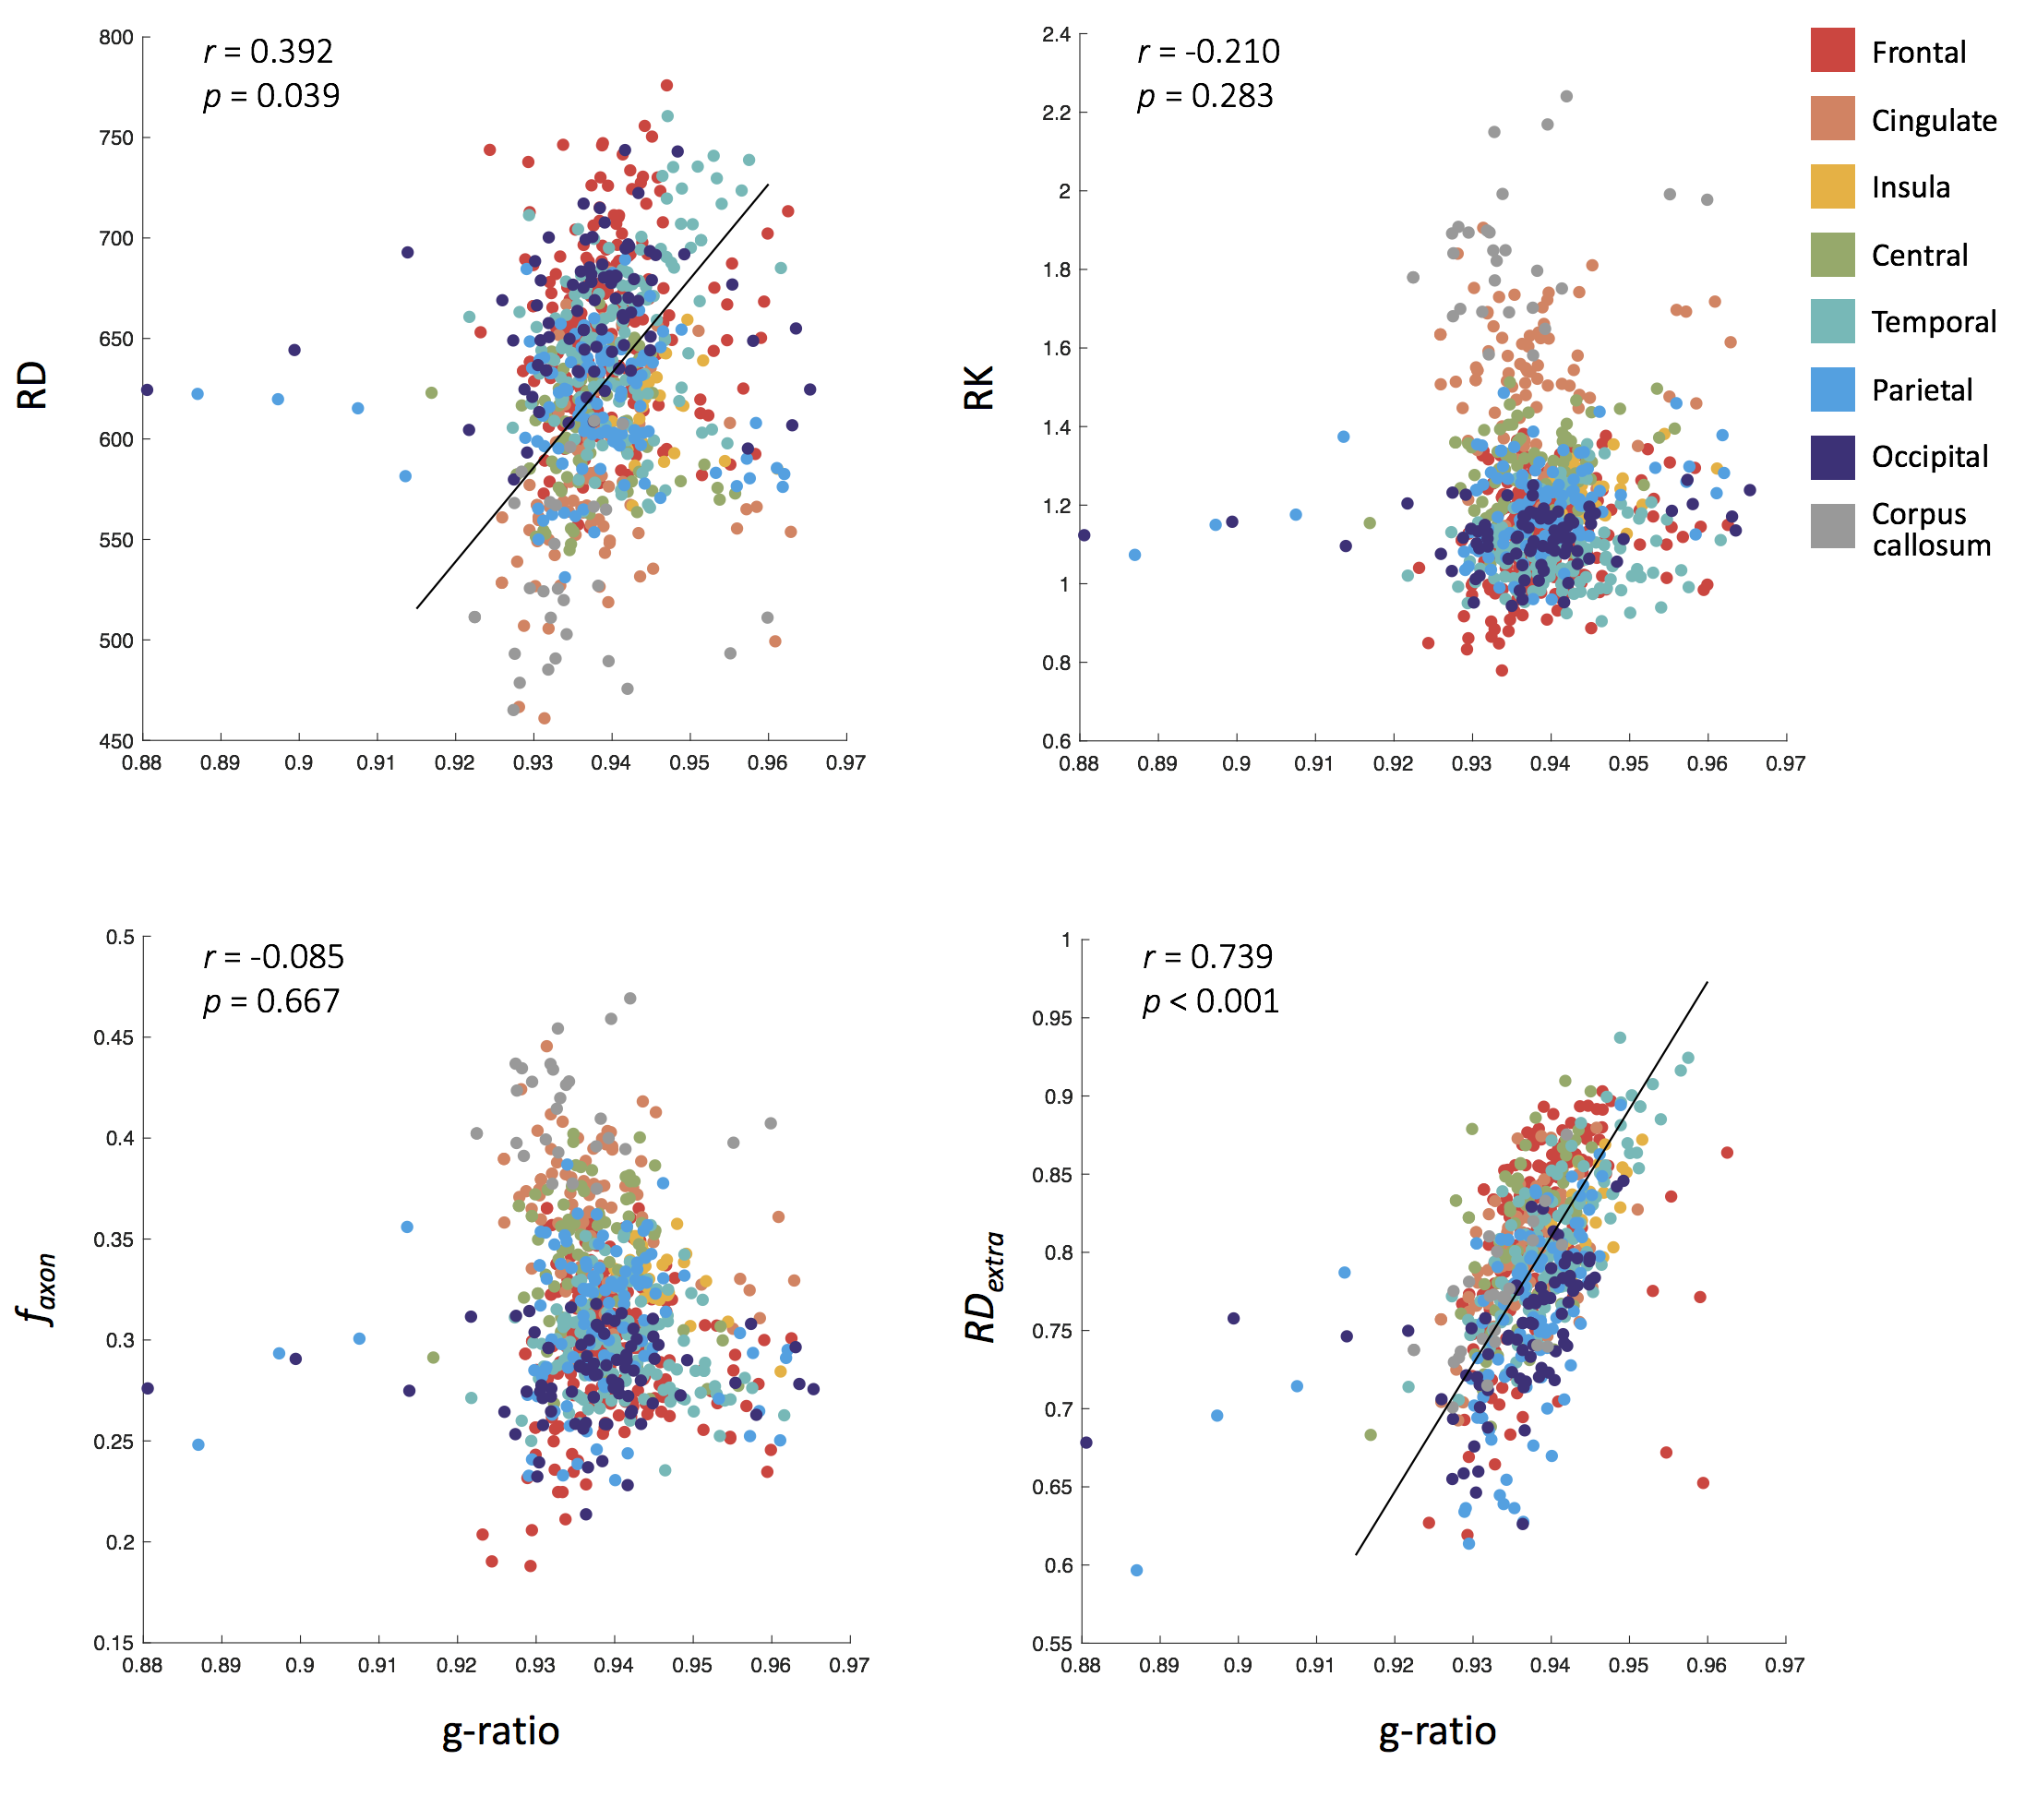
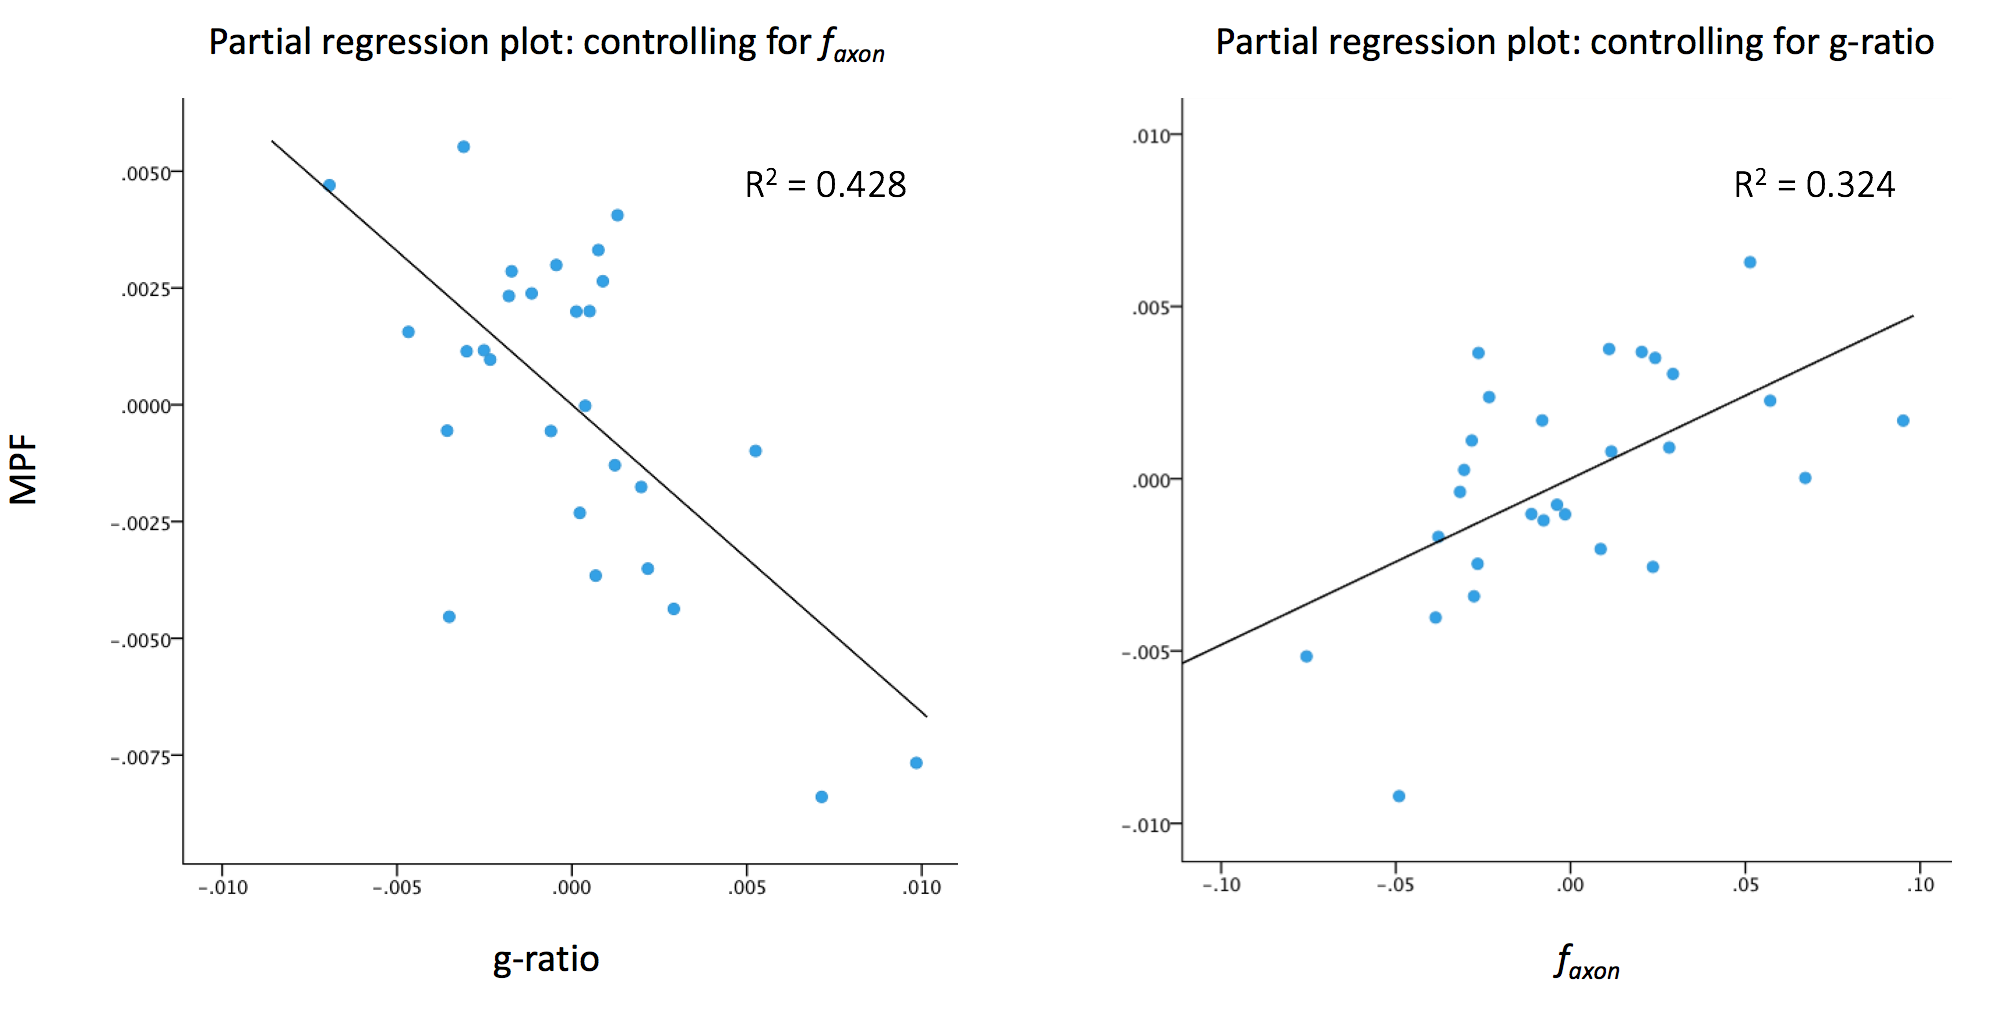
MPF was found to be significantly correlated with RD (p=.008), RK (p=.019), and faxon (p=.006) in white matter regions (Fig 2). g-ratio, on the other hand, was significantly correlated with RDextra (p<.001) and moderately related to RD (p=.039) (Fig 3). Regression analysis showed that faxon and g-ratio together explained 57.3% (p<.001) of the variance in MPF, with both being significant predictors in the model (Fig 4).Discussion
The correlation analyses presented here support the hypotheses that g-ratio and RDextra are specific to the relative amount of myelin per axon and that MPF is reflective of both axonal density and myelin thickness. While MPF’s sensitivity to overall myelin content has been confirmed by histological studies [10], data on RDextra as a myelin-specific marker have been mixed [11,12]. Our results suggest that RDextra is more specific to axonal myelination, as described by g-ratio, than RD (Fig 3). We note that results presented here are limited to healthy white matter and a relatively homogeneous population (young adults). Future studies will aim to assess these relationships in more complex pathological white matter and evaluate the effects of various pathologies on quantitative myelin markers from MRI.Conclusion
Detection of the specific microstructural substrates affected by various neurological disorders is essential to the development of appropriate treatments. Using multimodal imaging, the current study informs upon the specificity of several MRI metrics to the relative amount of myelin content per axon and axonal density.Acknowledgements
The study was supported by the National Institute of Health awards R01 MH108962 and R01 EB027087. We thank all of our participants for contributing to the study.References
1. Fields, R. D. (2008). White matter in learning, cognition and psychiatric disorders. Trends in neurosciences, 31(7), 361-370.
2. Yarnykh, V. L. (2012). Fast macromolecular proton fraction mapping from a single off‐resonance magnetization transfer measurement. Magnetic resonance in medicine, 68(1), 166-178.
3. Mossahebi, P., Yarnykh, V. L., & Samsonov, A. (2014). Analysis and correction of biases in cross‐relaxation MRI due to biexponential longitudinal relaxation. Magnetic resonance in medicine, 71(2), 830-838.
4. Samsonov, A. A., Mossahebi, P., Anderson, A., Velikina, J. V., Johnson, K. M., Johnson, S. C., Fleming, J. O., & Field, A. S. (2014). High Resolution, Motion Corrected Mapping of Macromolecular Proton Fraction (MPF). Clinically Acceptable Time Using 3D Undersampled Radials. In Proc of ISMRM (p. 3337).
5. Jensen, J. H., Helpern, J. A., Ramani, A., Lu, H., & Kaczynski, K. (2005). Diffusional kurtosis imaging: the quantification of non-gaussian water diffusion by means of magnetic resonance imaging. Magnetic resonance in medicine, 53(6), 1432-1440.
6. Jensen, J. H., & Helpern, J. A. (2010). MRI quantification of non-Gaussian water diffusion by kurtosis analysis. NMR Biomed, 23(7), 698-710.
7. Fieremans, E., Jensen, J. H., & Helpern, J. A. (2011). White matter characterization with diffusional kurtosis imaging. Neuroimage, 58(1), 177-188.
8. Lazar, M., Miles, L. M., Babb, J. S., & Donaldson, J. B. (2014). Axonal deficits in young adults with High Functioning Autism and their impact on processing speed. Neuroimage: Clinical, 4, 417-425.
9. West, K. L., Kelm, N. D., Carson, R. P., Alexander, D. C., Gochberg, D. F., & Does, M. D. (2018). Experimental studies of g-ratio MRI in ex vivo mouse brain. Neuroimage, 167, 366-371.
10. Khodanovich, M. Y., Sorokina, I. V., Glazacheva, V. Y., Akulov, A. E., Nemirovich-Danchenko, N. M., Romashchenko, A. V., . . . Yarnykh, V. L. (2017). Histological validation of fast macromolecular proton fraction mapping as a quantitative myelin imaging method in the cuprizone demyelination model. Scientific Reports, 7, 46686.
11. Jelescu, I. O., Zurek, M., Winters, K. V., Veraart, J., Rajaratnam, A., Kim, N. S., . . . Fieremans, E. (2016). In vivo quantification of demyelination and recovery using compartment-specific diffusion MRI metrics validated by electron microscopy. Neuroimage, 132, 104-114.
12. Kelm, N. D., West, K. L., Carson, R. P., Gochberg, D. F., Ess, K. C., & Does, M. D. (2016). Evaluation of diffusion kurtosis imaging in ex vivo hypomyelinated mouse brains. Neuroimage, 124(Pt A), 612-626.
Figures