0114
Comparison of Myelin- and Axon-Specific Imaging Modalities in Multiple Sclerosis11Division of Biomedical Engineering, Hankuk University of Foreign Studies, Yongin, Korea, Republic of, 2Lerner Research Institute, The Cleveland Clinic, Cleveland, OH, United States, 3Neurological Institute, The Cleveland Clinic, Cleveland, OH, United States, 4The Cleveland Clinic, Cleveland, OH, United States
Synopsis
Multiple sclerosis (MS) is a chronic disease characterized by demyelination and neuronal/axonal pathology. Based on postmortem MRI-pathology correlations lesions found on conventional MRI do not exhibit expected demyelination. There is a need for imaging modalities that have better specificity for myelin, axonal density and axonal health. We compare the properties of fast variants of myelin-specific modalities (myelin water imaging, quantitative magnetization transfer and visualization of short transverse relaxation component) and of axon-specific measures from neurite orientation dispersion and density imaging. These comparisons constitute steps toward developing better imaging biomarkers for MS pathology.
Introduction
Multiple sclerosis (MS) is a chronic disease characterized by demyelination and neuronal/axonal pathology. Based on postmortem MRI-pathology correlations, 55% of cerebral white matter regions of interest (ROIs) abnormal by only T2-weighted (T2w) MR are demyelinated1. In contrast, 85% of T1T2MTR (defined as being collectively abnormal of T1-weighted (T1w), T2w and and magnetization transfer ratio (MTR)) are demyelinated. Normalized T1w and MTR intensities in these T1T2MTR ROIs are influenced by the density and diameter of the demyelinated axons1. There is a need, therefore, for imaging modalities that have better specificity for myelin, axonal density and axonal health. We compare the properties of fast variants of myelin-specific modalities: myelin water imaging (MWI)2,3, quantitative magnetization transfer (qMT)4,5 and visualization of short transverse relaxation component (ViSTa)6. We also compare axon-specific measures from neurite orientation dispersion and density imaging (NODDI)7. These comparisons constitute steps toward developing better imaging biomarkers for MS pathology.Methods
In this IRB-approved study, three MS patients were scanned within hours of death (mean 6.5h, range 3.5-11.4h) on a Siemens 3T Prisma with a standard 20-channel head coil (Siemens Medical Solutions, Erlangen). Multi-echo spin-echo based MWI3, fast qMT5, ViSTA6 and NODDI7 were acquired at 1.5x1.5x4mm3 resolution. An MP2RAGE acquisition8 at the same spatial resolution was acquired to provide T1 maps for calculating macromolecular proton fraction for qMT and to facilitate alignment to T2 and T1T2MTR lesions detected on conventional images. Each modality involves different assumptions about myelin. Myelin water fraction, measured by MWI, is assigned to the short T2 component in a biexponential fit. ViSTa selects the short T1 component of the MR signal, which correlates with the short T2 component measured by MWI. qMT accounts for variability due to RF-related factors such as flip angle and frequency offset, resulting in a quantitative version of MTR—macromolecular proton fraction. Each provides a measure which we will generically refer to as predicted myelin density (PMD). NODDI provides two measures of axon integrity: restricted volume fraction (vr)9 and orientation dispersion index (ODI). Restricted volume fraction is constructed to represent the fractional volume occupied by axons while ODI measures the orientational coherence of axons, and we will generically refer to these as axon integrity. All measures were compared in T2-only (regions that are abnormal on T2w but not on T1T2MTR) and T1T2MTR lesions.Results
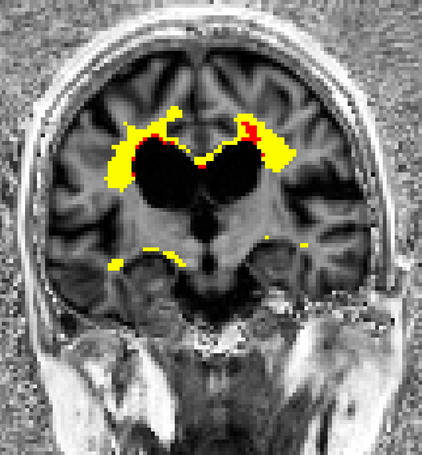
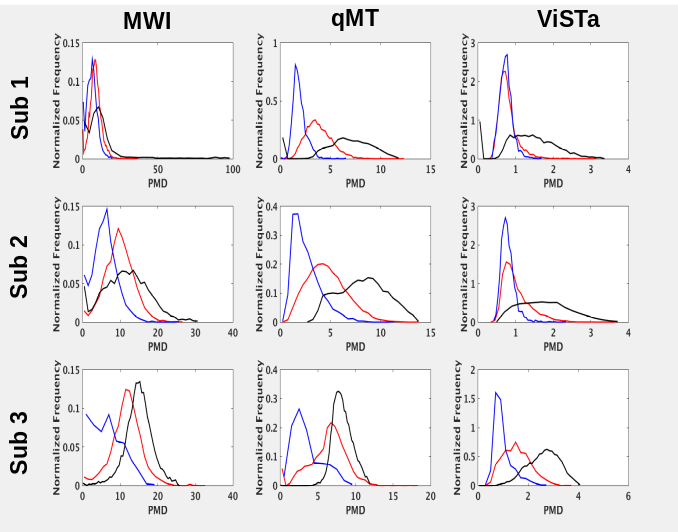
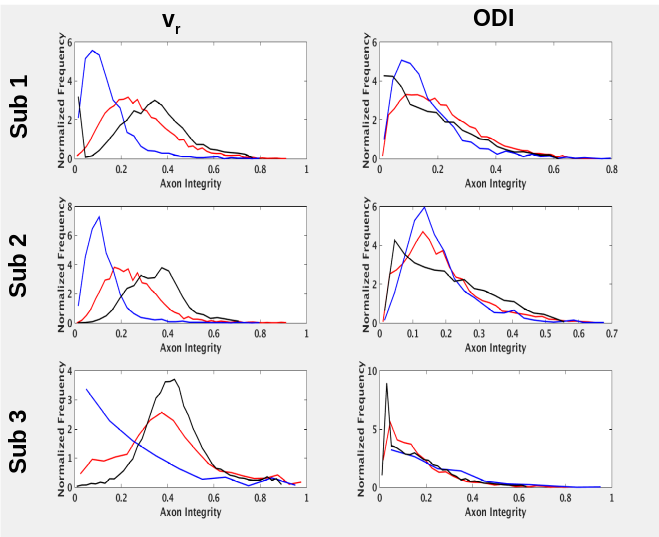
Figure 1 shows T2-only and T1T2MTR lesions in one subject. Figure 2 shows normalized histograms of AMD in T2-only, T1T2MTR lesions and in normal appearing white matter (NAWM). In subjects 1 and 2, ViSTa shows overlap in values in T2 and in T1T2MTR lesions, qMT shows more distinct separation and MWI shows partial separation. Figure 3 shows normalized histograms of axon integrity. ODI shows strong overlap between T1T2MTR lesions and T2 lesions while vr shows stronger differences.Discussion and Conclusion
These different imaging modalities detect distinct features
of lesions that are likely to reflect myelin and axonal content/health. The
overlap in the histograms for subjects 1 and 2 for ViSTa suggest that the
cellular properties in T2-only and T1T2MTR lesions are similar while qMT
predicts differences. Similarly, ODI predicts similar levels of axon injury in
T2 and T1T2MTR lesions while vr
predicts differences. Overlap of PMD and axon integrity values between NAWM and
lesions may indicate the degree to which the imaging measures lack specificity
to myelin and axon integrity. These predictions will be investigated by correlating
histopathology and MRI changes in individual ROI’s. More sensitive detection of
myelin and axons will help define the sequence of pathological changes in MS
brains and will be required to reliably test future remyelinating and
axon-preserving therapies.
Acknowledgements
The tissue procurement program was funded by NIH R01EB016728-01A1, NIH National Institute of Neurological Disorders and Stroke P01 NS38667, and NIH National Institute of Neurological Disorders and Stroke R35NS09730. We thank Siemens Medical Solutions for source code. We thank Tobias Kober and Bénédicte Maréchal of Siemens Medical Solutions for WIP900B.References
1. Fisher, E., Chang, A., Fox, R. J., Tkach, J. A., Svarovsky, T., Nakamura, K., Rudick, R. A. & Trapp, B. D. Imaging correlates of axonal swelling in chronic multiple sclerosis brains. Ann Neurol 2007; 62(219-228.
2. MacKay, A., Whittall, K., Adler, J., Li, D., Paty, D. & Graeb, D. In vivo visualization of myelin water in brain by magnetic resonance. Magn Reson Med 1994; 31(6):673-677.
3. Oh, S. H., Choi, J. Y., Im, Y., Prasloski, T. & J., L. in Proceedings 23rd Scientific Meeting, International Society for Magnetic Resonance in Medicine. 3143.
4. Sled, J. G. & Pike, G. B. Quantitative interpretation of magnetization transfer in spoiled gradient echo MRI sequences. J Magn Reson 2000; 145(1):24-36.
5. Oh, S. & Lowe, M. in Proceedings 25th Scientific Meeting, International Society for Magnetic Resonance in Medicine. 4738.
6. Oh, S. H., Bilello, M., Schindler, M., Markowitz, C. E., Detre, J. A. & Lee, J. Direct visualization of short transverse relaxation time component (ViSTa). Neuroimage 2013; 83(485-492.
7. Zhang, H., Schneider, T., Wheeler-Kingshott, C. A. & Alexander, D. C. NODDI: practical in vivo neurite orientation dispersion and density imaging of the human brain. Neuroimage 2012; 61(4):1000-1016.
8. Marques, J. P., Kober, T., Krueger, G., van der Zwaag, W., Van de Moortele, P. F. & Gruetter, R. MP2RAGE, a self bias-field corrected sequence for improved segmentation and T1-mapping at high field. Neuroimage 2010; 49(2):1271-1281.
9. Grussu, F., Schneider, T., Zhang, H., Alexander, D. C. & Wheeler-Kingshott, C. A. Neurite orientation dispersion and density imaging of the healthy cervical spinal cord in vivo. Neuroimage 2015; 111(590-601.
Figures