0113
Volumetric Imaging of Myelin in Vivo using 3D Inversion-Recovery Ultrashort Echo Time Cones (3D IR-UTE-Cones) Magnetic Resonance Imaging1Radiology, University of California, San Diego, San Diego, CA, United States, 2VA San Diego Healthcare System, San Diego, CA, United States, 3Neurosciences, University of California, San Diego, San Diego, CA, United States
Synopsis
To image myelin directly for whole brain on clinical scanners which would provide better characterization of multiple sclerosis (MS) lesions at diagnosis and in response to therapy, we propose a 3D adiabatic inversion recovery prepared ultrashort echo time cones (3D IR-UTE-Cones) sequence for volumetric myelin imaging in vivo with a clinical feasible scan time. The myelin imaging show clearly signal loss in MS lesions for both ex vivo and in vivo brain studies.
Introduction
Current myelin imaging in MR imaging mainly focused on indirect techniques, such as magnetization transfer and multi-T2 component analysis due to the invisible myelin signal in clinical FSE and GRE sequences 1,2. Recently, 2D ultrashort echo time (UTE) techniques with long T2 suppression have been used for direct myelin imaging, which are promising to better characterize of multiple sclerosis (MS) lesions at diagnosis and in response to therapy 3,4. However, 2D UTE techniques is a single slice technique and suffered out-slice excitation due to eddy currents, which is very hard for whole brain coverage and thus impractical for clinical use. To overcome these challenges in the 2D UTE based myelin imaging, we proposed a 3D adiabatic inversion recovery prepared ultrashort echo time cones (3D IR-UTE-Cones) sequence for volumetric myelin imaging in vivo with a clinical feasible scan time.Methods
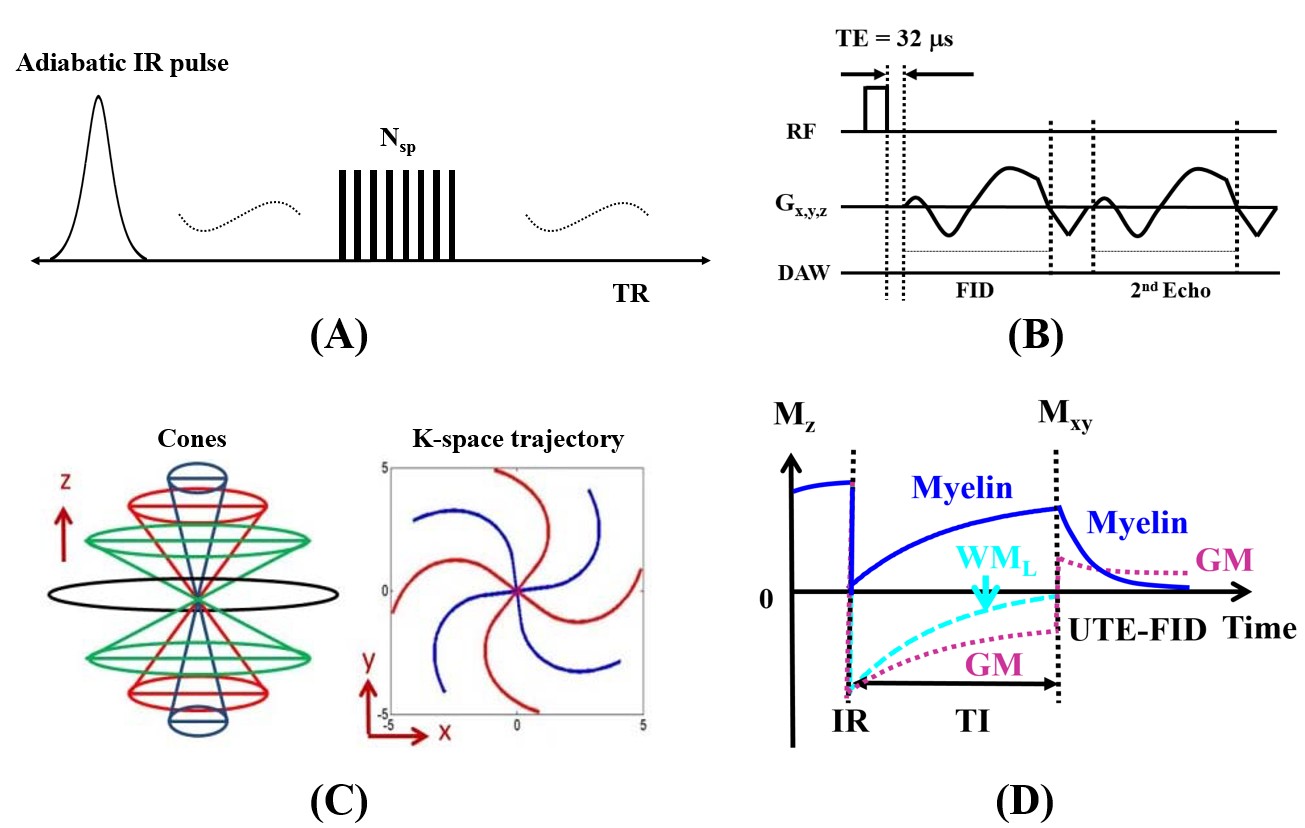
For efficient volumetric imaging of myelin, multiple UTE acquisitions (specified by the number of spokes (Nsp)) are obtained after each IR preparation (Figure 1A), with inversion time (TI) defined as the average spoke TI. Since short T2 components such as myelin are effectively saturated following adiabatic IR pulses, the achieved SNR is highly dependent on TI. Each UTE acquisition (Figure 1B) uses a short, hard radiofrequency pulse for non-selective excitation. A second echo is also obtained after extinction of the myelin signal. The spiral trajectories have conical ordering for more efficient sampling of 3D k-space than radial trajectories 5 and can have an anisotropic FOV for higher in-plane resolution and thicker slices (Figure 1C). The combination of 3D conical trajectories and multispoke acquisition allows for volumetric imaging of myelin in a time efficient manner. By choosing a TI such that the long-T2 signal in white matter is nulled (Figure 1D), the remaining UTE signal in white-matter tracts will be from short T2 components, namely myelin. Dual-echo subtraction diminishes residual long T2 signals and grey matter 3,4.
Four cadaveric heads (Two normal and two MS patients (normal: 82 years old male and 87 years old female; MS: 45 years old male and 56 years old female)) were obtained from a nonprofit whole-body donation company (United Tissue Network, Phoenix, AZ). After imaging, the specimen was refrozen at -80°C and then cut into 1 cm axial sections using a Delta ShopMaster band saw (Delta Machinery, Tennessee, USA). Biopsies were taken from regions of interest identified on review of the images and fixed in zinc formalin for histology. 12 healthy volunteers (ages 25-69, 6 women and 6 men) and 12 MS patients (ages 39-71, 9 women and 3 men) were recruited for this study. Written informed consent approved by the IRB was obtained prior to the participation of each subject. A 12-channel receive only head coil was used for all human brains. The 3D IR-UTE-Cones sequence parameters are shown as follows: TR = 1000 ms, TI between 320ms and 330ms, TE = 0.032/2.2 ms, Nsp = 21, tau = 7.1 ms, FA = 20°, BW = 250 kHz, FOV = 22×22×15.1 cm3, matrix = 192×192×42, scan time = 8.3 min. TI was experimentally determined, which is around 325 ms. Clinical T2 and T1 weighted sequences were also used for comparison.
Results and Discussion
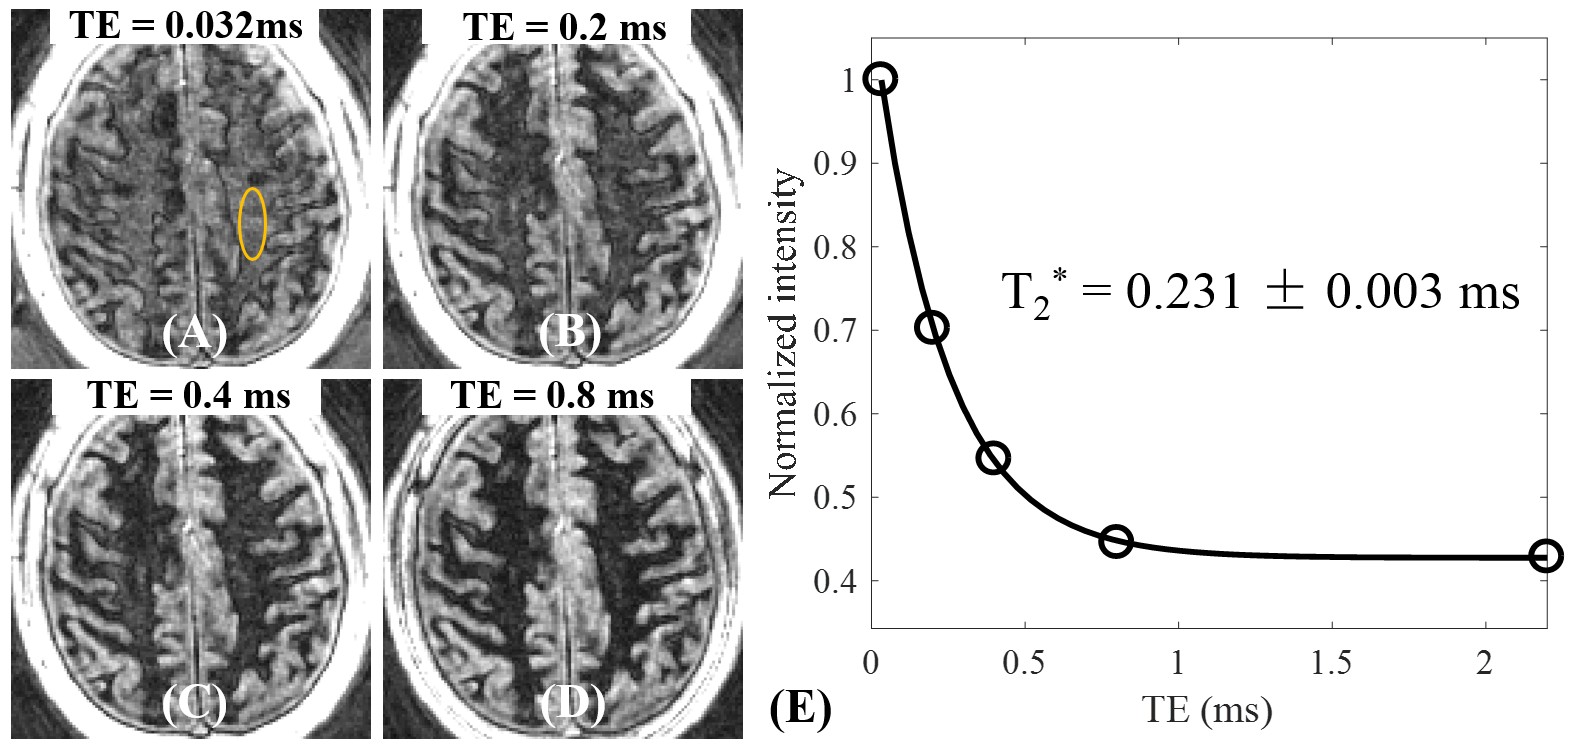
3D IR-UTE-Cones of healthy volunteers demonstrates signal in the white matter which decreases to near-background levels at the second echo (Figure 2). The persistent grey matter signal is due to longer T1 relaxation and is effectively suppressed using dual-echo subtraction, resulting in 3D volumetric images with high myelin contrast. The SNR of the myelin signal in the first echo image is around 20. The T2* measured in the corpus callosum of a healthy volunteer demonstrated excellent fitting to a single-component model and was 0.231 ± 0.003 ms (Figure 3).
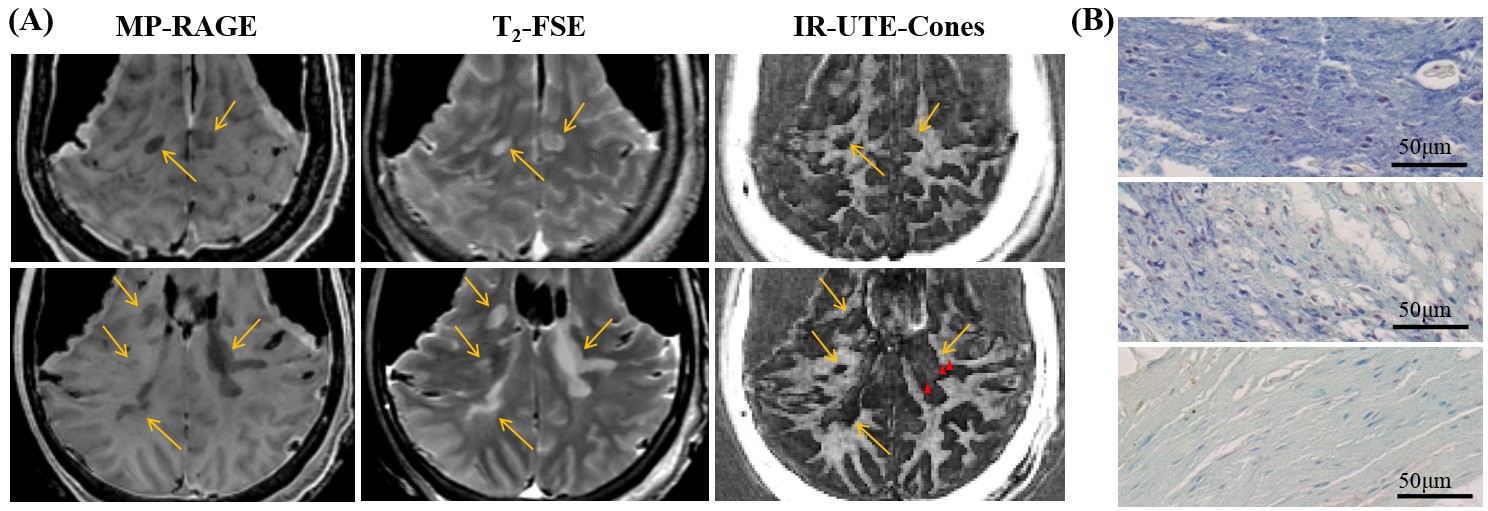
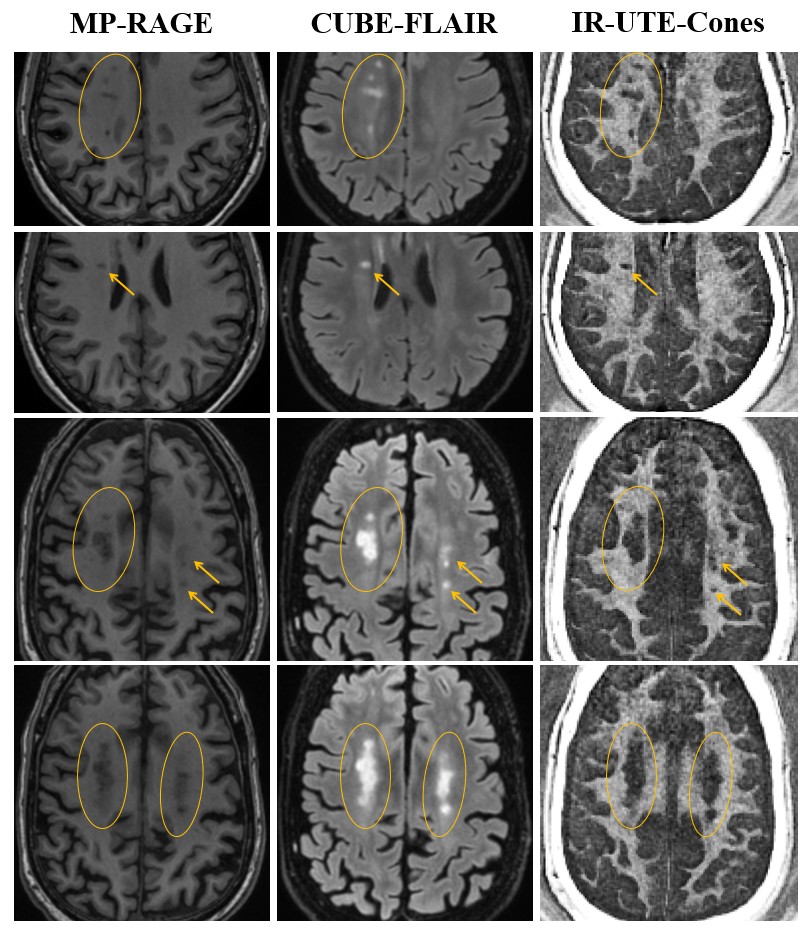
Comparisons of typical clinical sequences and the proposed IR-UTE-Cones sequences in the ex vivo MS brain study are shown in Figure 4. MS lesions identified in the clinical images show myelin signal loss in corresponding regions in the IR-UTE-Cones images, with representative lesions confirmed to be demyelinated by histology. Figure 5 shows IR-UTE-Cones imaging and clinical T1 and T2 weighted imaging for two representative MS patients. Similar to ex vivo study, myelin signal loss in MS lesion regions can be found in IR-UTE-Cones images for the two MS patients. Both the ex vivo and in vivo MS brain study demonstrated that the proposed IR-UTE-Cones sequence can directly detect myelin loss in MS lesions.
Conclusion
The 3D IR-UTE-Cones signal has the potential to be used for volumetric myelin imaging on clinical 3T scanners, with a strong linear correlation with myelin concentration and detection of demyelinated lesions in MS patients.Acknowledgements
The authors acknowledge grant support from GE Healthcare, NIH (R01NS092650), and the VA Clinical Science and Rehabilitation R&D Awards (I01CX001388 and I01RX002604)References
1. Alonso-Ortiz E, Levesque IR, Pike GB (2015) MRI-based myelin water imaging: A technical review. Magn Reson Med 73(1):70-81.
2. Sussman MS, Pauly JM, Wright GA. Design of practical T2-selective RF excitation (TELEX) pulses. Magn Reson Med 1998;40:890–899.
3. Du J, Ma G, Li S, Carl M, Szeverenyi NM, VandenBerg S, Corey-Bloom J, Bydder GM (2014). Ultrashort echo time (UTE) magnetic resonance imaging of the short T2 components in white matter of the brain using a clinical 3T scanner. Neuroimage 15;87:32-41.
4. Sheth V, Shao H , Chen J, Vandenberg S, Corey-Bloom J. Bydder GM, Du J (2016) Magnetic resonance imaging of myelin using ultrashort Echo time (UTE) pulse sequences: phantom, specimen, volunteer and multiple sclerosis patient studies. Neuroimage 136, 37–44.
5. Carl M, Bydder GM, Du J. UTE imaging with simultaneous water and fat signal suppression using a time-efficient multispoke inversion recovery pulse sequence. Magn Reson Med 2016;76:577–582.
Figures