0108
3D chemical shift-encoded MRI for volume and composition quantification of abdominal adipose tissue during an overfeeding protocol in healthy volunteers1Univ Lyon, INSA‐Lyon, Université Claude Bernard Lyon 1, UJM-Saint Etienne, CNRS, Inserm, CREATIS UMR 5220, U1206, F69621, Lyon, France, 2Centre de Recherche en Nutrition Humaine Rhône-Alpes (CRNH-RA), Centre Hospitalier Lyon Sud, Pierre-Bénite, Lyon, France, 3Institut National de la Santé et de la Recherche Médicale Unit 1060, CarMeN Laboratory, Lyon 1 University, Oullins, France, 4Department of Physiology, Faculty of Biology and Medicine, University of Lausanne, Lausanne, France, 5Hospices Civils de Lyon, Département d'imagerie digestive, CHU Edouard Herriot, Lyon, France
Synopsis
The aim of this work was to assess chemical shift-encoded MRI (CSE-MRI) method to quantify content and composition changes of fat storage in healthy volunteers during a 31 days overfeeding protocol while comparing CSE-MRI results with DEXA, MRS and Gas chromatography measurements. A total of 21 volunteers underwent a NMR protocol at 3T with an axial 3D CSE-MRI on abdominal region and spectroscopy acquired on subcutaneous adipose tissue, visceral adipose tissue and liver. The NMR protocol was used to analyze the volume and the fatty acid composition of abdominal adipose tissues, and the fat content in the liver.
Introduction
Overweight and obesity are a major worldwide health concern characterized by an abnormal accumulation of fat in adipose tissue and liver1. While 1H MRI is well suited to evaluate subcutaneous (SAT) and visceral (VAT) adipose tissue volumes, Magnetic Resonance Spectroscopy (MRS) is able to provide proportions of saturated (SFA), monounsaturated (MUFA) or polyunsaturated (PUFA) fatty acids. Recent studies demonstrated the feasibility of assessing the composition of fat based on multiple gradient echo imaging2. Some studies3,4 focusing on liver diseases have extensively compared the MRS and MRI methodologies for the quantification of PDFF. To our knowledge, no study has compared in vivo the FA quantification of human adipose tissue from these two techniques. The fat content in the liver, the volume and the fatty acid (FA) composition of the subcutaneous adipose tissue (SAT) and the visceral adipose tissue (VAT) were followed using a single 3D CSE-MRI acquisition before and after an experimental overfeeding.Subjects and methods
A total of 21 non-obese healthy male volunteers underwent 31 days of high-sucrose and high-fat overfeeding and two NMR examinations (before and after overfeeding). The overfeeding protocol consisted of eating the equivalent of +50% of their daily energy requirements while maintaining their usual eating and sport activity habits. This protocol was registered on the clinicaltrials.gov site (NCT02145780). Only results from subjects with a placebo complement are reported.
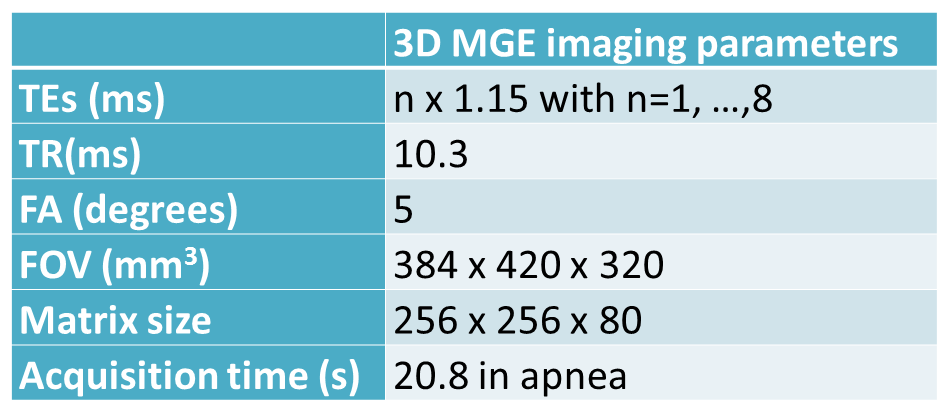
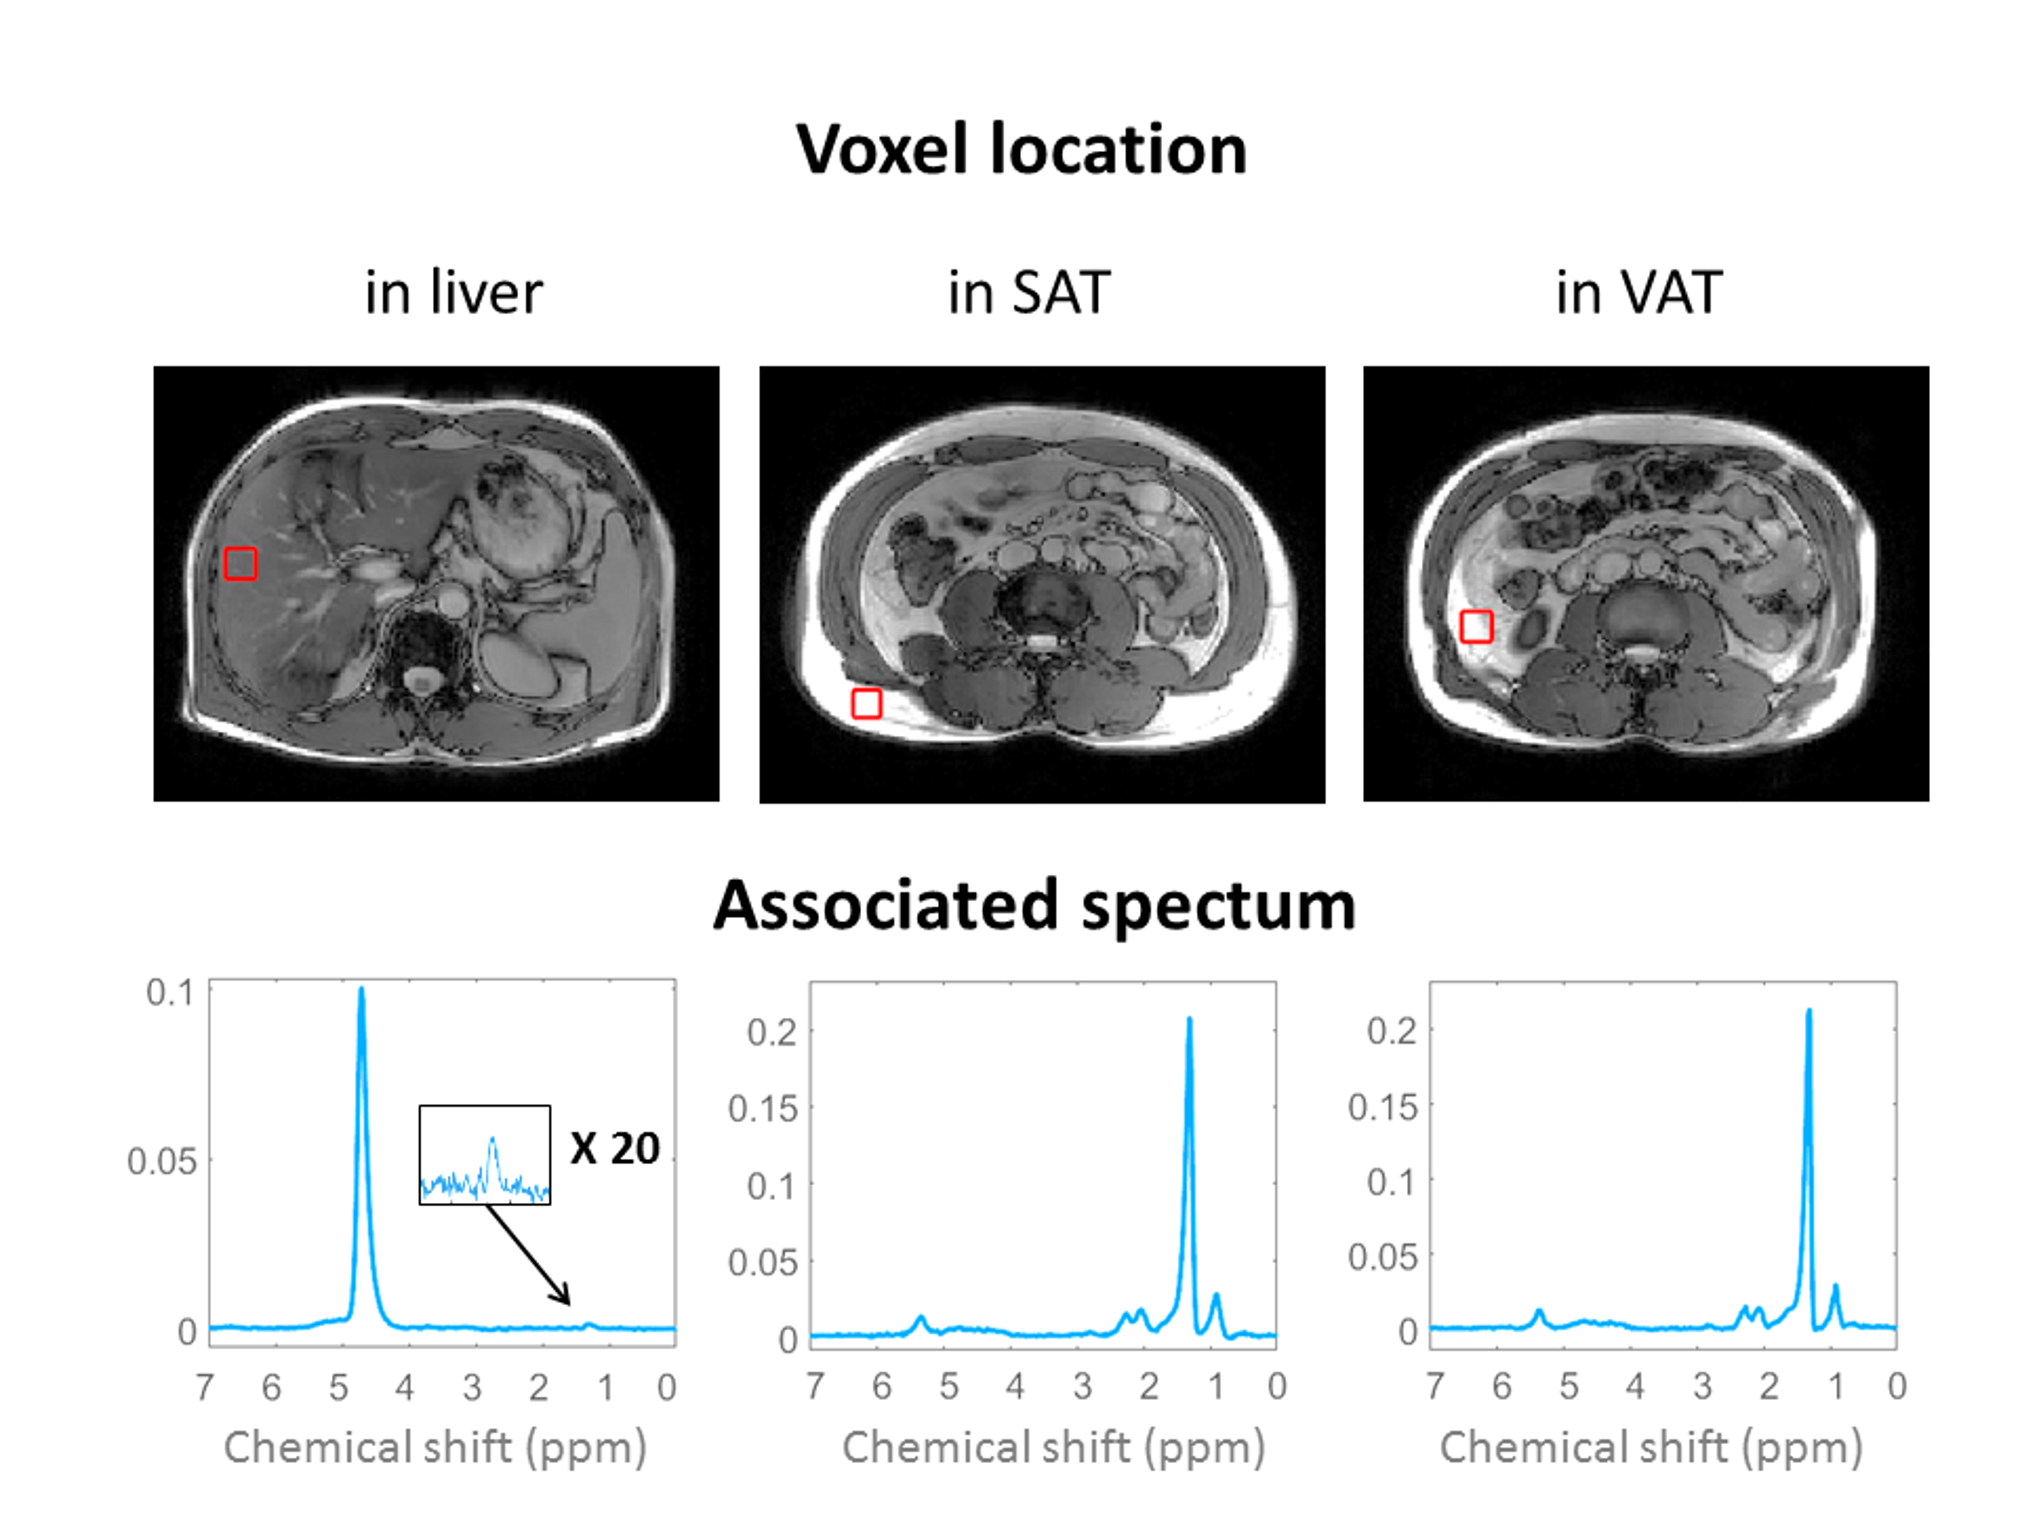
All volunteers underwent an imaging and spectroscopy protocol on a 3T Ingenia Philips system composed of an axial 3D CSE-MRI on abdominal region encompassing lumbar L1 to L5 and the liver (parameters table 1) and a set of three STEAM sequences acquired on SAT, VAT and liver (parameters in the caption of the Figure 1). This NMR protocol was used to assess the proton density fat fraction (PDFF) in the liver and the FA composition2,5 in SAT and VAT and volumes. Gas chromatography-mass spectrometry analyses were performed on 13 samples (seven before and six after the overfeeding intervention) of SAT to validate the FA composition. The FA composition was characterized by two parameters (the number of double bound: ndb and the number of methylene-interrupted double bound: nmidb)6. Indexes of the relative proportion of polyunsaturated FA (PUFAindx), monounsaturated FA (MUFAindx) and saturated FA (SFAindx) were derived from ndb and nmidb with the following relations7:
$$PUFA_{indx}=\frac{nmidb}{3}*100$$
$$MUFA_{indx}=\frac{(ndb-2*nmidb)}{3}*100$$
$$SFA_{indx}=100-PUFA_{indx}-MUFA_{indx}$$
Volume of adipose tissues was automatically segmented on CSE-MRI between L2 to L4 lumbar vertebrae and compared to the DEXA measurement in the corresponding region.
Results
An excellent correlation between CSE-MRI measurement of total adipose tissue TAT (SAT + VAT) and DEXA measurement of the android region (r = 0.98, P < 0.001, n = 18) was found. SAT and VAT volumes significantly increased between the two examinations (paired t-test: +91 cm3, p < 0.001; +129 cm3, p < 0.001). The ratio VAT/SAT also significantly increased after overfeeding (+0.06, p = 0.020).
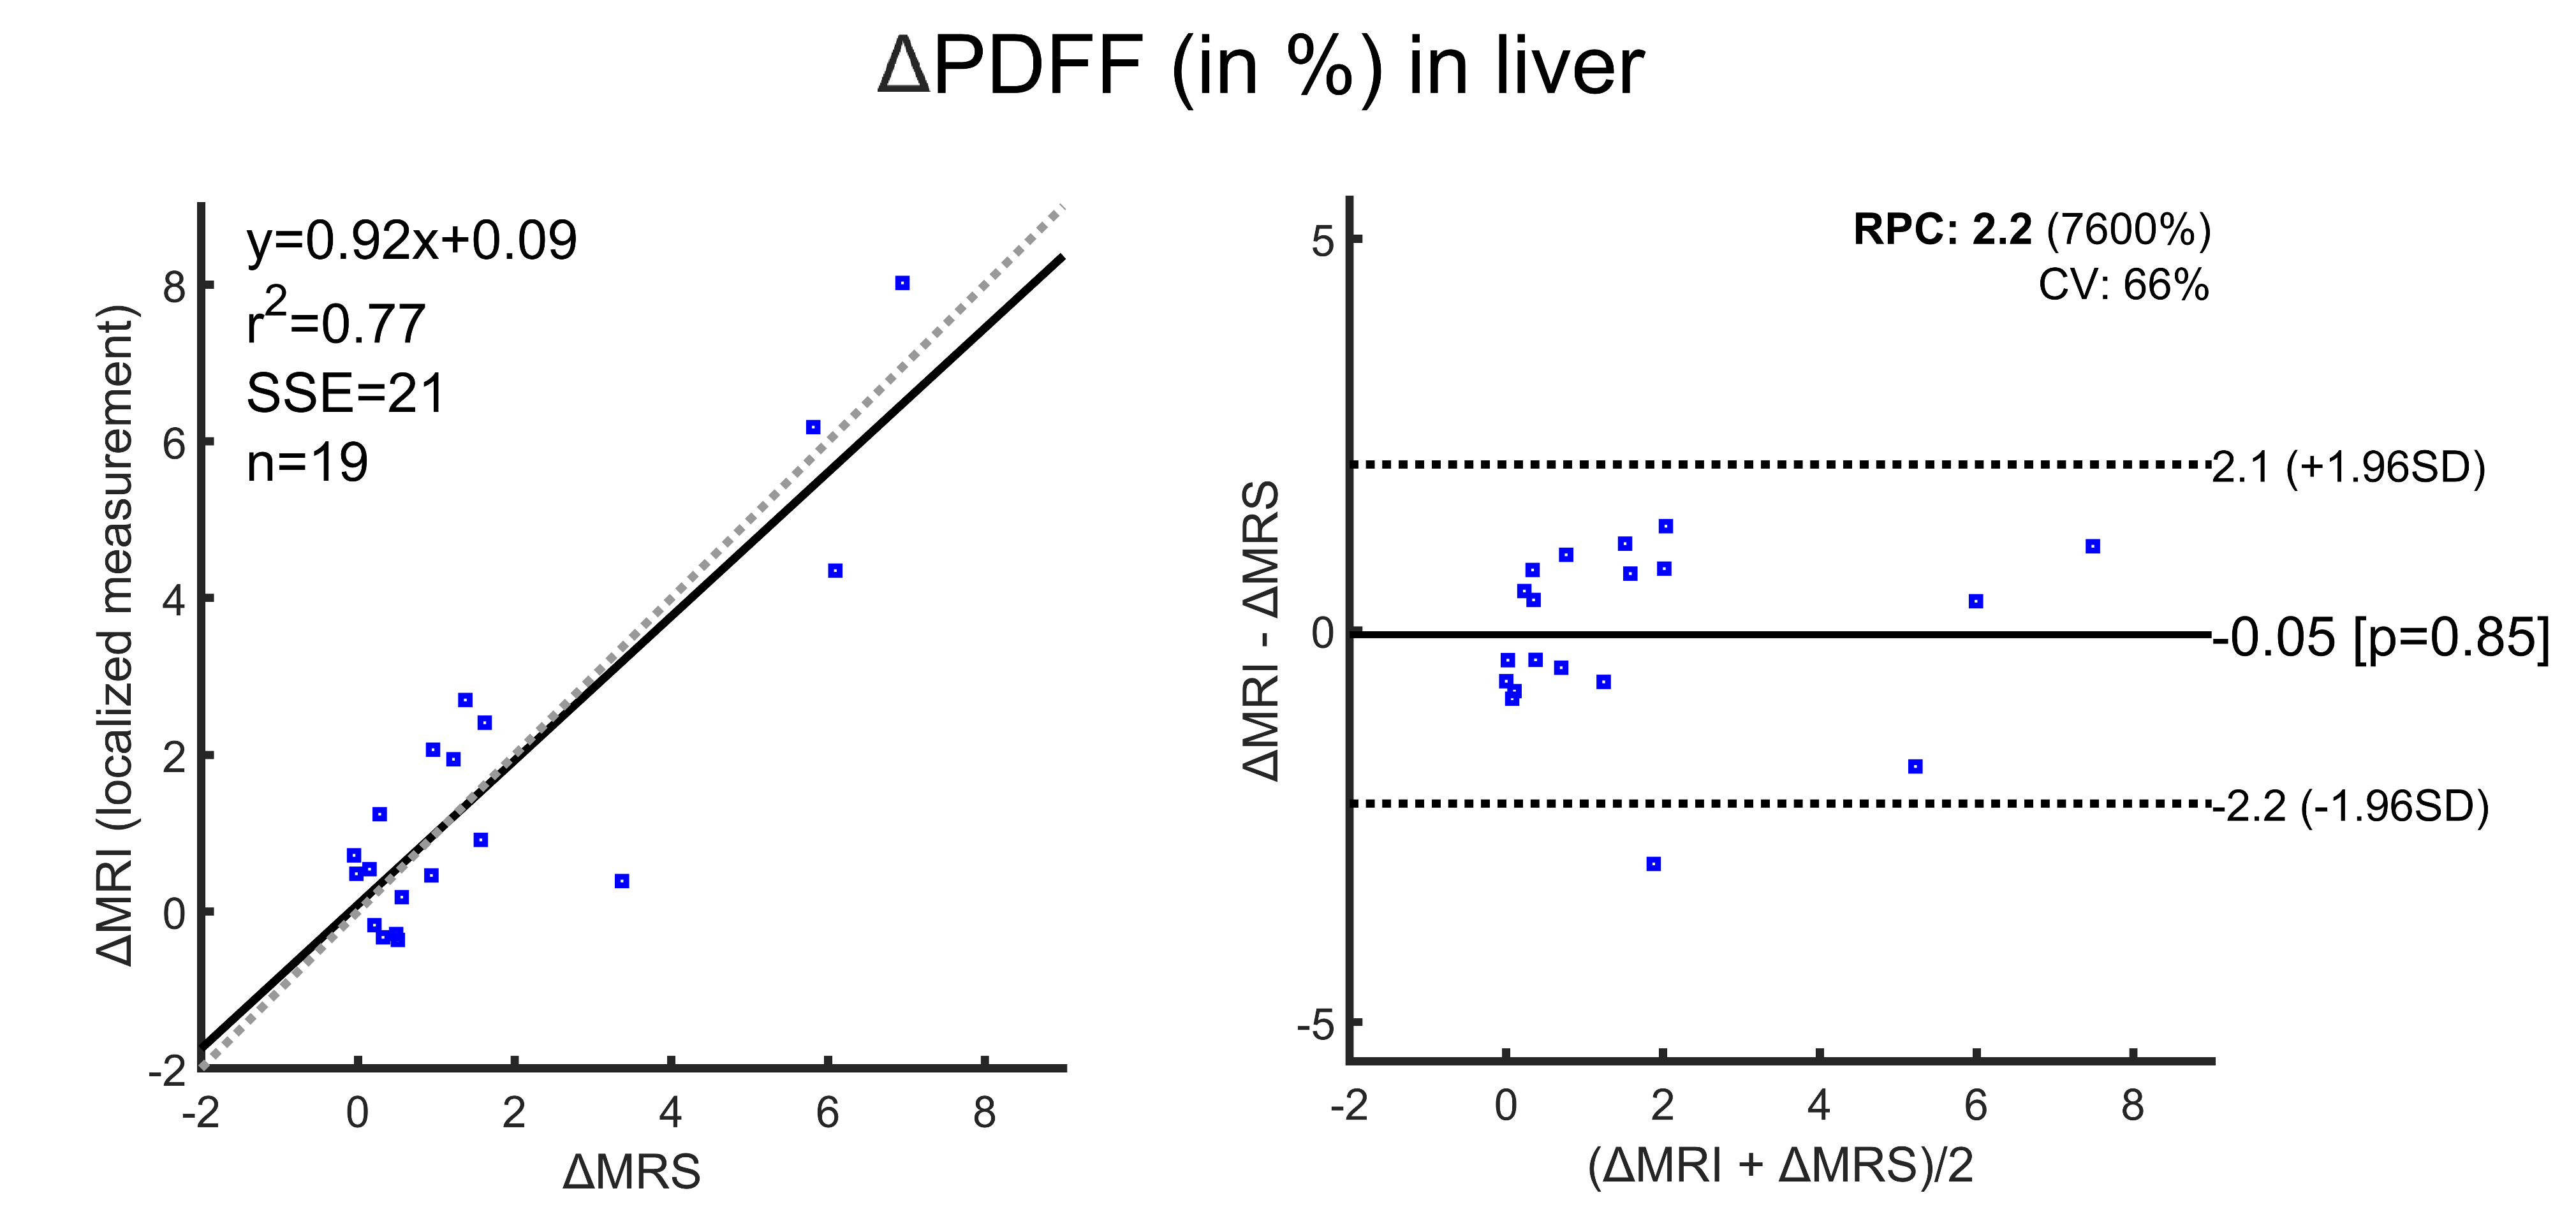
The PDFF significantly increased in the liver (MRS: +1.74, paired t-test, p = 0.002; CSE-MRI: +1.35 paired t-test, p = 0.002) after the overfeeding. Assessment of PDFF variations measured by MRS or CSE-MRI were found to be similar and non-significantly different (p = 0.85, figure 2).
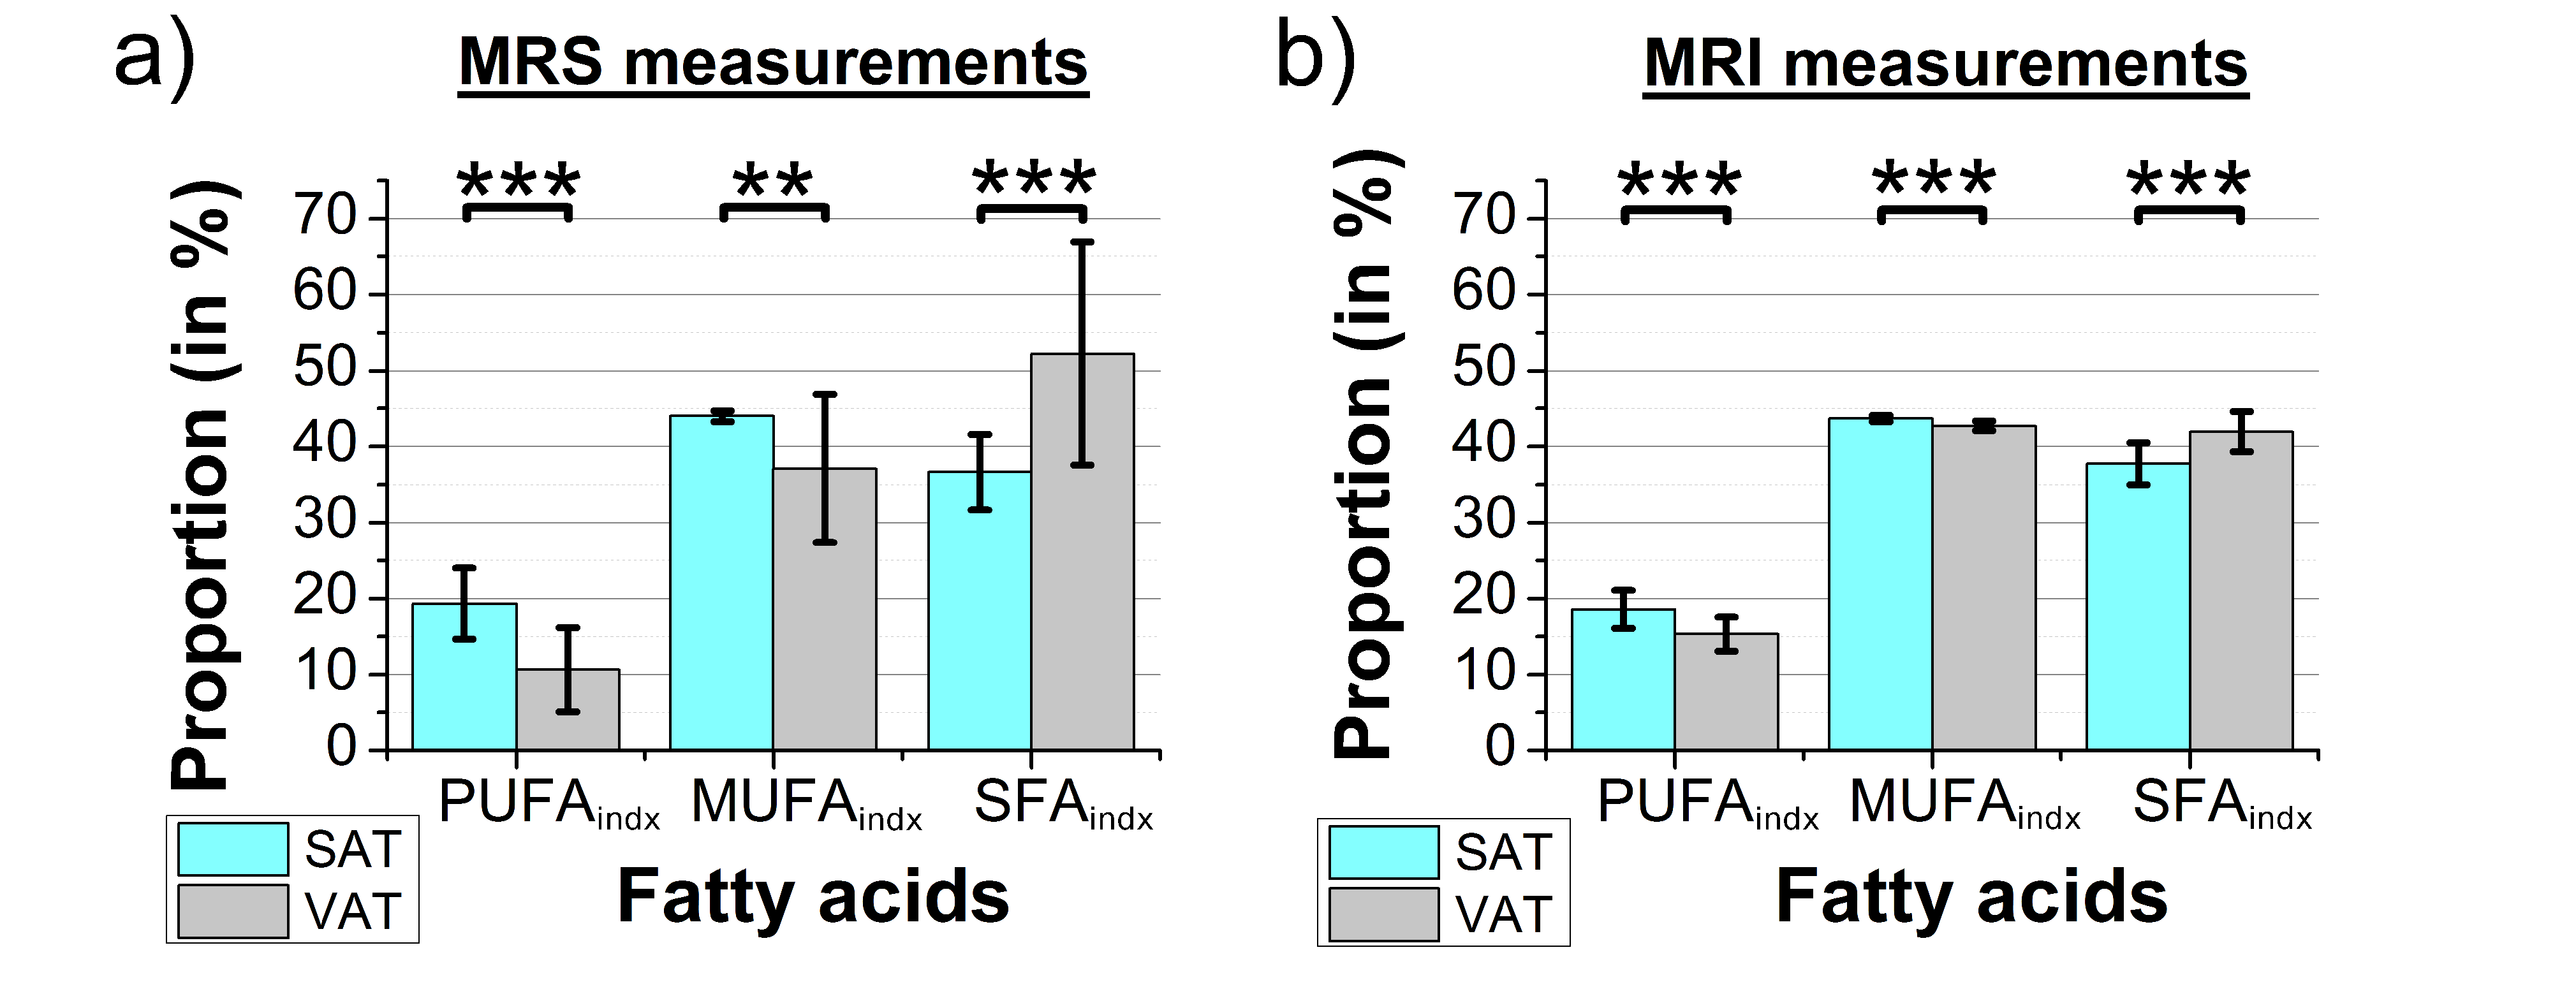
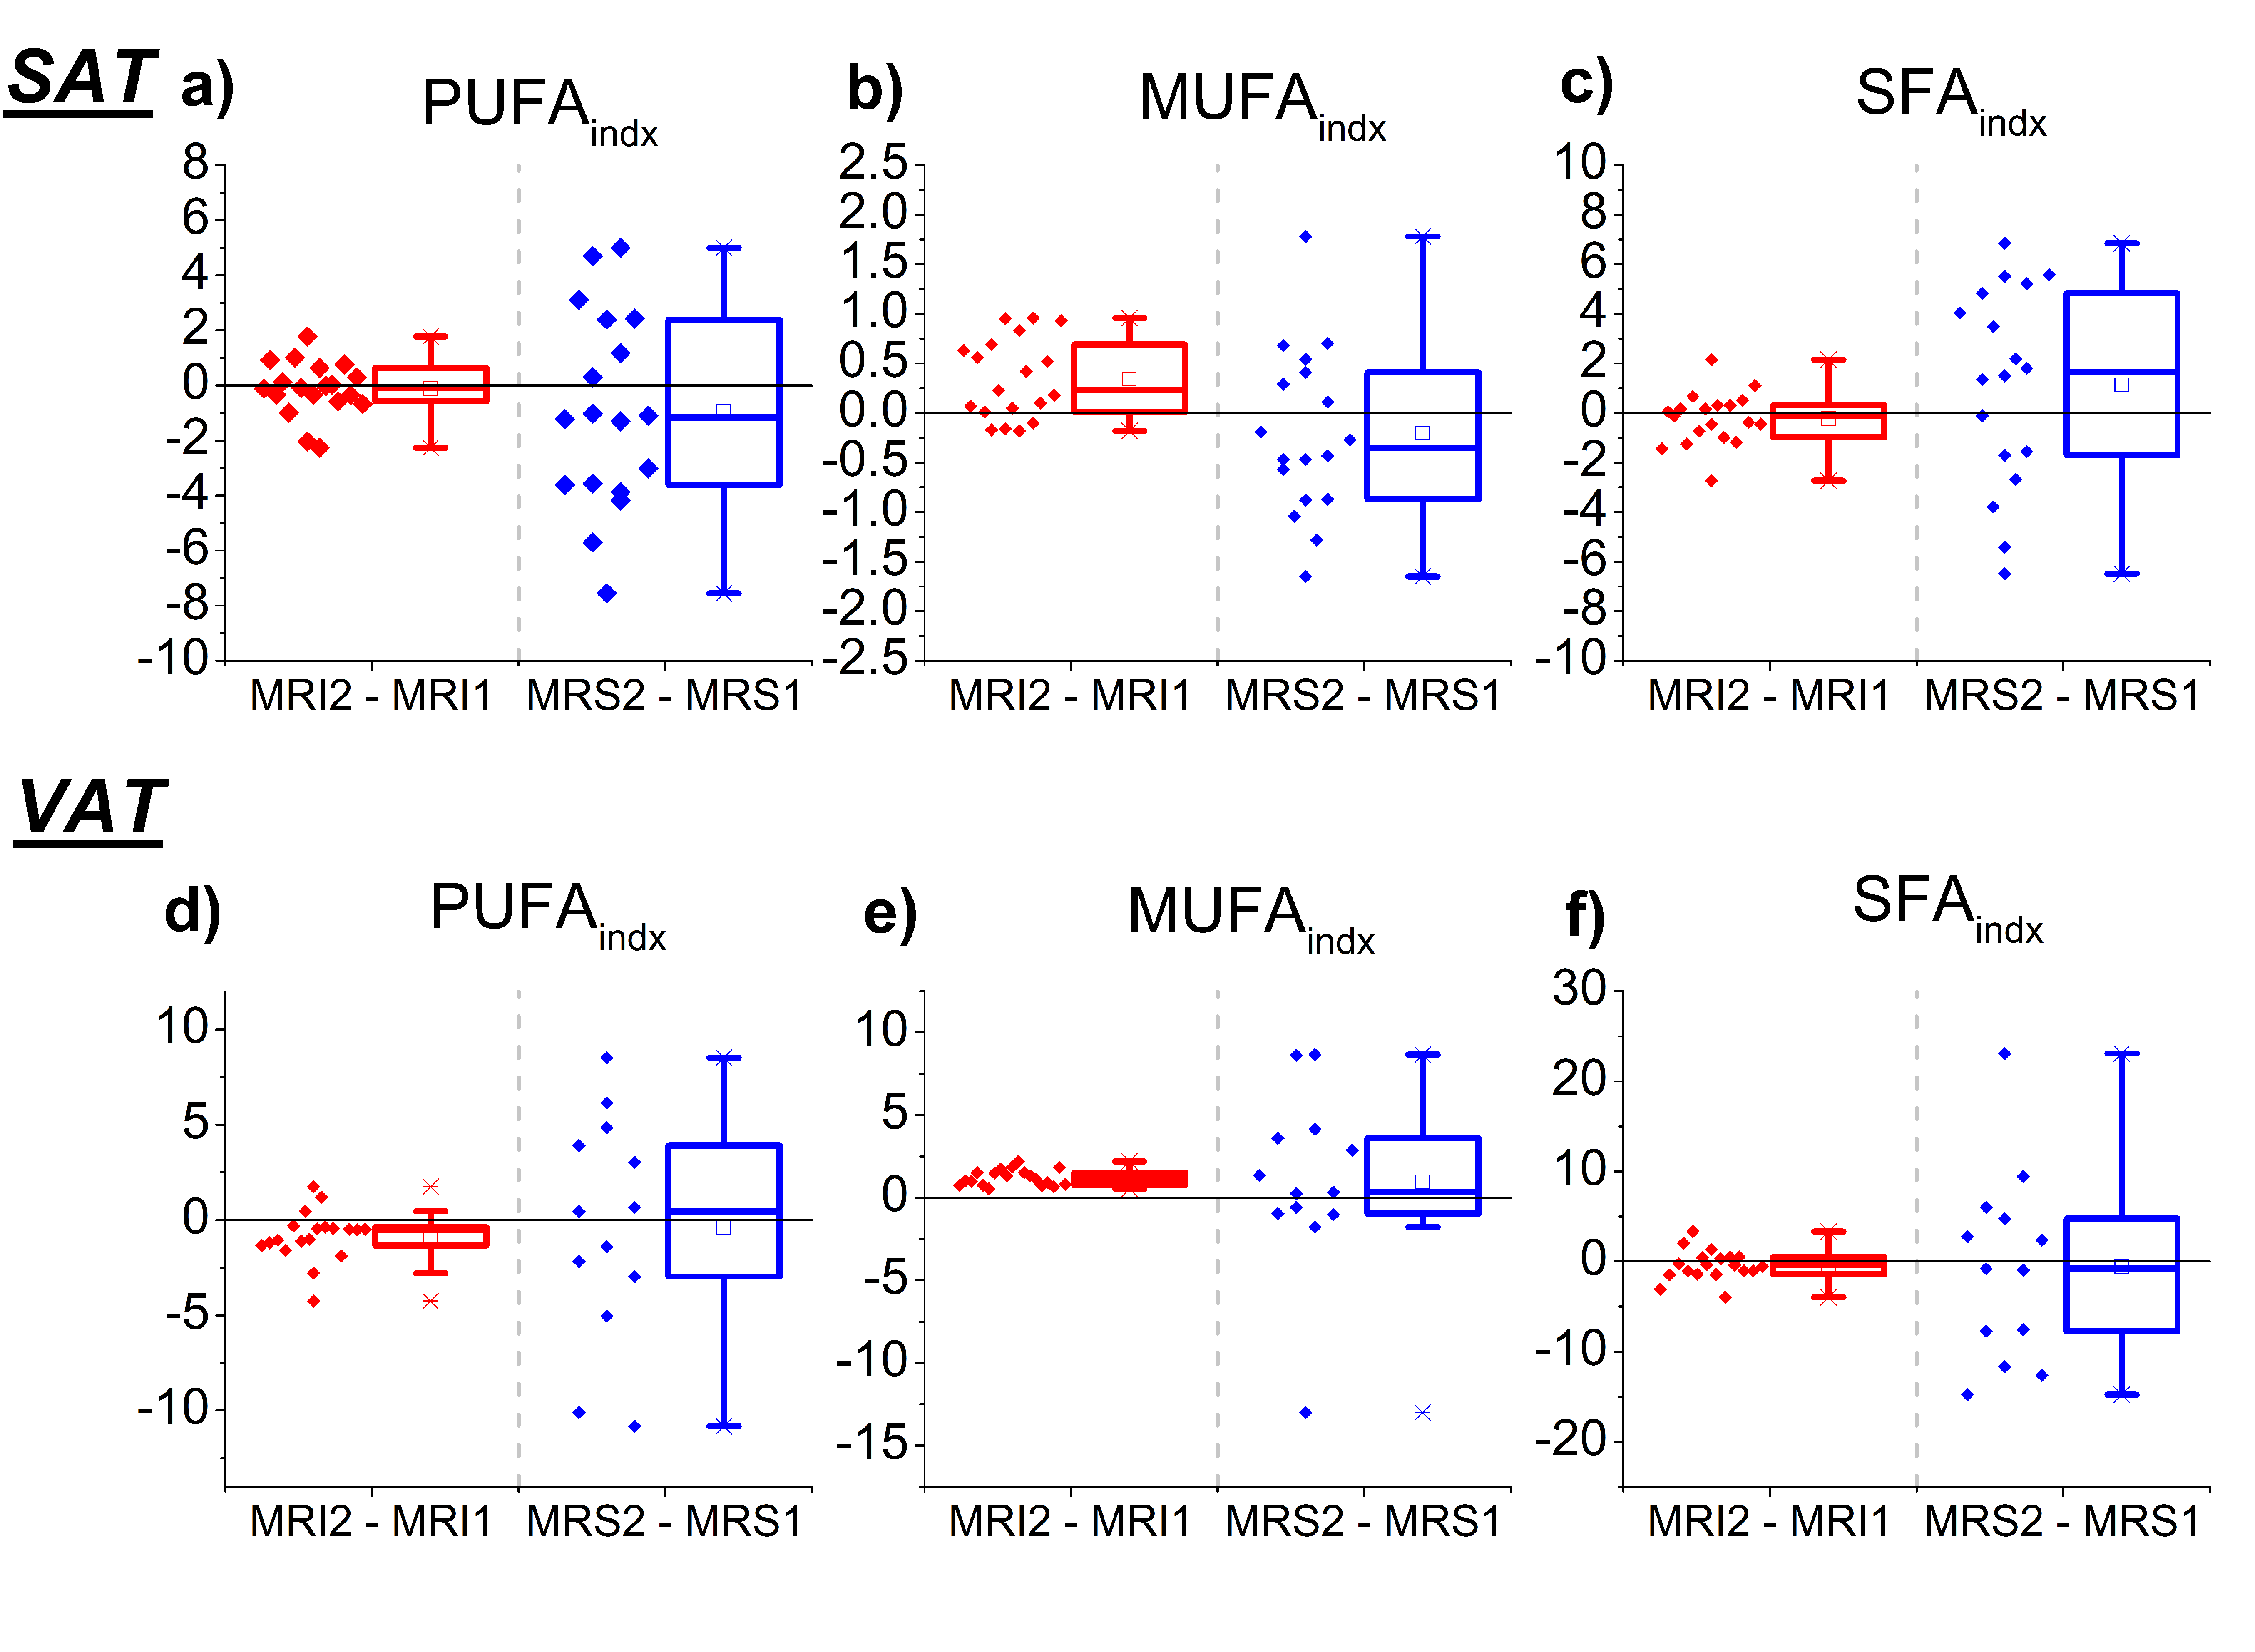
Regarding CSE-MRI results from the whole segmented volume versus the localized MRS results, the comparison of FA composition of SAT and VAT appeared to be substantially equivalent in average (figure 3). In both cases, paired t-tests showed significant difference between SAT and VAT FA composition (p<0.001 for CSE-MRI measurements and p=0.001 for MRS measurements). Good correlations were found between GC-MS and CSE-MRI measurements (for ndb: r = 0.84, p = 0.001; for nmidb: r = 0.66, p = 0.020) and between GC-MS and MRS measurements for ndb: r = 0.83, p < 0.001; for nmidb: r = 0.74, p = 0.006). The CSE-MRI method permitted to detect a significant decrease of PUFAindx (p = 0.012) and an increase of MUFAindx (p < 0.001) in VAT (figure 4).
Conclusion
A significant increase in fat distribution in VAT, SAT, and liver were established by DEXA, MRS, and CSE-MRI measurements after an experimental overfeeding. FA composition changes (more precisely the MUFA proportion) of the adipose tissue were also observed by CSE-MRI measurements. The use of a single 3D CSE-MRI sequence associated with a dedicated post-processing method is a suitable protocol to follow several parameters linked to adipose tissue changes. This NMR protocol could be used in future work to noninvasively evaluate the impact of nutrition on adipose tissues and liver.
More details could be found in the journal article 8.
Acknowledgements
This study was conducted as part of the LABEX PRIMES (ANR-11-LABX-0063) of the “Université de Lyon”, within the “Investissements d’Avenir” program (ANR-11-IDEX-0007) operated by the French National Research Agency (ANR). This study was also supported by the IHU OpéRa (ANR-10-IBHU-0004), within the “Investissements d’Avenir” program operated by the French National Research Agency (ANR). We thank Corinne Louche-Pelissier and Adeline Cestre (CRNH-RA) for technical assistance in the fatty acid analyses using GC-MS.References
- OMS Infobase globale: www.who.int
- Leporq B, Lambert SA, Ronot M, Vilgrain V, Van Beers BE.: Quantification of the triglyceride fatty acid composition with 3.0 T MRI. NMR Biomed. 2014; 27(10):1211-21.
- Achmad, E., Yokoo, T., Hamilton, G., et al.: Feasibility of and agreement between MR imaging and spectroscopic estimation of hepatic proton density fat fraction in children with known or suspected nonalcoholic fatty liver disease. Abdominal imaging. 2015;40(8), 3084-3090.
- Zand, K. A., Shah, A., Heba, E., Wolfson, T., et al.: Accuracy of multiecho magnitude‐based MRI (M‐MRI) for estimation of hepatic proton density fat fraction (PDFF) in children. Journal of Magnetic Resonance Imaging. 2015;42(5), 1223-1232.
- Nemeth A, Segrestin B, Leporq B, et al.: Comparison of MRI-derived vs. traditional estimations of fatty acid composition from MR spectroscopy signals. NMR Biomed 2018; 31:e3991.
- Hamilton G, Yokoo T, Bydder M, et al. : In vivo characterization of the liver fat 1H MR spectrum. NMR Biomed. 2011;24(7):784‐790.
- Peterson P, Månsson S: Simultaneous quantification of fat content and fatty acid composition using MR imaging. Magn Reson Med 2013; 69:688–697.
- Nemeth A, Segrestin B, Leporq B, et al.: 3D chemical shift-encoded MRI for volume and composition quantification of abdominal adipose tissue during an overfeeding protocol in healthy volunteers, J. Magn. Reson. Imaging.
Figures