0106
3D R2* Mapping of the Placenta During Early Gestation Using Free-Breathing Multiecho Stack-of-Radial MRI at 3 T1Radiological Sciences, University of California Los Angeles, Los Angeles, CA, United States, 2Physics and Biology in Medicine, University of California Los Angeles, Los Angeles, CA, United States, 3Obstetrics and Gynecology, David Geffen School of Medicine, University of California Los Angeles, Los Angeles, CA, United States, 4Pediatrics, David Geffen School of Medicine, University of California Los Angeles, Los Angeles, CA, United States
Synopsis
Ischemic placental disease can lead to hypoxia and abnormal pregnancy outcomes. R2* mapping using MRI can characterize placental hypoxia. However, conventional Cartesian MRI requires breath-holding which limits volumetric coverage, resolution, and signal-to-noise ratio. In addition, little is known about the nominal range of placental R2* at 3T and during early gestation. Therefore, we developed and evaluated a new free-breathing 3D stack-of-radial (free-breathing radial) technique for full volume placental R2* mapping at 3T. Free-breathing radial demonstrated good repeatability and established a nominal range of placental R2* in pregnant subjects during early gestation at 3T.
Introduction
Preeclampsia, intrauterine growth restriction, and placental abruption, collectively known as ischemic placental disease (IPD), are characterized by abnormal vascular development, malperfusion, and hypoxia1–6. IPD-induced preterm deliveries contribute to higher rates of infant and maternal morbidity and mortality3. Higher prevalence rates of IPD have been reported using ultrasound for anterior compared to posterior placentas11. Placental oxygenation can be characterized by MRI R2* mapping7–10. However, placental R2* mapping using conventional Cartesian MRI requires breath-holding to avoid motion artifacts, limiting the volumetric coverage, spatial resolution, and/or signal-to-noise ratio. Previous studies were predominantly limited to R2* mapping in a few 2D slices at 1.5T during later gestational age (GA), and did not distinguish between placenta implantation positions (anterior versus posterior)7–10. 3T MRI may provide greater sensitivity to changes in R2*, and predicting IPD during early GA is imperative to improve outcomes2. Therefore, we developed and evaluated a new free-breathing 3D stack-of-radial (FB radial)12 technique for full volume placental R2* mapping at 3T in pregnant women during early GA and investigated differences between anterior and posterior placentas.Methods
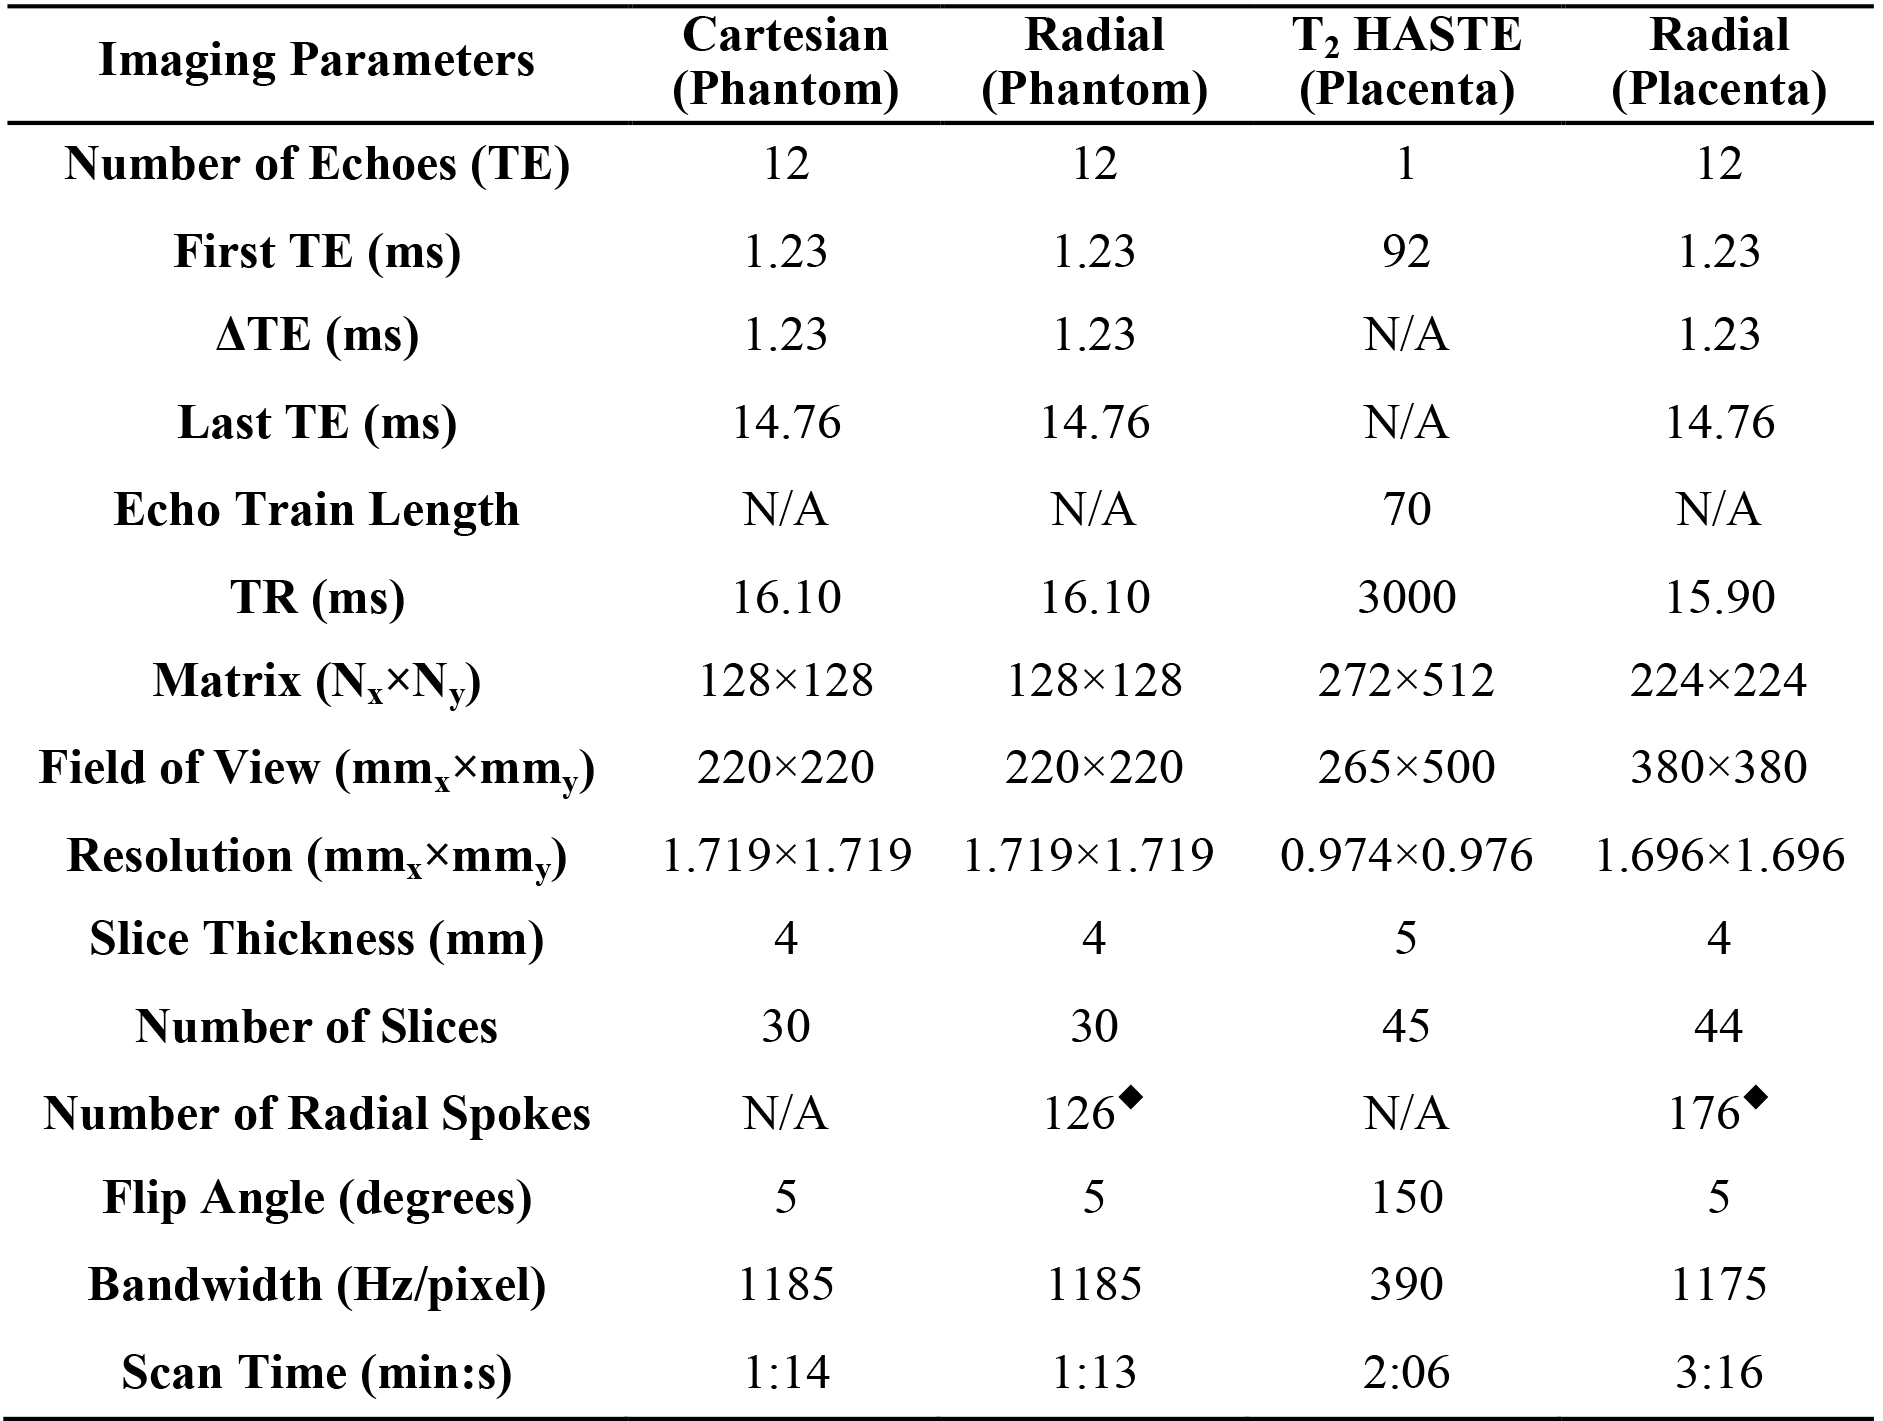
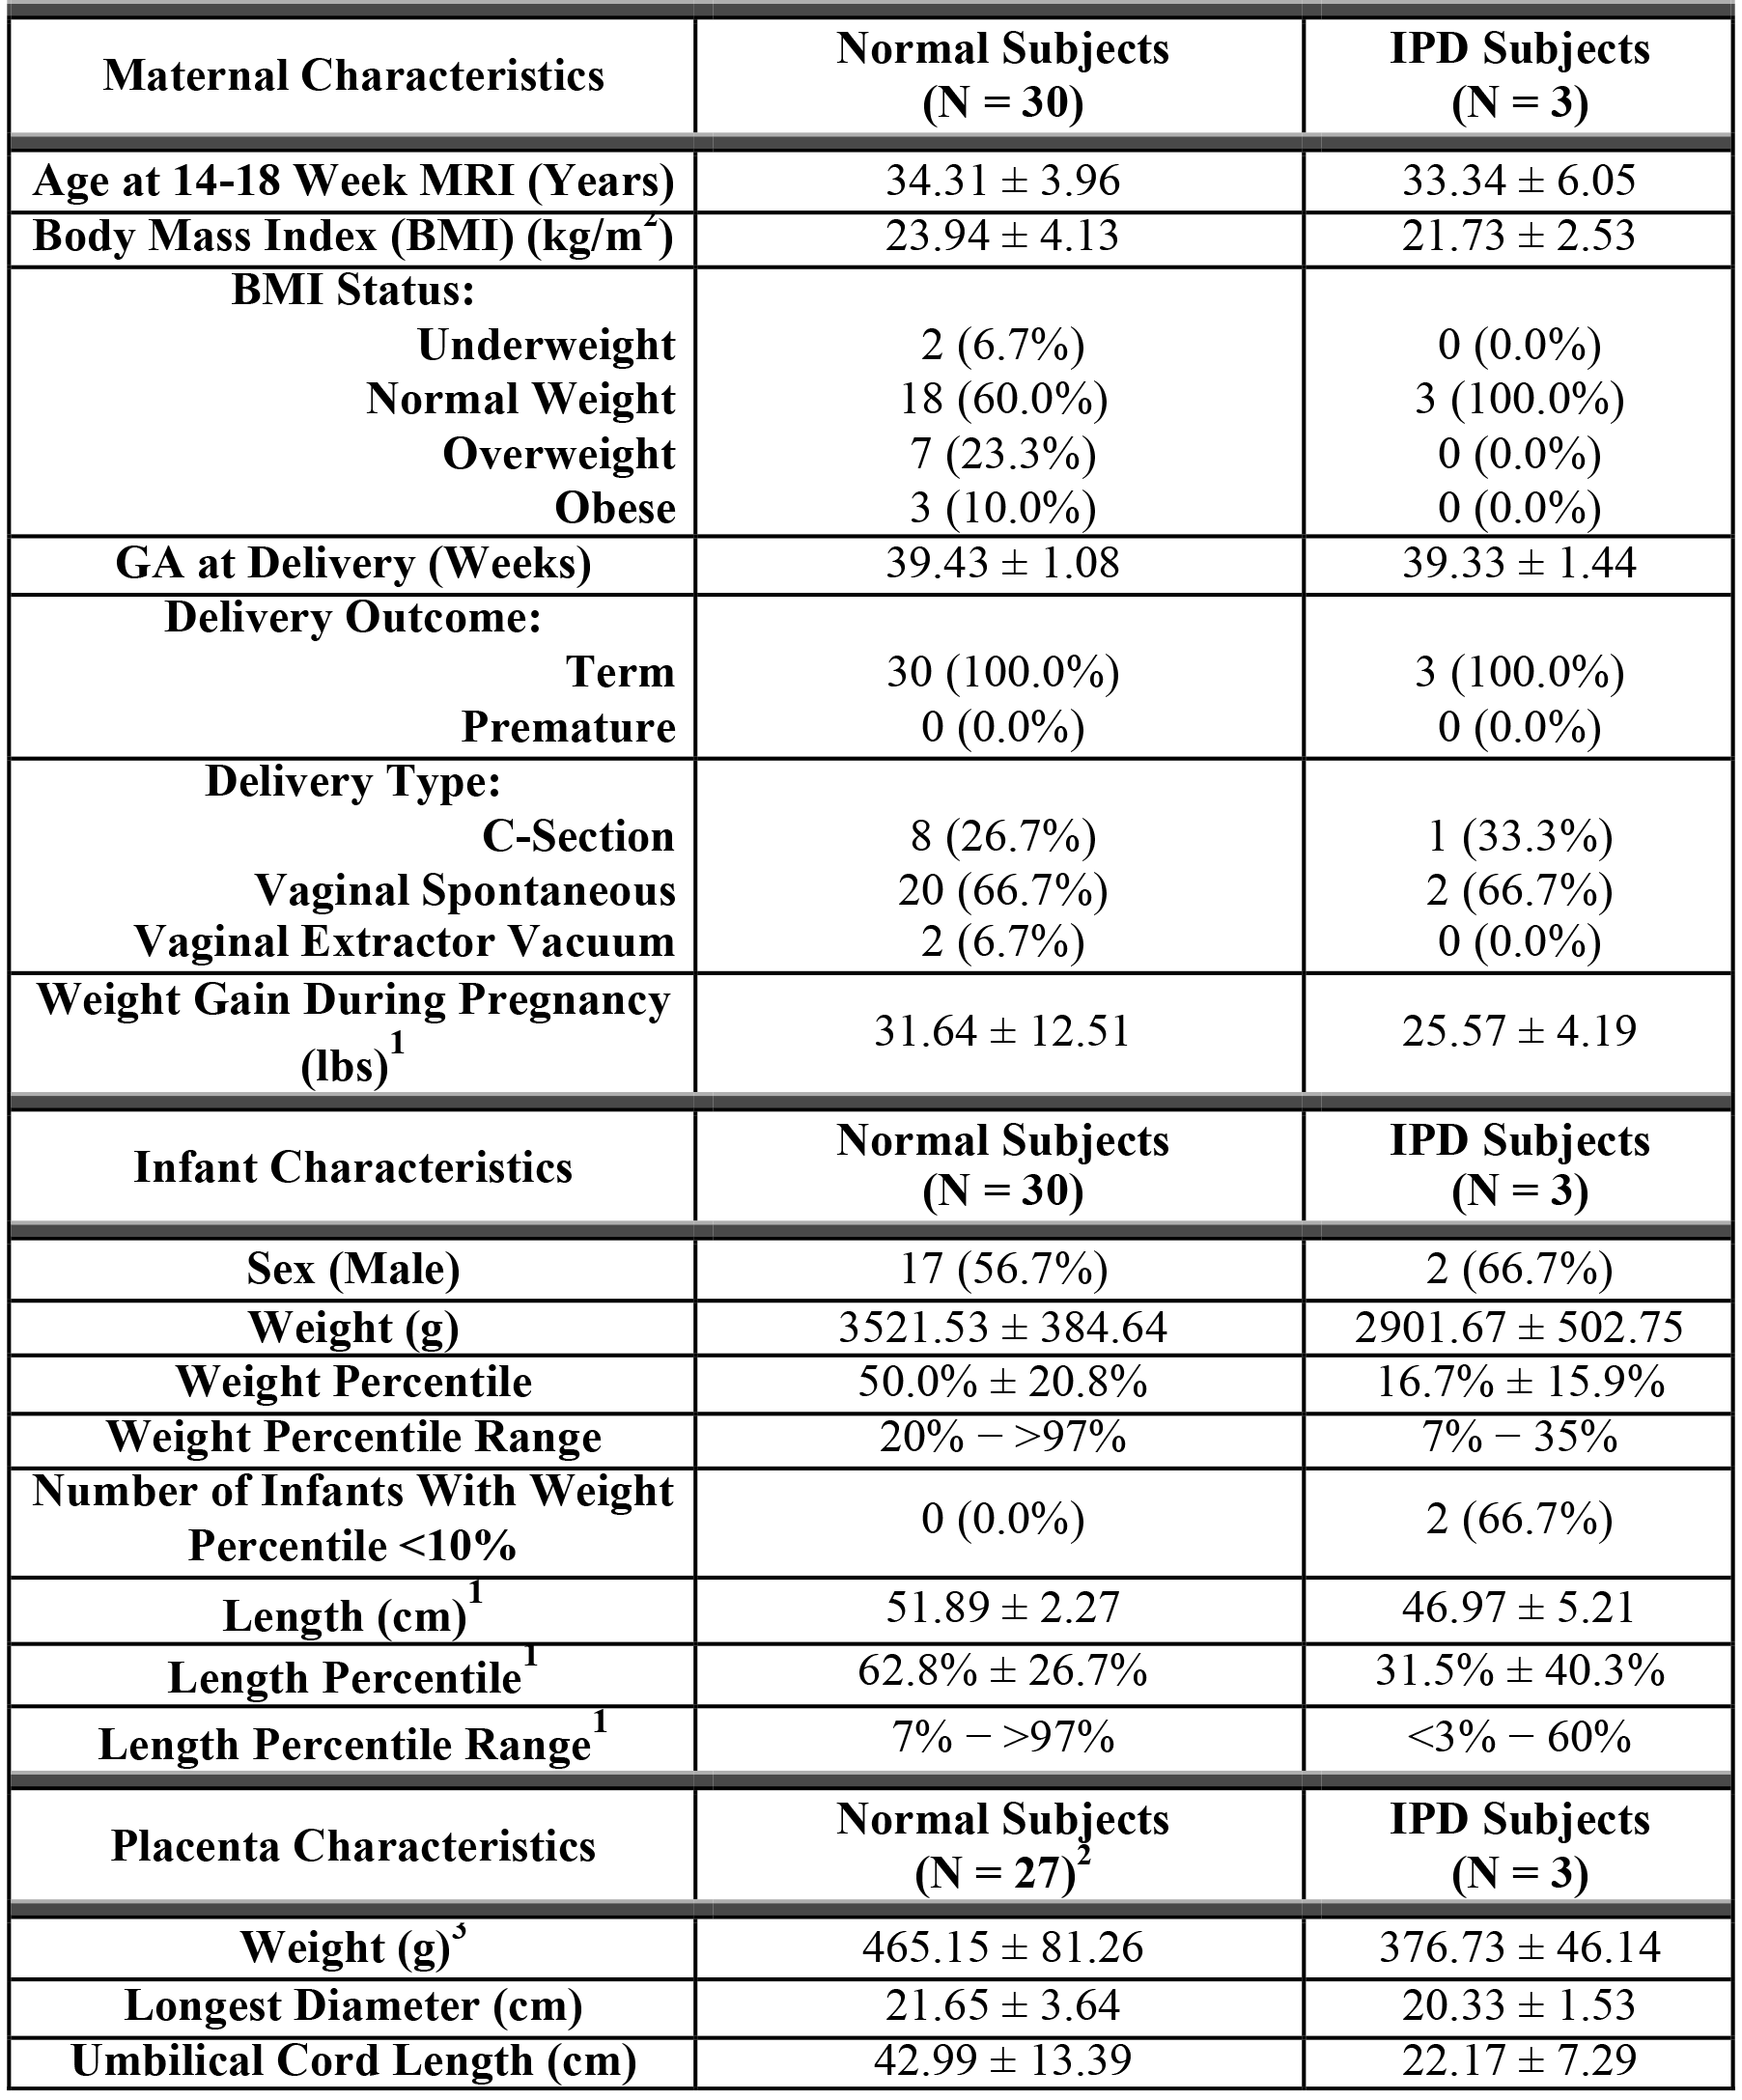
Experimental Design: A phantom with a R2* range of 5–70s-1 was scanned at 3T (Skyra, Siemens) to evaluate R2* quantification agreement between conventional Cartesian and FB radial MRI (Table 1). 33 pregnant subjects (Table 2) were enrolled in this IRB-approved study and informed consent was obtained. Subjects were scanned at two GA ranges (14-18 and 19-23 weeks GA) using T2 HASTE and FB radial sequences at 3T (Skyra/Prisma, Siemens) (Table 1). IPD was diagnosed at delivery. In all experiments, FB radial was scanned twice back-to-back in the same session to assess repeatability.
Reconstruction: FB radial images were reconstructed offline12,13 and R2* maps were calculated14–16 using a 7-peak fat model17,18 with a single effective R2* per voxel19–21.
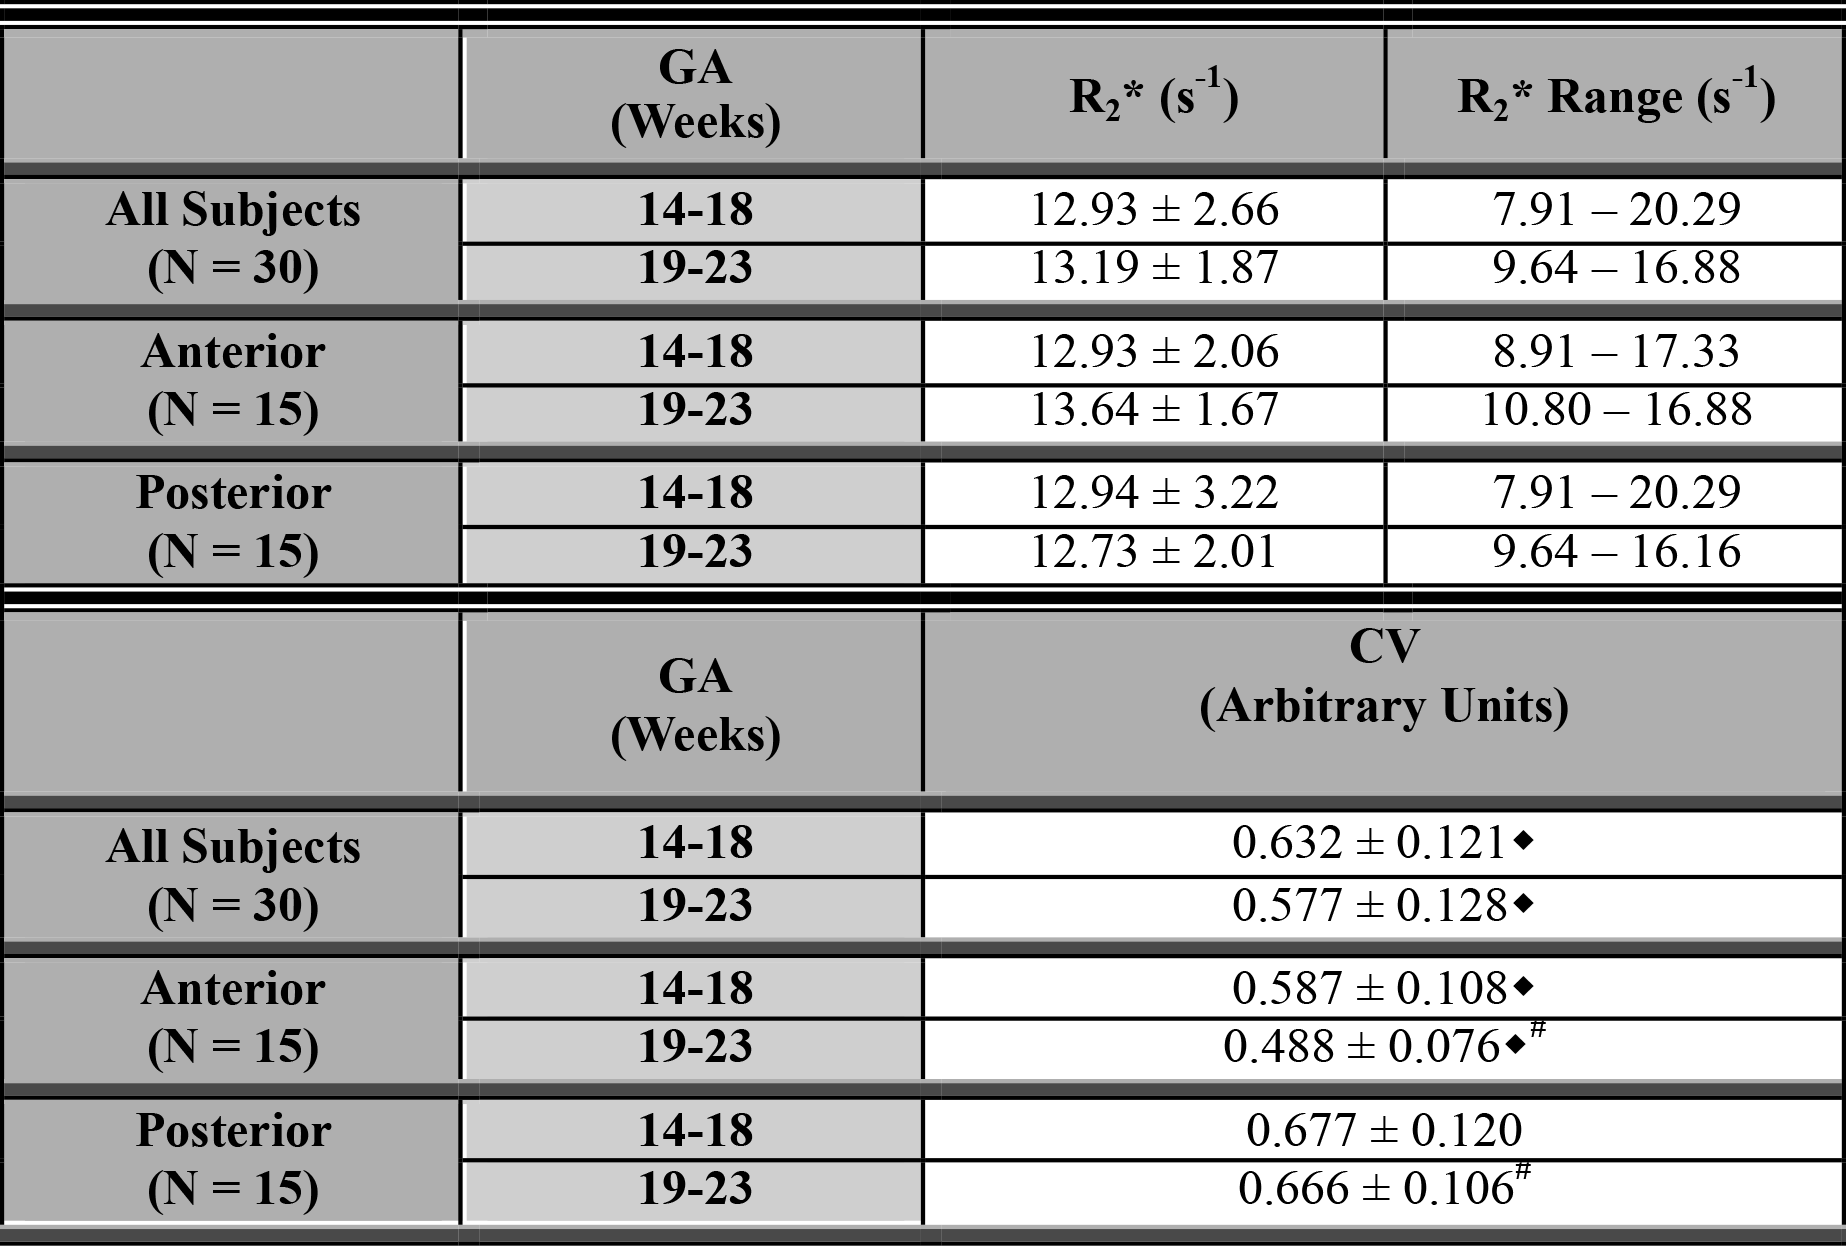
Analysis: R2* mapping agreement was assessed using linear correlation and Bland-Altman22 analyses by determining Lin’s concordance correlation coefficient (ρc)23 and mean difference (MD). For pregnant subjects, T2 HASTE images were registered to FB radial images with non-rigid registration24–26. 3D entire placenta contours were delineated on registered T2 HASTE images, copied to FB radial maps to measure placental R2*, and verified by an abdominal radiologist and a maternal fetal medicine specialist, masked to the pregnancy outcome. The coefficient of variation (CV=standard deviation/mean) of R2* within the placental volume was calculated. Placental R2* (mean, range, and CV) at each GA range were calculated for all healthy subjects, and for anterior and posterior placentas. Differences were determined using Wilcoxon Signed-Rank and Rank-Sum tests. Z-scores (Z ̂) for placental R2* in the IPD subjects were determined with respect to the healthy subjects. For phantom experiments and healthy subjects, the coefficient of repeatability (CR)27 was calculated. P<0.05 was considered significant.
Results
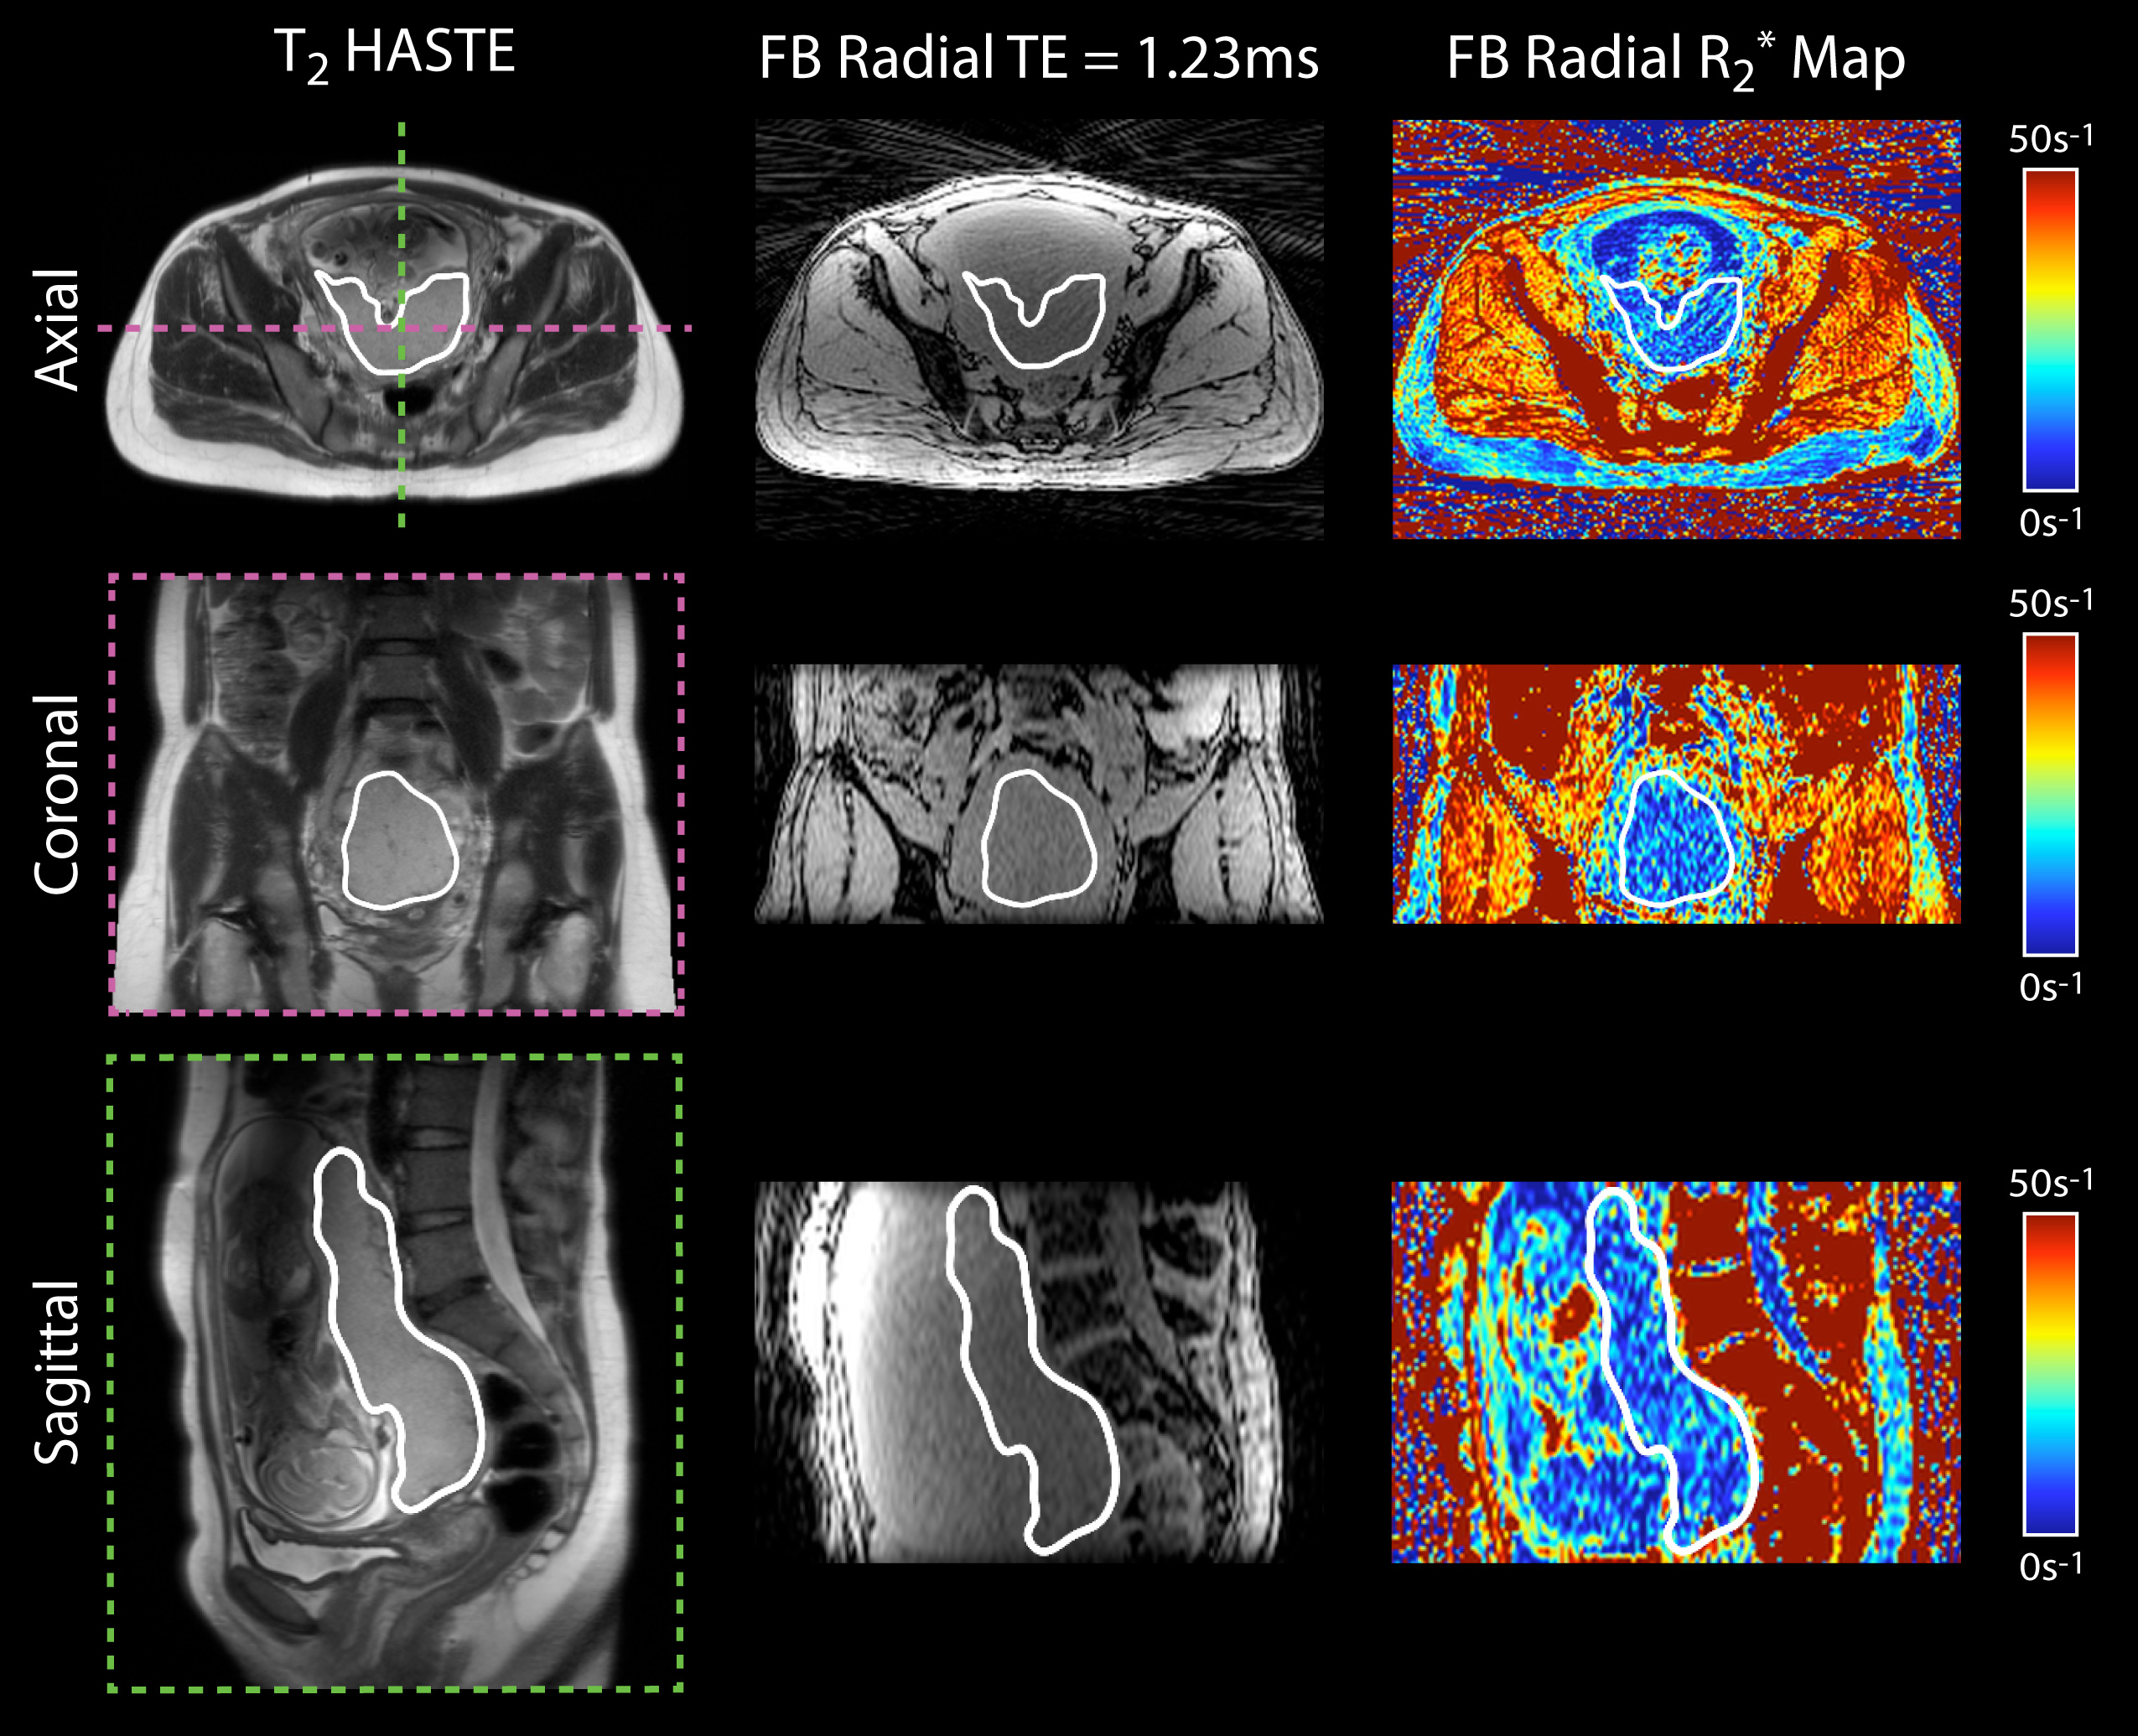
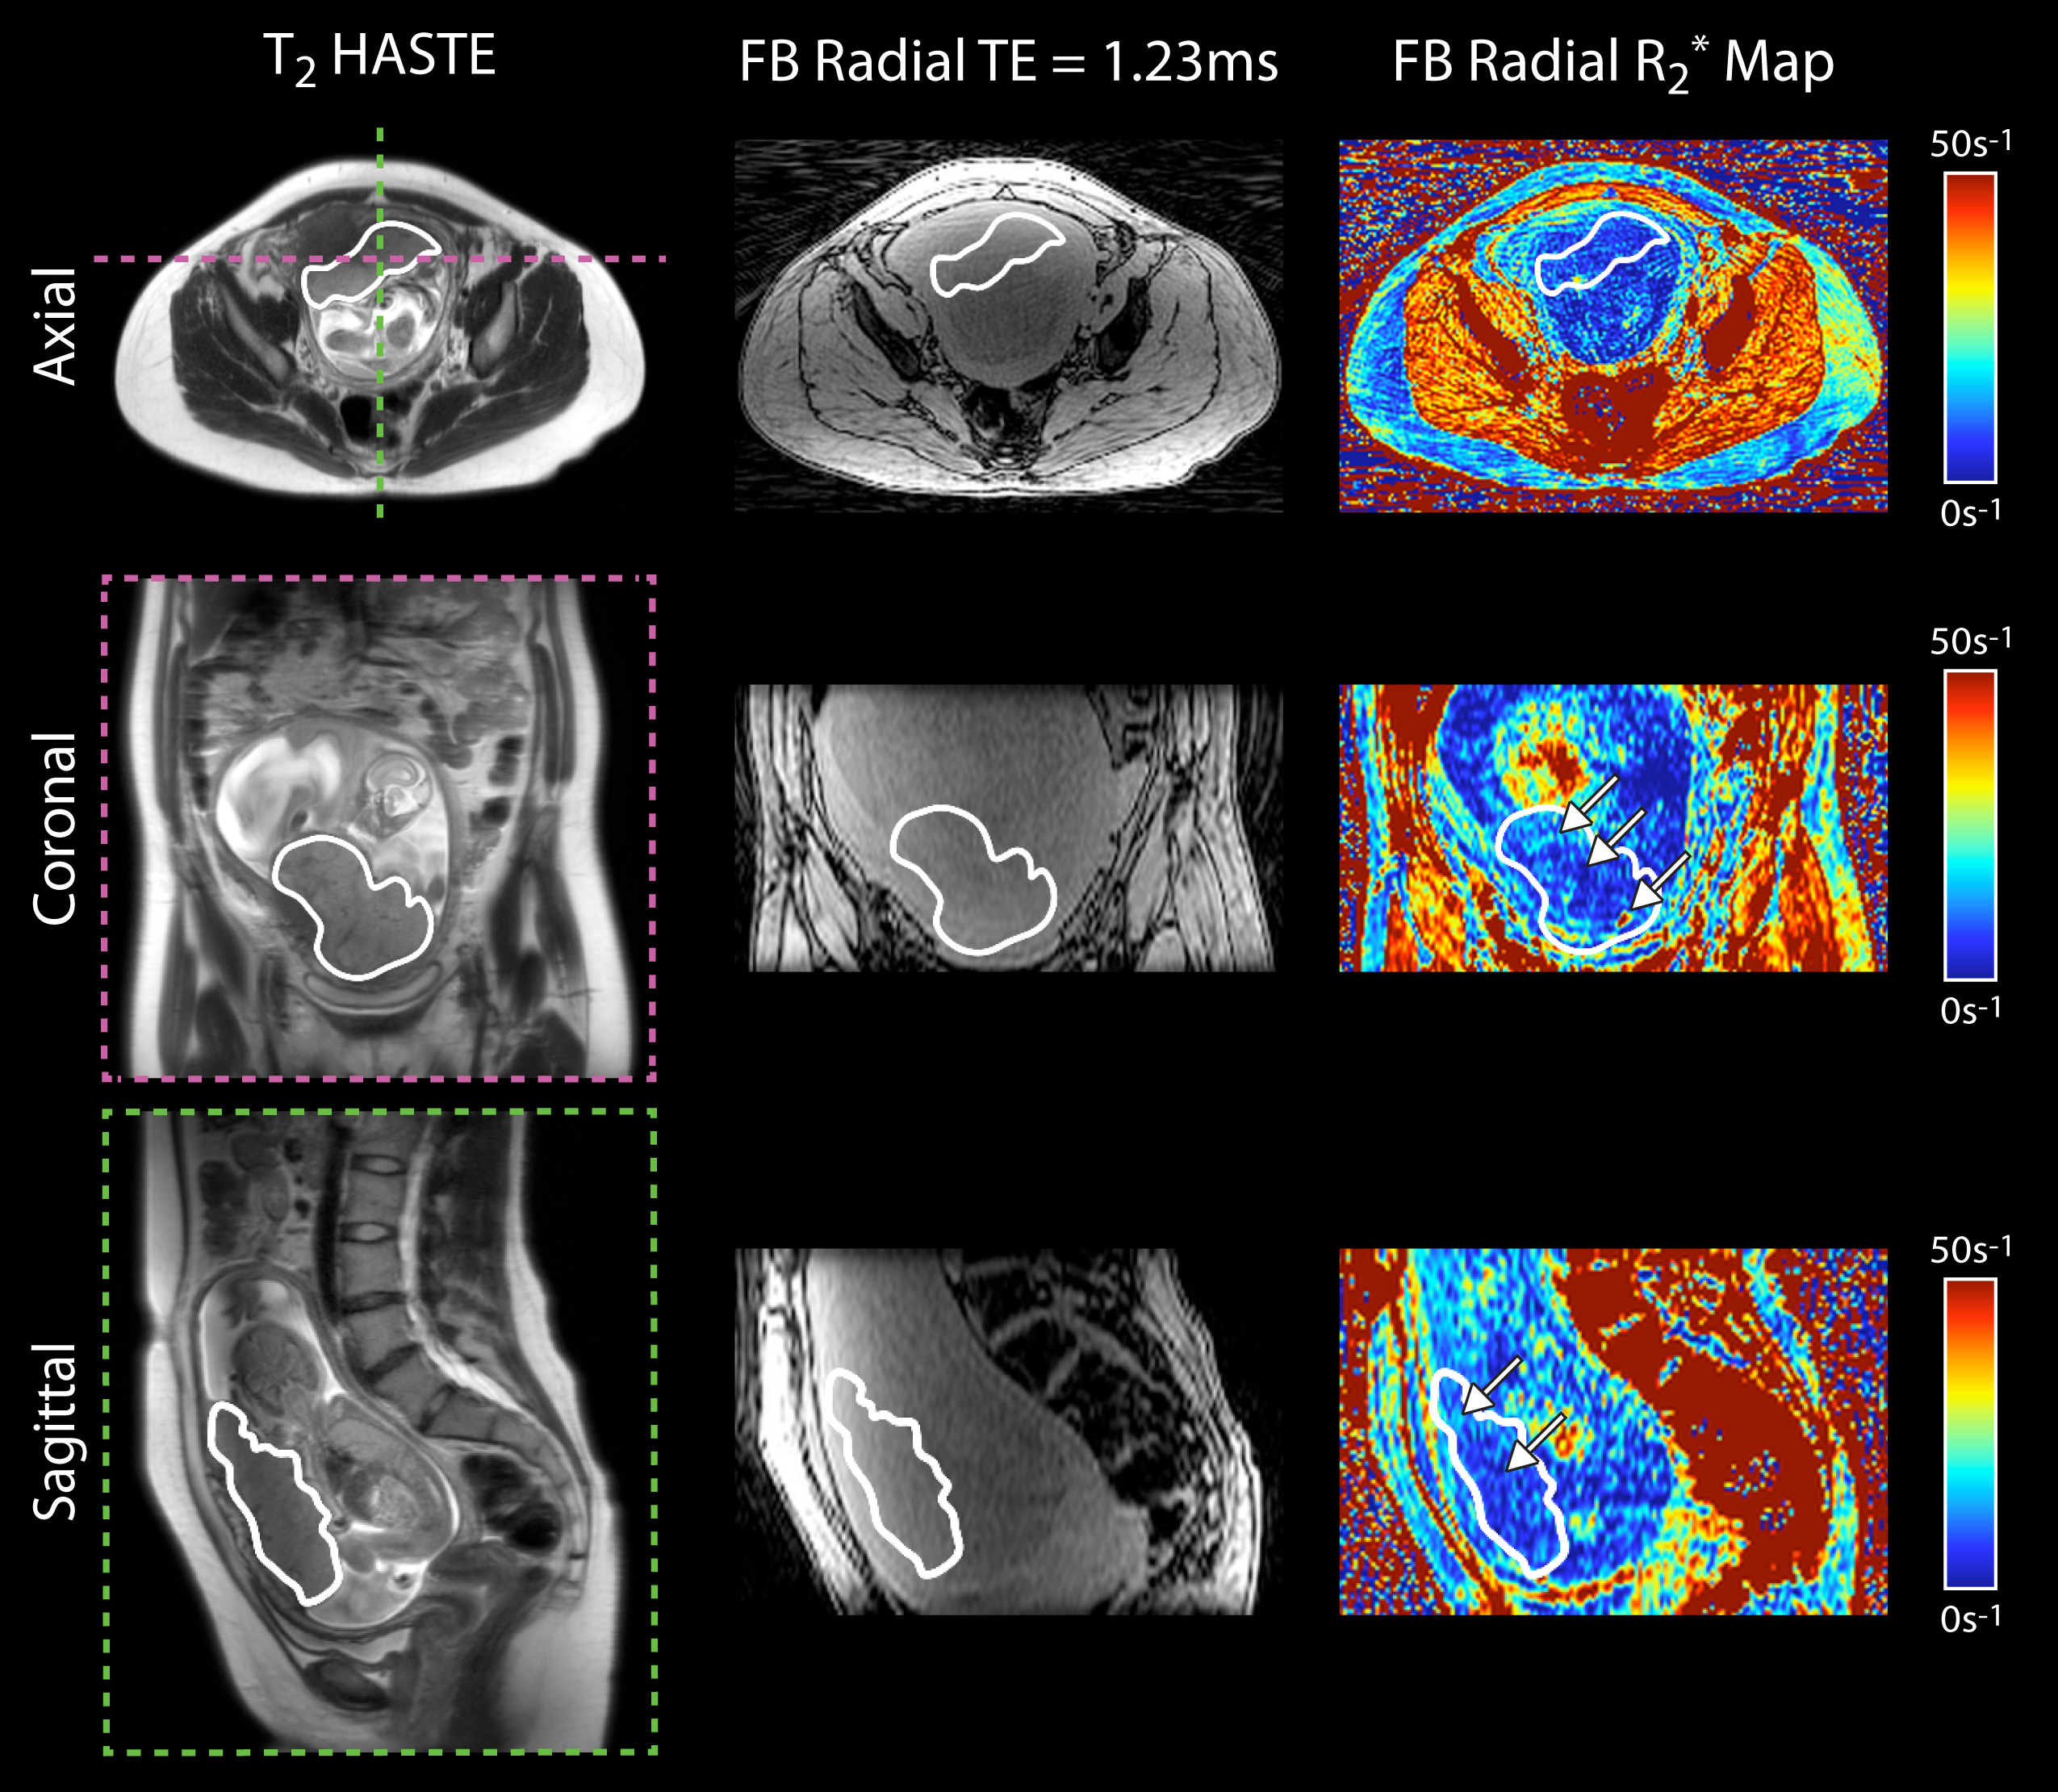
FB radial demonstrated accurate (ρc≥0.995; P<0.001; |MD|<0.2s-1) and repeatable (CR<4s-1) R2* mapping in a phantom. 3D FB radial R2* maps of the entire placenta were obtained in pregnant subjects in ~3 minutes (representative healthy subject in Figure 1). FB radial achieved repeatable R2* mapping (CR≤4.6s-1) in healthy pregnant subjects. Placental R2* values for healthy subjects are shown in Table 3. The CV was significantly greater at 14-18 weeks than 19-23 weeks GA. At 19-23 weeks, the CV was significantly lower for anterior than posterior placentas. One IPD subject had a lower mean R2* than healthy subjects (<-2) (Figure 2).Discussion
Placental R2* measured by FB radial demonstrated stronger repeatability for 14-18 (CR=2.92s-1) than 19-23 weeks GA (CR=8.24s-1) due to two outliers from scans during 19-23 weeks GA with substantial motion (>8mm, determined using FB radial self-navigation)28. With these outliers removed, CR=4.20s-1 at 19-23 weeks GA. Significant differences in the CV between anterior and posterior placentas were observed at 19-23 weeks GA (Table 3). This may be due to vascular differences between anterior and posterior placentas, or because subjects were scanned feet-first supine. Lower R2* in the center of the placenta and higher R2* along the periphery were observed in an IPD subject with preeclampsia (Figure 2); regions of higher R2* could reflect tissue hypoxia. Additional healthy subjects and IPD subjects may be studied to improve the understanding of spatial and temporal characteristics of placental R2*.Conclusion
FB radial achieved accurate and repeatable R2* mapping in a phantom and repeatable R2* mapping in the entire placenta of healthy pregnant subjects. The range of placental R2* in healthy pregnancies during early gestation at 3T has been established. FB radial may improve the understanding and management of pregnant women with IPD.Acknowledgements
This work acknowledges the use of the ISMRM Fat-Water Toolbox (http://ismrm.org/workshops/FatWater12/data.htm). The authors would like to thank Irish Del Rosario, Margarida Y. Y. Lei, Dr. Daniel Margolis, Sitaram Vangala, and Aaron Scheffler for their help with this project.
Funding: Research reported in this publication was supported in part by NIH grant NICHD U01-HD087221.
References
- Ananth C V., Vintzileos AM. Maternal-fetal conditions necessitating a medical intervention resulting in preterm birth. Am J Obstet Gynecol. 2006;195(6):1557-1563. doi:10.1016/j.ajog.2006.05.021.
- Vintzileos AM, Ananth C V. First trimester prediction of ischemic placental disease. Semin Perinatol. 2014;38(3):159-166. doi:S0146-0005(14)00016-0 [pii]\r10.1053/j.semperi.2014.03.006.
- Parker SE, Werler MM. Epidemiology of ischemic placental disease: A focus on preterm gestations. Semin Perinatol. 2014;38(3):133-138. doi:10.1053/j.semperi.2014.03.004.
- Ananth C V. Ischemic placental disease: A unifying concept for preeclampsia, intrauterine growth restriction, and placental abruption. Semin Perinatol. 2014;38(3):131-132. doi:10.1053/j.semperi.2014.03.001.
- Parks WT. Placental hypoxia: The lesions of maternal malperfusion. Semin Perinatol. 2015;39(1):9-19. doi:10.1053/j.semperi.2014.10.003.
- Kingdom JCP, Kaufmann P. Oxygen and placental villous development: Origins of fetal hypoxia. Placenta. 1997;18(8):613-621. doi:10.1016/S0143-4004(97)90000-X.
- Sinding M, Peters DA, Frøkjær JB, et al. Placental magnetic resonance imaging T2* measurements in normal pregnancies and in those complicated by fetal growth restriction. Ultrasound Obstet Gynecol. 2016;47(6):748-754. doi:10.1002/uog.14917.
- Sinding M, Peters DA, Frøkjær JB, et al. Prediction of low birth weight: Comparison of placental T2* estimated by MRI and uterine artery pulsatility index. Placenta. 2017;49:48-54. doi:10.1016/j.placenta.2016.11.009.
- Huen I, Morris DM, Wright C, et al. R1 and R2 * changes in the human placenta in response to maternal oxygen challenge. Magn Reson Med. 2013;70(5):1427-1433. doi:10.1002/mrm.24581.
- Sinding M, Peters DA, Poulsen SS, et al. Placental baseline conditions modulate the hyperoxic BOLD-MRI response. Placenta. 2018;61:17-23. doi:10.1016/j.placenta.2017.11.002.
- Zia S. Placental location and pregnancy outcome. J Turkish Ger Gynecol Assoc. 2013;14(4):190-193. doi:10.5152/jtgga.2013.92609.
- Armstrong T, Dregely I, Stemmer A, et al. Free-breathing liver fat quantification using a multiecho 3D stack-of-radial technique. Magn Reson Med. 2018;79(1):370-382. doi:10.1002/mrm.26693.
- Walsh DO, Gmitro AF, Marcellin MW. Adaptive reconstruction of phased array MR imagery. Magn Reson Med. 2000;43(5):682-690. doi:10.1002/(SICI)1522-2594(200005)43:5<682::AID-MRM10>3.0.CO;2-G.
- Hernando D, Kellman P, Haldar JP, Liang Z-P. Robust water/fat separation in the presence of large field inhomogeneities using a graph cut algorithm. Magn Reson Med. 2010;63(1):79-90. doi:10.1002/mrm.22177.
- ISMRM Fat Water Toolbox. In: ; 2012.
- Gleich DF. Models and algorithms for pagerank sensitivity. 2009. http://www.stanford.edu/group/SOL/dissertations/pagerank-sensitivity-thesis-online.pdf.
- Ren J, Dimitrov I, Sherry AD, Malloy CR. Composition of adipose tissue and marrow fat in humans by 1H NMR at 7 Tesla. J Lipid Res. 2008;49(9):2055-2062. doi:10.1194/jlr.D800010-JLR200.
- Hamilton G, Yokoo T, Bydder M, et al. In vivo characterization of the liver fat 1H MR spectrum. NMR Biomed. 2011;24(7):784-790. doi:10.1002/nbm.1622.
- Horng DE, Hernando D, Hines CDG, Reeder SB. Comparison of R2* correction methods for accurate fat quantification in fatty liver. J Magn Reson Imaging. 2013;37(2):414-422. doi:10.1002/jmri.23835.
- Horng DE, Hernando D, Reeder SB. Quantification of liver fat in the presence of iron overload. J Magn Reson Imaging. 2017. doi:10.1002/jmri.25382.
- Yu H, Shimakawa A, McKenzie CA, Brodsky E, Brittain JH, Reeder SB. Multiecho water-fat separation and simultaneous R2* estimation with multifrequency fat spectrum modeling. Magn Reson Med. 2008;60(5):1122-1134. doi:10.1002/mrm.21737.
- Bland JM, Altman DG. Measuring agreement in method comparison studies. Stat Methods Med Res. 1999;8(2):135-160. doi:10.1191/096228099673819272.
- Lin LI. A concordance correlation coefficient to evaluate reproducibility. Biometrics. 1989;45(1):255-268. doi:10.2307/2532051.
- Advanced Normalization Tools ( ANTs ).
- Avants BB, Tustison NJ, Song G, Cook PA, Klein A, Gee JC. A reproducible evaluation of ANTs similarity metric performance in brain image registration. Neuroimage. 2011;54(3):2033-2044. doi:https://doi.org/10.1016/j.neuroimage.2010.09.025.
- Avants BB, Yushkevich P, Pluta J, et al. The optimal template effect in hippocampus studies of diseased populations. Neuroimage. 2010;49(3):2457-2466. doi:https://doi.org/10.1016/j.neuroimage.2009.09.062.
- Obuchowski NA, Reeves AP, Huang EP, et al. Quantitative imaging biomarkers: A review of statistical methods for computer algorithm comparisons. Stat Methods Med Res. 2014;24(1):68-106. doi:10.1177/0962280214537390.
- Martin T, Liu D, Chanlaw T, et al. Evaluation of placenta motion througout gestation. In: Proceedings of the International Society for Magnetic Resonance in Medicine 25th. Honolulu, Hawaii, United States; 2017:4802.
Figures