0105
Using Amide Proton Transferto indentify Cervical Squamous Carcinoma/Adenocarcinoma and Evaluate its Differentiation Grade1Department of MR, the First Affiliated Hospital,Xinxiang Medical University, Weihui, China, 2MR Research China, GE Healthcare, Beijing, China
Synopsis
Amide proton transfer (APT) weighted imaging provides information about concentration of proteins/peptides with amide backbones. At present, there is no report on whether APT can be applied to cervical cancer. Our results show that APT can be used to preliminarily identify cervical squamous carcinoma, cervical adenocarcinoma and evaluate its differentiation grade.
Introduction
Uterus cervical cancer (UCC) is the third most common malignant tumor in the female reproductive system. The prognosis of UCC is closely related to the pathology type and grade of differentiation1. Recent studies have shown that there are differences in protein and peptide content in tumor tissues with different pathology types and differentiation grades2.Traditional protein detection methods such as protein electrophoresis analysis ofexvivo tissue have poor real-time performance and the sampling may cause damages to the human body. Amide proton transfer (APT) imaging is a technology for detection of free protein and peptide content in living tissue without exogenous magnetic resonance contrast agent3. At present, APT has been proven to be useful for diagnosis and classification of head and neck tumors, identification and evaluation of benign and malignant lesions of the prostate, as well as evaluation of grade of malignancy of rectal tumor4-6. This research aims to explore the possibility of APT in identification and diagnosis of cervical squamous carcinoma (CSC), cervical adenocarcinoma (CA) and different levels of CSC.Methods
Using pathology results as the gold standard,76 patients are selected in this research, including 60 patients with CSC (40 with low level (17 of well differentiated, 23 of moderately differentiated), and 20 with high level (poorly differentiated )); 16 patients with CA. Studies were carried out by using a 3.0 T MR system (Discovery MR750, GE Healthcare) with a 32 channel phased-array torso coil. DWI sequence at oblique axial view was taken as reference with the clearest indication of lesion. APT data were collected by single-section transverse imaging with TR=3000 ms, TE=12.0 ms, FOV=360×280 mm2. The power of the radiofrequency saturation pulse for the APT sequence was 2.0T and the length was 400 ms. Data were acquired with 1 NEX in a saturation frequency list of 15.6,±6,±5,±4.5, ±4, ±3.75, ±3.5,±3.25,±3, ±2.5,±2, ±1.5, ±1, ±0.75,±0.5,±0.25 and 0 ppm and 1 no-saturation map. The MTRasym (3.5ppm) was calculated, and B0 correction was performed by shifting the minimum signal of the z spectrum to 0 Hz. The ROI was determined at the contour of the tumor tissue manually on the original APT image using DWI images as reference, containing solid tumor issues and avoiding obvious cystic, hemorrhagic and necrotic areas as much as possible7(Fig 1).SPSS 23.0 and Med Calc 11.1 are used for data analysis: Individual sample t is used to check and compare the differences in MTRasym value between the CSC group and CA group, and between the low/high level CSC groups. ROC curve is used to evaluate the diagnostic performance of MTRasym value. Spearman related coefficients are used to analyze the correlation between MTRasym value and the differentiation grade of CSC. P<0.05 is considered statistically significant.Results
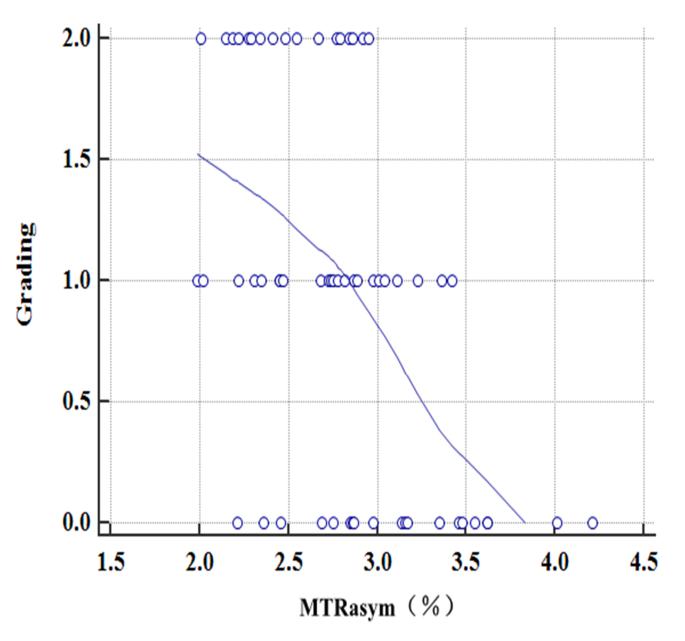
The MTRasym value in the CA group(Fig 1C)is higher than that in the CSC group (P=0.001,Table 1,Fig 1A,1B). The MTRasym value in the high level CSC group (Fig 1B)is higher than that in the low level CSC group (P=0.001,Table 2,Fig 1A). The MTRasym value is negatively correlated with the CSC grade of differentiation ( p=0.001,Fig 2). The AUC for MTRasym value in identifying CSC and CA is 0.779, with cut-off value of 2.97%, sensitivity and specificity of 60.0% and 82.5%, respectively. The AUC in identifying high/low level CSC groups is 0.756, with cut-off value of 3.29%, sensitivity and specificity of 68.8% and 83.3%, respectively(Fig 3).Discussion
The MTRasym value is significantly different between CA group and CSC group. It may be related to the ability of the cell itself to secrete proteins and peptides8. The CA comes from cervical glandular cells, is rich in glandular structure and can secrete a large amount of mucin which include a lot of proteins and peptides. The MTRasym value is significantly different between the high level CSC group and the low level CSC group. It may be related to cell density9.The higher the malignancy of tumor tissue, the greater the cell density, and the more protein/polypeptide can be secreted. In addition to these reasons, the cause of these results may also be related to cell atypia and tissue microvessel density.Conclusion
We concluded that APT may be a useful technique for identification and diagnosis of CSC, CA and different levels of CSC, which could have an important impact on the clinical therapy strategy for patients with UCC.Acknowledgements
The Henan Science and Technology Office of China (grant numbers 172102310503)References
1. Noh JM,Park W,Kim YS,et al.Comparison of clinical outcomes of adenocarcinoma and adenosquamous carcinoma in uterine cervical cancer patients receiving surgical resection followed by radiotherapy: a multicenter retrospective study (KROG 13-10)[J].Gynecologic oncology,2014,132(3):618-623.
2. Takayama Y,Nishie A,Togao O,et al.Amide Proton Transfer MR Imaging of Endometrioid Endometrial Adenocarcinoma: Association with Histologic Grade.Radiology,2018,286(3):909-917.
3. Zhou J,Payen JF,Wilson DA,et al.Using the amide proton signals of intracellular proteinsand peptides to detect pH effects in MRI. Nature medicine,2003,9(8):1085-1090.
4. Sakata A,Okada T,Yamamoto A,et al.Grading glial tumors with amide proton transfer MR imaging: different analytical approaches[J].J Neuro Oncol,2015,122(2):339-348.
5. Takayama Y, Nishie A, Sugimoto M, Togao O, Asayama Y, Ishigami K, et al. Amide proton transfer (APT) magnetic resonance imaging of prostate cancer: comparison with Gleason scores. MAGMA 2016;29:671–679.
6. Nishie A,Takayama Y,Asayama Y,et al.Amide proton transfer imaging can predict tumorgrade in rectal cancer[J].Magnetic resonance imaging,2018,51():96-103.DOI:10.1016/j.mri.2018.04.017.
7. Togao O,Hiwatashi A,Keupp J,et al. Scan-rescan reproducibility of parallel transmission based amide proton transfer imaging of brain tumors. Journal of magnetic resonance imaging: JMRI,2015,42(5):1346-1353.
8. Ohno Y,Yui M,Koyama H,et al.Chemical Exchange Saturation Transfer MR Imaging: Preliminary Results for Differentiation of Malignant and Benign Thoracic Lesions.Radiology,2016,279(2):578-589.
9. Park JE,Lee JY,Kim HS,et al.Amide proton transfer imaging seems to provide higher diagnostic performance in post-treatment high-grade gliomas than methionine positron emission tomography.European radiology,2018,28(8):3285-3295.
Figures