0103
Enhanced T2 Star-Weighted Angiography (ESWAN) for Differentiating Borderline From Malignant Epithelial Ovarian Tumors1First Affiliated Hospital of Dalian Medical University, Dalian, China, 2GE Healthcare, Beijing, China
Synopsis
The aim of this study is to assess the fitted parameters of ESWAN in ovarian tumors and to investigate their potential in distinguishing borderline from malignant epithelial ovarian tumors, which can provide detailed information for clinical treatment. R2* and T2* in ESWAN were the key parameters for distinguishing borderline from malignant epithelial ovarian tumors. MR-ESWAN sequence can be used as non-enhancement quantitative indexes, which has a good application prospect.
Purpose
Patients with borderline epithelial ovarian tumors (BEOTs) who intent to preserve fertility are, in general, candidates for fertility-sparing surgery, whereas patients with malignant epithelial ovarian tumors(MEOTs) require thorough surgical staging, followed by adjuvant chemotherapy[1,2]. A considerable overlap of clinical symptoms and imaging characteristics between BEOTs and MEOTs can make it difficult to get a definitive preoperative diagnosis. Accurate preoperative classification could be helpful for proper surgical plan, and improve the life quality of patients. We investigated the value of enhanced T2 star weighted angiography (ESWAN) in differentiating BEOTs from MEOTs.Methods
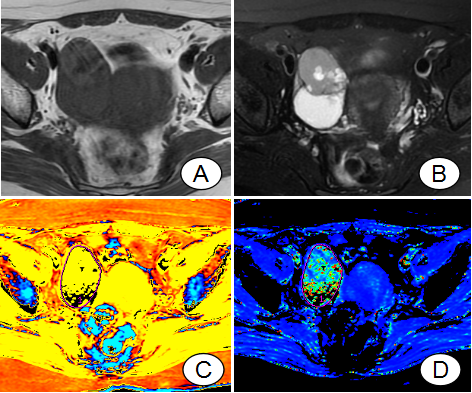
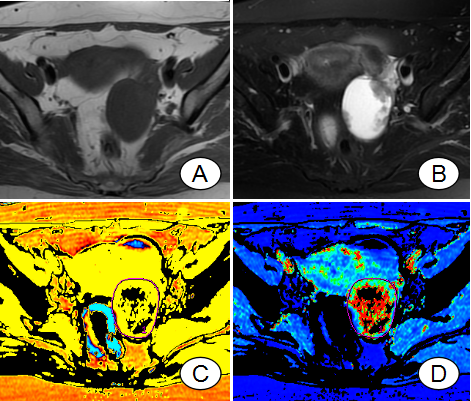
Thirty-four cases of patients with 27 lesions (14 BEOTs; 23 MEOTs) confirmed by pathology were retrospectively analyzed. MRI scan including ESWAN sequence was performed on a 1.5T scanner (GE Signa HDXT). The applied imaging parameters were as follows. Fat suppression T2: TR=4000 ms, TE=125 ms, FOV=40 cm×40 cm, NEX=4.0, slice-thickness=4.0 mm, slice-gap=1 mm; LAVA: TR=3.9 ms, TE=1.9 ms, FOV=40 cm×40 cm, NEX=0.71, slice-thickness=5.0 mm, slice-gap=2.5 mm; ESWAN: axial 3D, matrix=256×192, TR=16.3 ms, TE=2.1 ms, 5 echoes, flip angle=12°, bandwidth=+/~62.5 kHz, FOV=40 mm, slice-thickness=8 mm, reconstruction thickness=2 mm, NEX=0.67, scan matrix=256×192, reconstruction matrix=512×512, parallel acquisitions acceleration factor=2, breath hold≈21 s. The ESWAN images were transferred to a GE SDC-ADW 4.6 workstation for post-processing. The magnitude, phase, R2* and T2* maps were constructed automatically and were blindly reviewed and analyzed by two experienced radiologists. The manual regions of interest (ROIs) were drawn along the boundaries of tumors on the slice with maximal solid area, according to fat suppression T2WI and LAVA (Figure 1 and 2). A P value less than 0.05 was considered as statistically significant. The consistency of results measured by two observers was tested by intraclass correlation coefficients (ICC) using SPSS 22.0 statistical software for data analysis. The data with better intra-observer agreement were used for the statistical analysis. The magnitude, phase, R2* and T2* values of BEOTs and MEOTs were compared in independent-sample t test. The receiver operating characteristic (ROC) curve was used to evaluate the diagnostic efficiency.Results
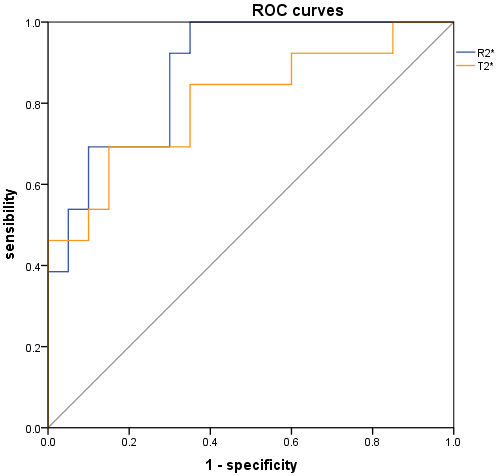
ICCs were all bigger than 0.9. The values of magnitude and phase between BEOTs and MEOTs didn’t show significant difference (P>0.05), while the values of R2* and T2* between BEOTs and MEOTs showed significant difference (Figure 3). The R2* value of BEOTs was statistically lower than that of MEOTs ([5.98±1.79 vs. 11.40±3.66] Hz; P= 0.00), whereas the mean T2* value of BEOTs was statistically higher than that of MEOTs ([187.91±75.57 vs. 129.09±28.48] ms; P=0.01). The area under the curve (AUC) of R2* values was 0.894 and the corresponding cutoff value was 7.50 Hz, with a sensitivity and specificity of 85.7% and 82.6% respectively. The AUC of T2* values was 0.776 and the corresponding cutoff value was 143.73 ms with a sensitivity and specificity of 71.4%and 82.6% respectively (Figure 4).Discussion
ESWAN is sensitive to paramagnetic deoxygenated blood products, such as deoxyhemoglobin[3]. The R2* values of MEOTs are higher than that of BEOTs in the present study. R2* is related to the oxygenation state of hemoglobin[4]. The necrosis and hemorrhage in cystic components of MEOTs are more common than of BEOTs, whereas the deoxyhemoglobin concentration is higher than in MEOTs, which lead to an increased R2* values. Angiogenesis in solid components of MEOTs are more than that of BEOTs, making the oxygen uptake increased and resulting in increased R2* values. T2* values are positively correlated with the free movement of water molecules[5] and the trend of T2* is inversely proportional to R2*. MEOTs contain more separations and solid components. In theory, the water molecules content of MEOTs are lower than that of BEOTs, and the movement of water molecules are limited relatively. Therefore the T2* values of MEOTs are lower than those of BEOTs.Conclusion
The R2* and T2* values of MR-ESWAN can be used as a non-enhancement quantitative index in differentiating BEOTs from MEOTs. The R2* showed higher sensitivity than T2*. ESWAN technique would be very promising in differentiating BEOTs from MEOTs.Acknowledgements
No acknowledgement foundReferences
1. Helpman L,Beiner ME,Aviel-Ronen S, et al. Safety of ovarian conservation and fertility preservation in advanced borderline ovarian tumors. Fertil Steril. 2015;104(1):138-144
2. Li YA, Qiang JW, Ma FH, et al. MRI features and score for differentiating borderline from malignant epithelial ovarian tumors. Eur J Radiol. 2018;98:136-142
3. Jian-Ying Xin, Shan-Shan Gao, Jin-Gang Liu, et al. The value of ESWAN in diagnosis and differential diagnosis of prostate cancer: Preliminary study. Magn Reson Imaging, 2017; 44: 26-31
4. Yu DX, Ma XX, Zhang XM, et al. Evaluation of blood oxygen level in hepatocellular carcinoma with noninvasive magnetic resonance multi-echo R2* technique and its clinical significance. Zhonghua Yi Xue Za Zhi, 2010; 90(21):1463-1466
5. Salmenpera T, Kalviainen R, Partanen K, et al. Hippocampal and amygdaloid damage in partial epilepsy: a cross-sectional MRI study of 241 parients. Epilepsy Res, 2001,46(1):69-82
Figures