0101
Prediction of Neoadjuvant Chemoradiation Therapy Response in Rectal Cancer Using Radiomics Compared to Deep Learning Based on Pre-Treatment and mid-RT MRIYang Zhang1, Liming Shi2, Ke Nie3, Xiaonan Sun2, Tianye Niu2, Ning Yue3, Tiffany Kwong1,3, Peter Chang1, Daniel Chow1, Jeon-Hor Chen1,4, and Min-Ying Lydia Su1
1Department of Radiological Sciences, University of California, Irvine, CA, United States, 2Department of Radiation Oncology, Sir Run Run Shaw Hospital, Zhejiang University School of Medicine, Hangzhou, China, 3Department of Radiation Oncology, Rutgers-The State University of New Jersey, New Brunswick, NJ, United States, 4Department of Radiology, E-Da Hospital and I-Shou University, Kaohsiung, Taiwan
Synopsis
The capability to predict patients’ response to neoadjuvant chemoradiation therapy is important for improving their management. The multi-parametric MRI (T2, DWI, DCE) performed before treatment and after 3-4 weeks of radiation were analyzed to predict final pathological response. Quantitative radiomics was performed using GLCM texture and histogram parameters, and also ROI and deep learning using convolutional neural network (CNN) were performed. Combining quantitative radiomics features with tumor volume and diffusion coefficient could achieve accuracy of 0.86 for pCR vs. non-pCR and 0.93 for GR vs. non-GR, and adding follow-up to pre-treatment MRI could improve accuracy, especially for CNN analysis.
Introduction
The current standard-of-care treatment for locally advanced rectal cancer (LARC) is neoadjuvant chemoradiotherapy (CRT) followed by total mesorectal excision (TME), which is associated with significant complications and morbidity. Following CRT, around 15% to 27% of patients can achieve pathologic complete response (pCR). Several studies have shown that pCR patients have low rates of local recurrence, and thus less invasive, alternative surgical treatments such as sphincter-saving local excision, or watch-and-wait approaches, are gaining popularity [1-4]. It is important to identify patients who are likely to be clinical complete responders (CCR) so a less aggressive surgery, not TME, can be performed to confirm pCR. On the other hand, for patients who were not responding well to the CRT, early prediction would allow the switch to more effective drug regimens sooner and avoid unnecessary toxicities, or to avoid delayed surgery. In a previous study we performed deep learning using convolutional neural network (CNN) to predict CRT response [5], but did not achieve a high accuracy, presumably due to the small case number. In the present study, we performed radiomics analysis to differentiate different response groups. The MRI performed before treatment and in mid-RT follow-up after 3-4 weeks of radiation treatment were analyzed separately first, then combined to investigate whether the addition of mid-RT MRI can improve accuracy achieved by using pre-treatment MRI alone.Methods
A total of 51 LARC patients (mean age 59) were studied. MRI was performed on 3T, using a multi-parametric protocol including T1, T2, DWI, and DCE using the LAVA sequence with 4 frames, L1 before contrast injection, and L2, L3, L4 at 15s, 60s, and 120s after injection. Only complete MRI datasets that included all sequences and had high quality for quantitative analysis were analyzed. 45 patients had pre-treatment MRI, 41 patients had mid-RT follow-up MRI, but only 35 patients had both pre-treatment and mid-RT MRI. The total radiation dose was 50 Gy, delivered for 25 fractions in 5 weeks using the IMRT technique. Patients also received capecitabine 825 mg/m2 orally, twice daily for 5 consecutive weeks and oxaliplatin 110 mg/m2 once every 3 weeks. After a recovery period of two weeks (6-8 weeks after completing radiation), TME was performed. Following surgery, the specimen was examined by an experienced gastrointestinal pathologist using the modified tumor regression grade (TRG): TRG-0 (pCR, no viable cancer cells), TRG1 (only a small cluster or isolated cancer cells remaining), and TRG 2 & 3 (with extensive residual cancer). The tumor region of interest (ROI) was manually outlined on post-contrast enhanced image, and mapped to other sequences. The total tumor volume and mean ADC were calculated from these ROI. Them radiomics analysis was performed using 18 GLCM textural features and 12 histogram-based parameters (10%, 20% … 90%, 100% values, kurtosis, and skewness). For each case, a total of 96 parameters were calculated, including 18 textures on T1, 18 textures on T2, 18 textures + 12 histogram parameters on the ADC map and 18 textures + 12 histogram parameters on DCE L2 image. The feature selection was done using an artificial neural network, with 4-fold cross-validation. After a final model was developed, the overall classification performance was evaluated using receiver operating characteristic (ROC) analysis in the entire dataset. Deep learning was performed using CNN architecture, using 6 sets of images: T2, two DWI (b=0 and 800 s/mm2), and DCE (L1, L2, L3). Figure 1 illustrates the generation of the smallest bounding box for CNN.Results
The analysis was done to differentiate pCR (TRG 0) vs. non-pCR (TRG 1+2+3) and good responders GR (TRG 0+1) vs. non-GR (TRG 2+3). Figure 2 shows the comparison of the mean tumor volume and the mean ADC in the 4 different response groups. The tumor volume and ADC value in each group are listed in Table 1. The results suggested that smaller tumors were more likely to achieve a good response either as pCR or GR. Regarding ADC, there was a statistically significant increase after treatment in the mid-RT follow-up MRI compared to the pre-treatment MRI in all 4 groups (p<0.001). For patients who had both MRI sets, Figure 3 shows the waterfall plots of the volumetric percent change in 4 groups. The area under the ROC curve (AUC) based on T1+T2, ADC, DCE post-contrast image, all radiomics, and ROI+radiomics are shown in Table 2. The CNN was performed using 45 pre-treatment alone, 41 mid-RT alone, and the combined MRI from 35 patients. The results are also listed in Table2, which shows that the CNN prediction accuracy is inferior to that of radiomics.Discussion
In this study, we applied radiomics and deep learning using CNN based on the pre-treatment and early follow-up MRI after 3-4 weeks of radiation to predict the pathologic response of patients with LARC receiving neoadjuvant CRT. For all methods, the combined information from pre-treatment and mid-RT follow-up achieved a higher accuracy in predicting response compared to using either MRI dataset alone. Using ROI-based tumor volume and mean ADC combined with radiomics features could achieve a high accuracy of 0.86 to differentiate pCR from non-pCR, and 0.93 to differentiate GR from non-GR. Although a CNN with appropriate normalization scheme could be implemented to predict the response, the range of accuracy was only fair, most likely due to the small number of datasets that were not sufficient for training and cross-validation.Acknowledgements
This study was supported in part by NIH R01 CA127927, the Rutgers Cancer Institute of New Jersey (No. P30 CA072720), Chinese National Natural Science Foundation (No. 81441086, 81672976), Natural Science Foundation of Zhejiang Province (No. LY14H160016), Major Science and Technology Program of Zhejiang Province (No. 2013C03044-6).References
[1] Borschitz et al. Neoadjuvant chemoradiation and local excision for t2-3 rectal cancer. Annals of surgical oncology 2008;15:712-720. [2] Marijnen CA. Organ preservation in rectal cancer: Have all questions been answered? The lancet oncology 2015;16:e13-e22. [3] Renehan et al. Watch-and-wait approach versus surgical resection after chemoradiotherapy for patients with rectal cancer (the oncore project): A propensity-score matched cohort analysis. The Lancet Oncology 2016;17:174-183. [4] Ludwig KA. Sphincter-sparing resection for rectal cancer. Clinics in colon and rectal surgery 2007;20:203. [5] Zhang et al. Machine Learning for Prediction of Chemoradiation Therapy Response in Patients with Locally-Advanced Rectal Cancer (LARC) Using Pre- and Early-Treatment Follow-up Multiparametric MRI. Presented at the Joint Annual Meeting ISMRM-ESMRMB, Paris, France, June 16-21, 2018; Program Number: 829.Figures
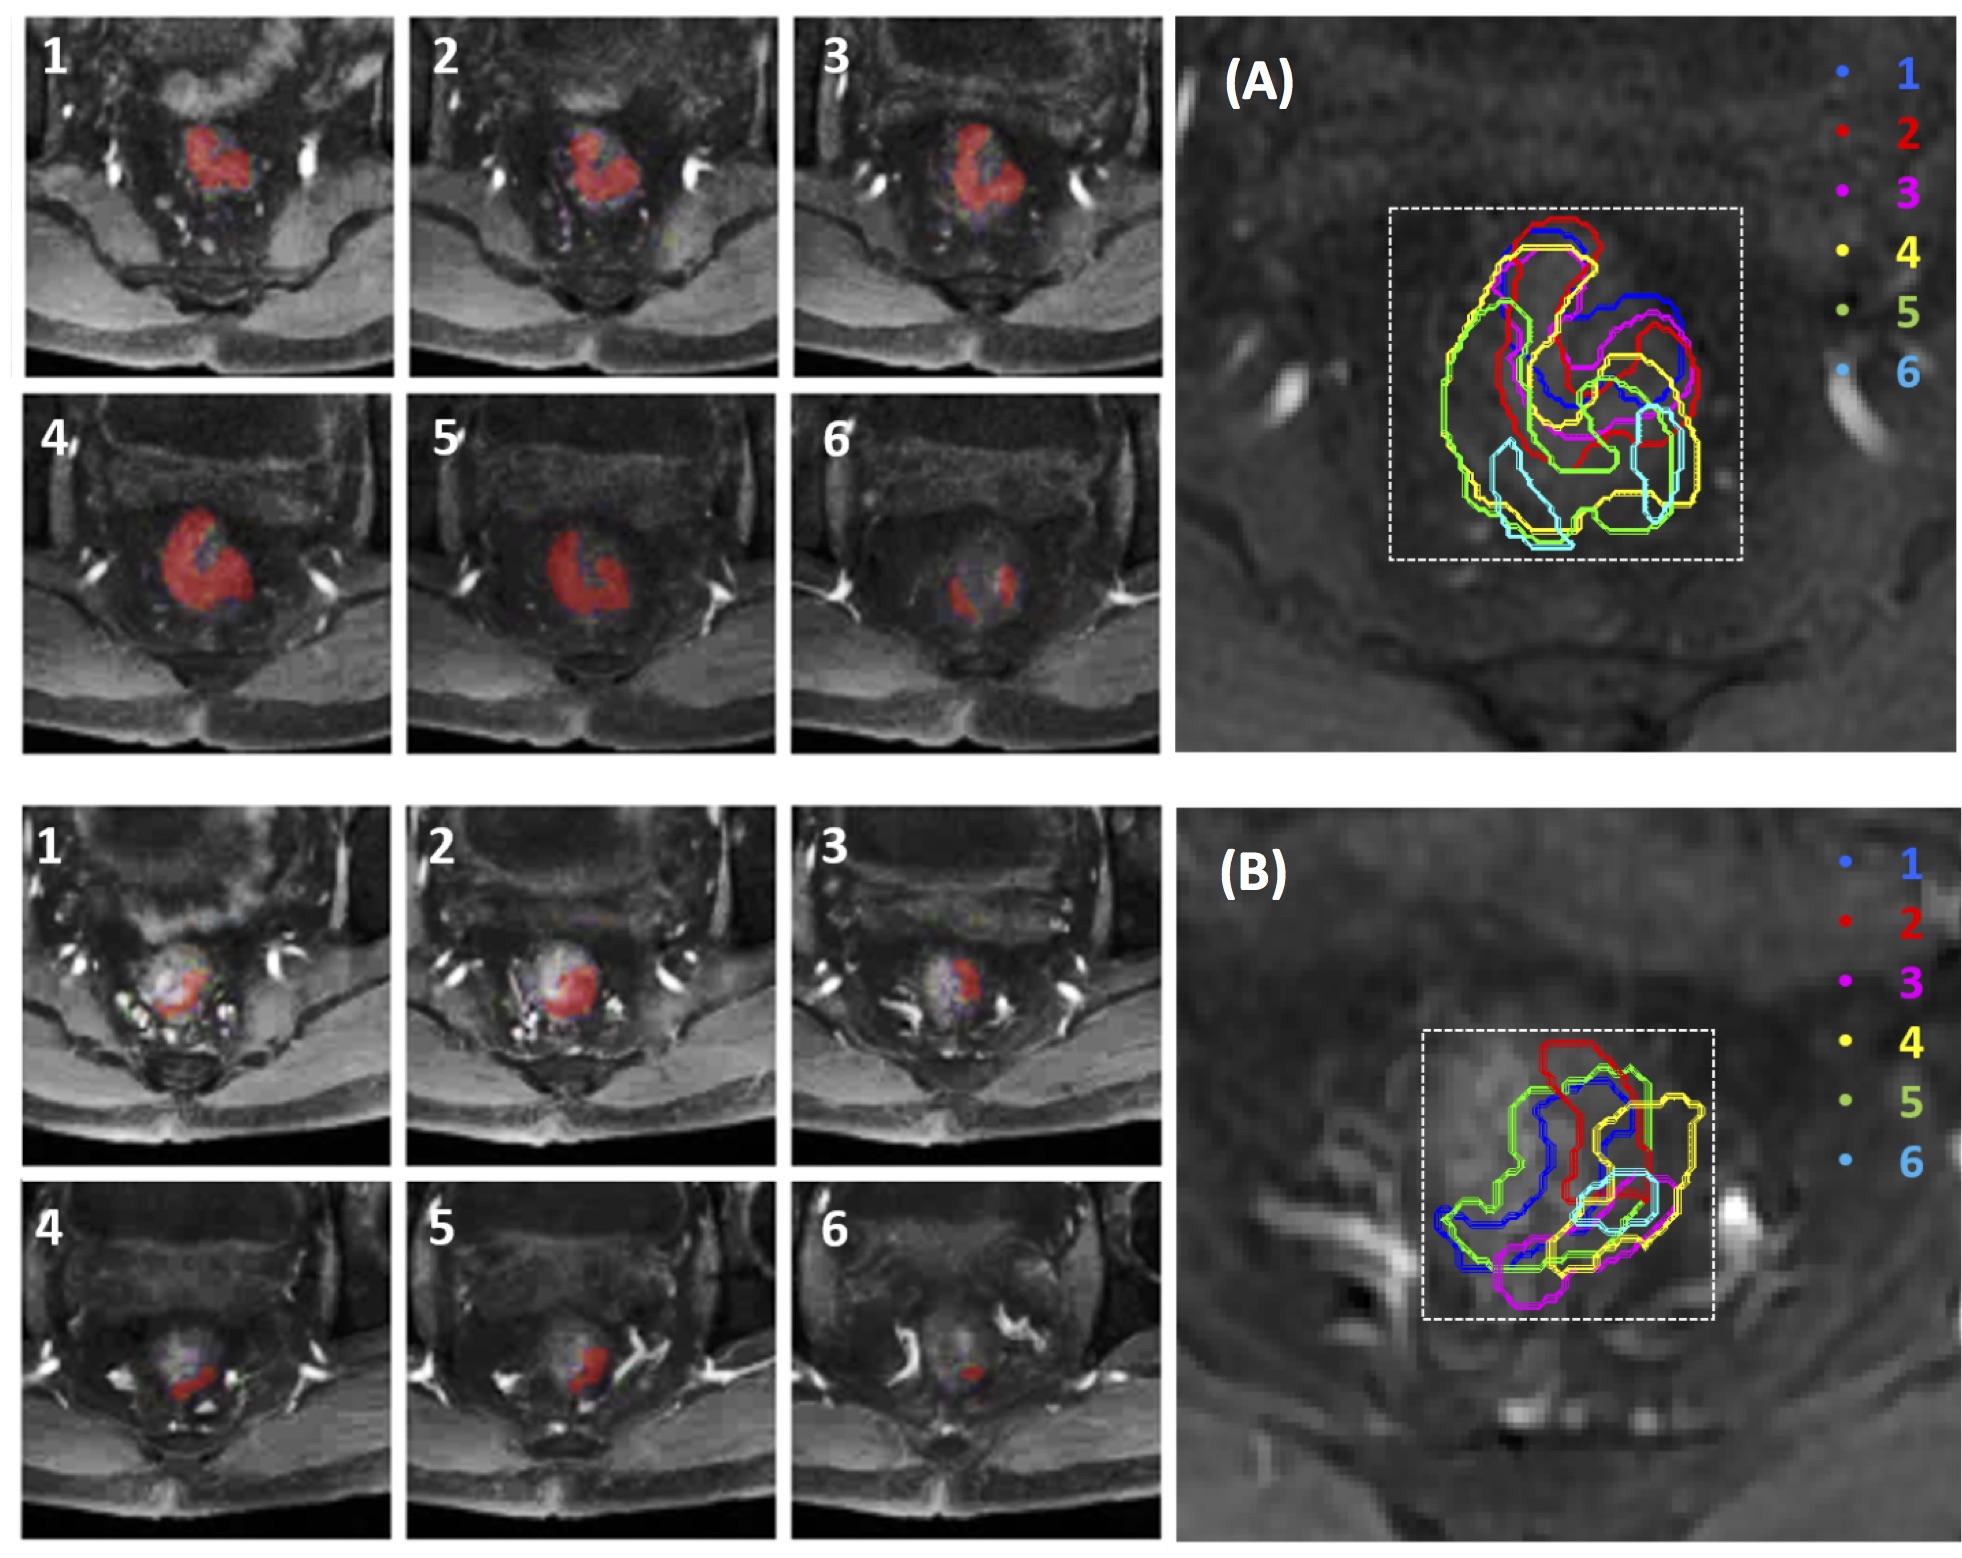
Figure 1.
Determination of smallest bounding box on pre-treatment MRI (A, top panel) and
mid-RT MRI (B, bottom panel) of a 56-year-old male with mid-rectum cancer at
stage of cT3N+M0. Tumor ROI (red) outlined on tumor-containing MR slices (1-6)
are stacked on a projection view to determine the smallest square bounding box.
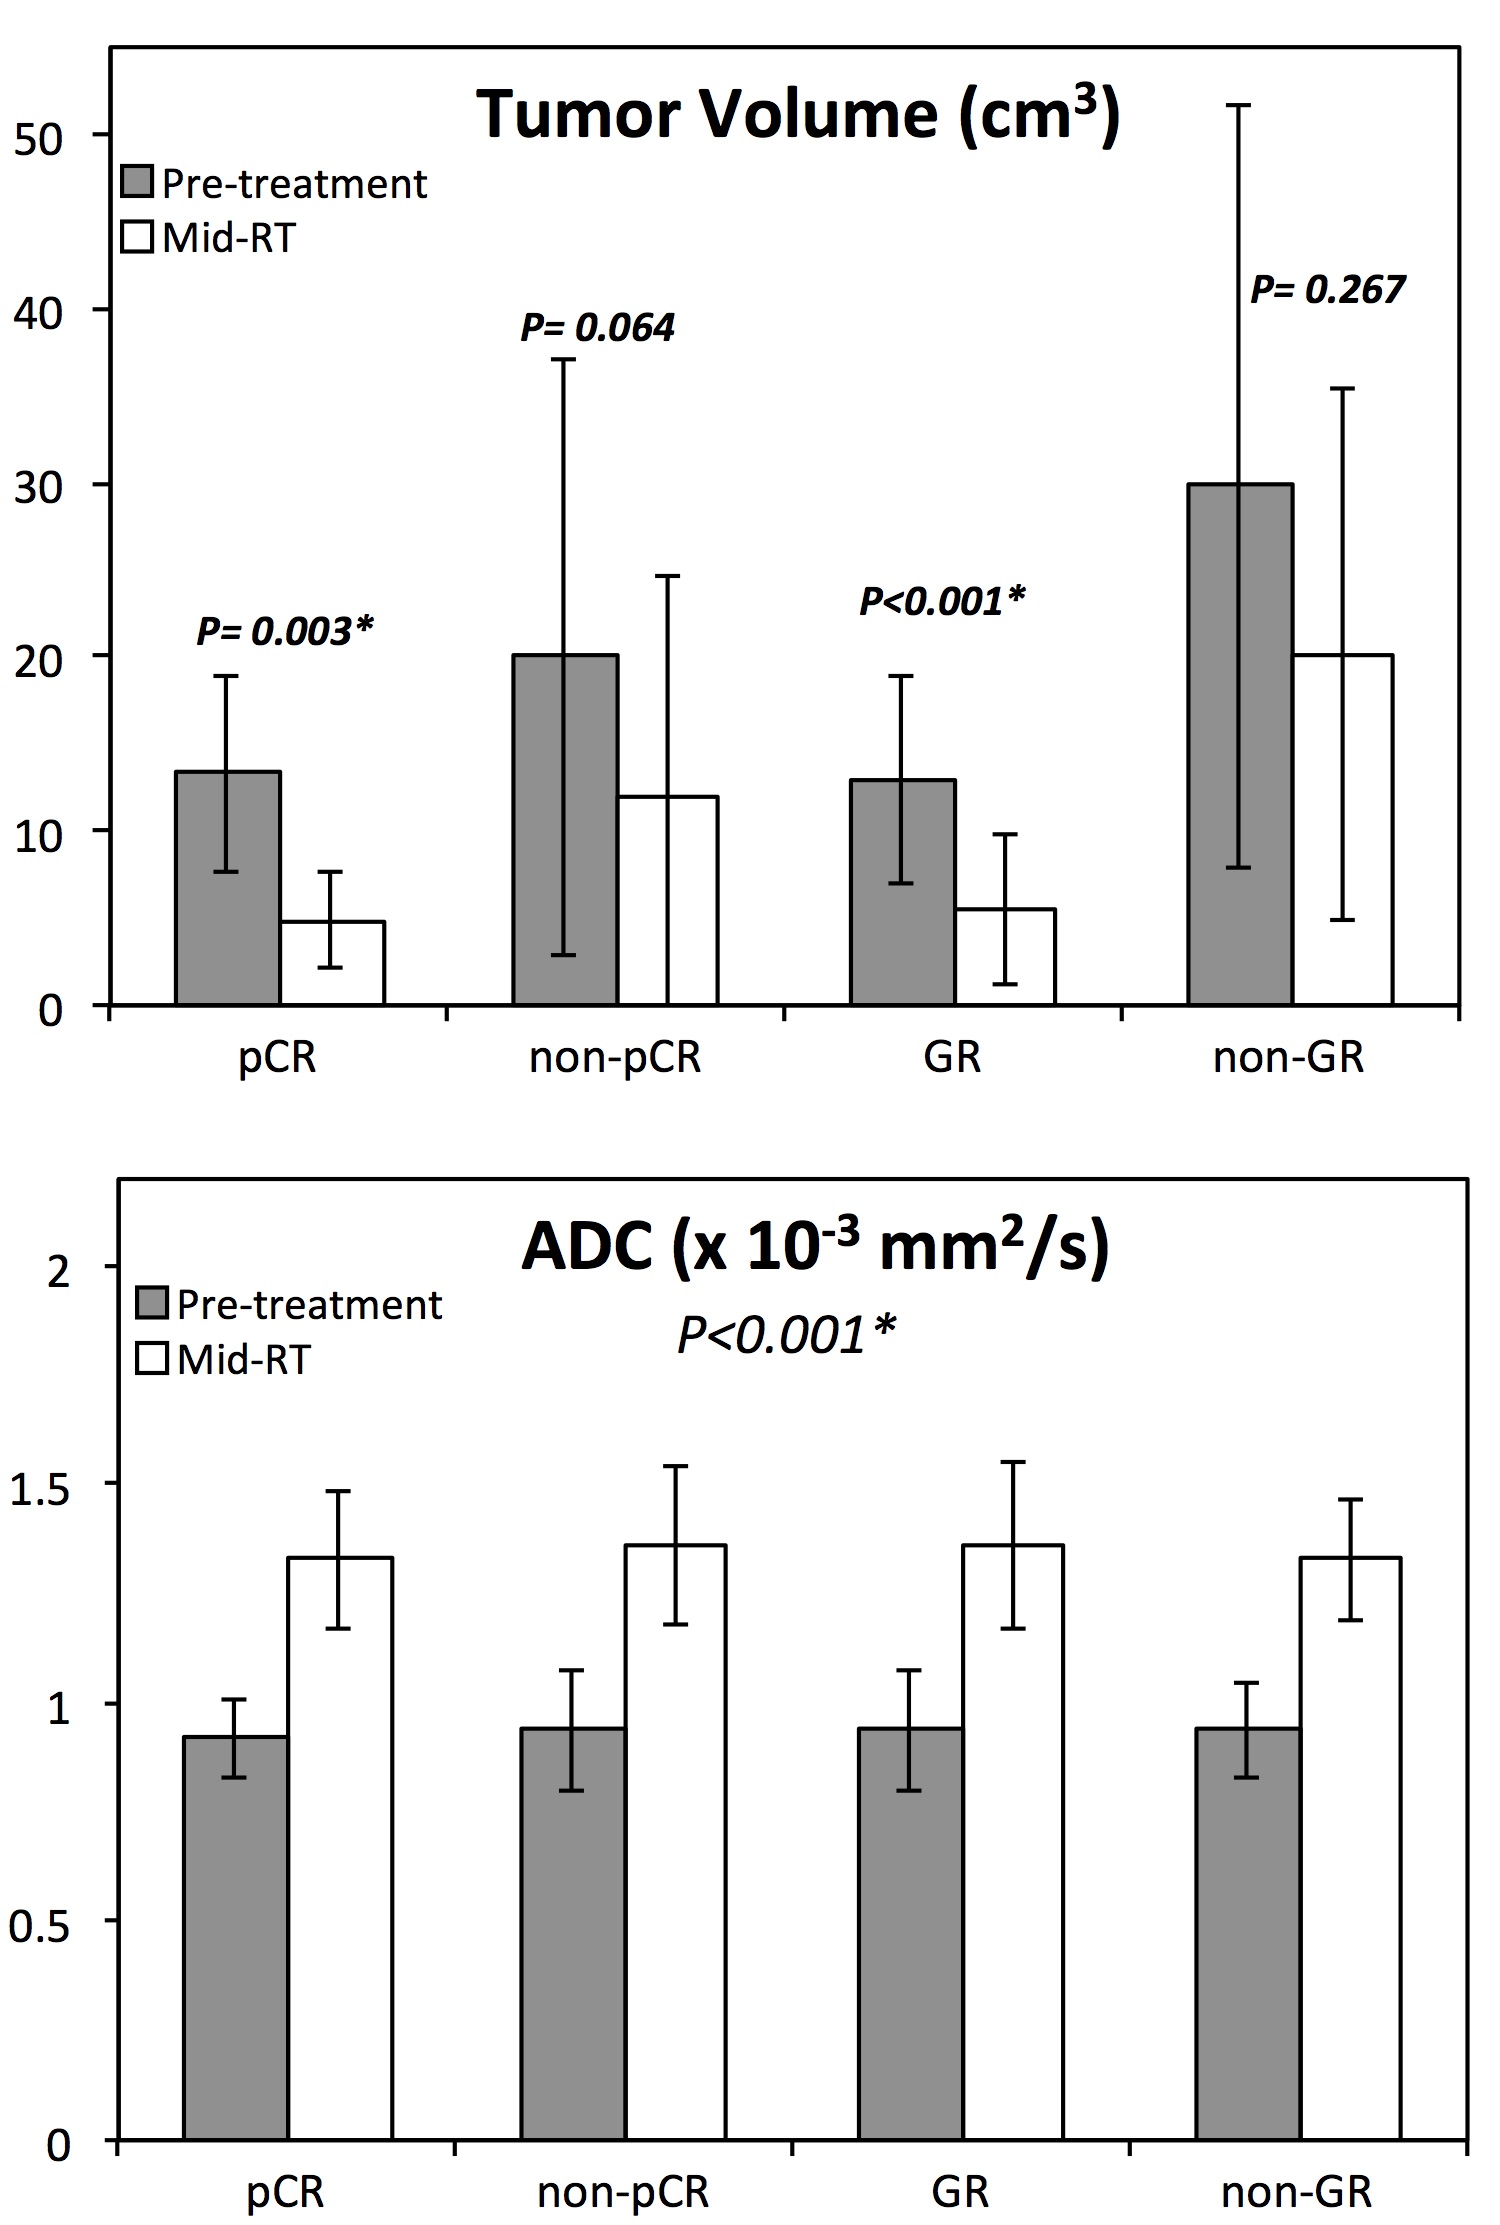
Figure 2.
Bar plots showing differences of tumor volume and ADC between the pre-treatment
(grey) and the mid-RT (white) in 4 response groups. The tumor volume decreases
in mid-RT follow-up compared to the pre-treatment MRI, and significant in the
pCR and GR groups. The ADC increases in the mid-RT MRI compared to the
pre-treatment MRI, and significant in all 4 groups.
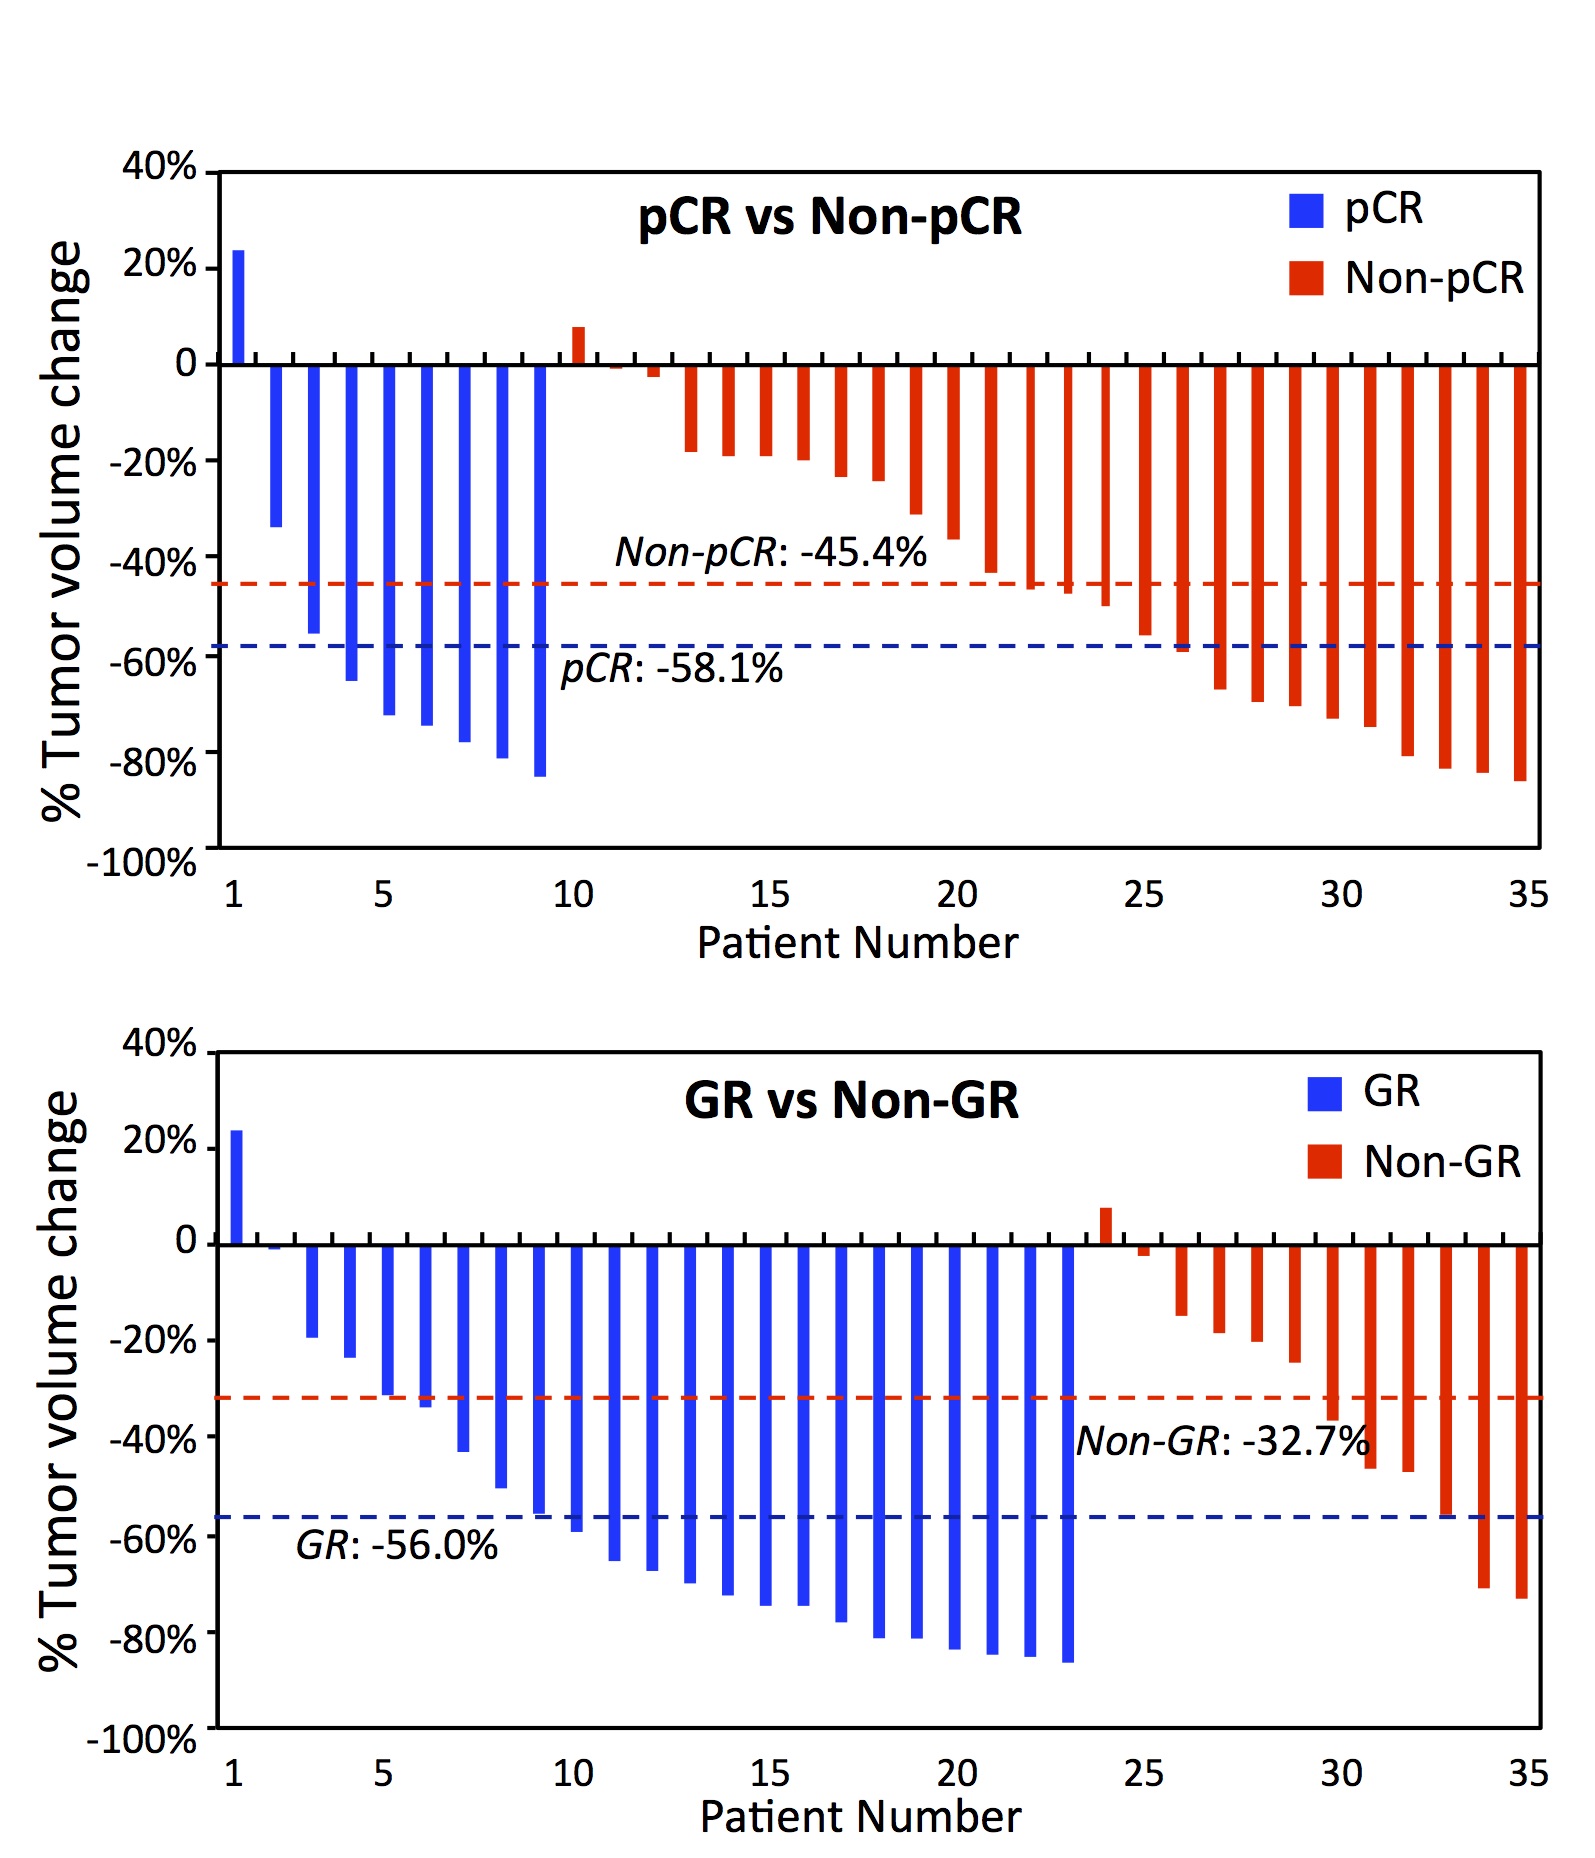
Figure 3.
Waterfall plots of percent change in tumor volume of 35 patients who have both
pre-treatment and mid-RT follow-up MRI. Top: Plot of pCR vs. non-pCR patients
with mean change of -58.1% vs. -45.4% (p=0.28). Bottom: Plot of GR vs. non-GR
with the mean change of -56.0% vs. -32.7% (p=0.03).
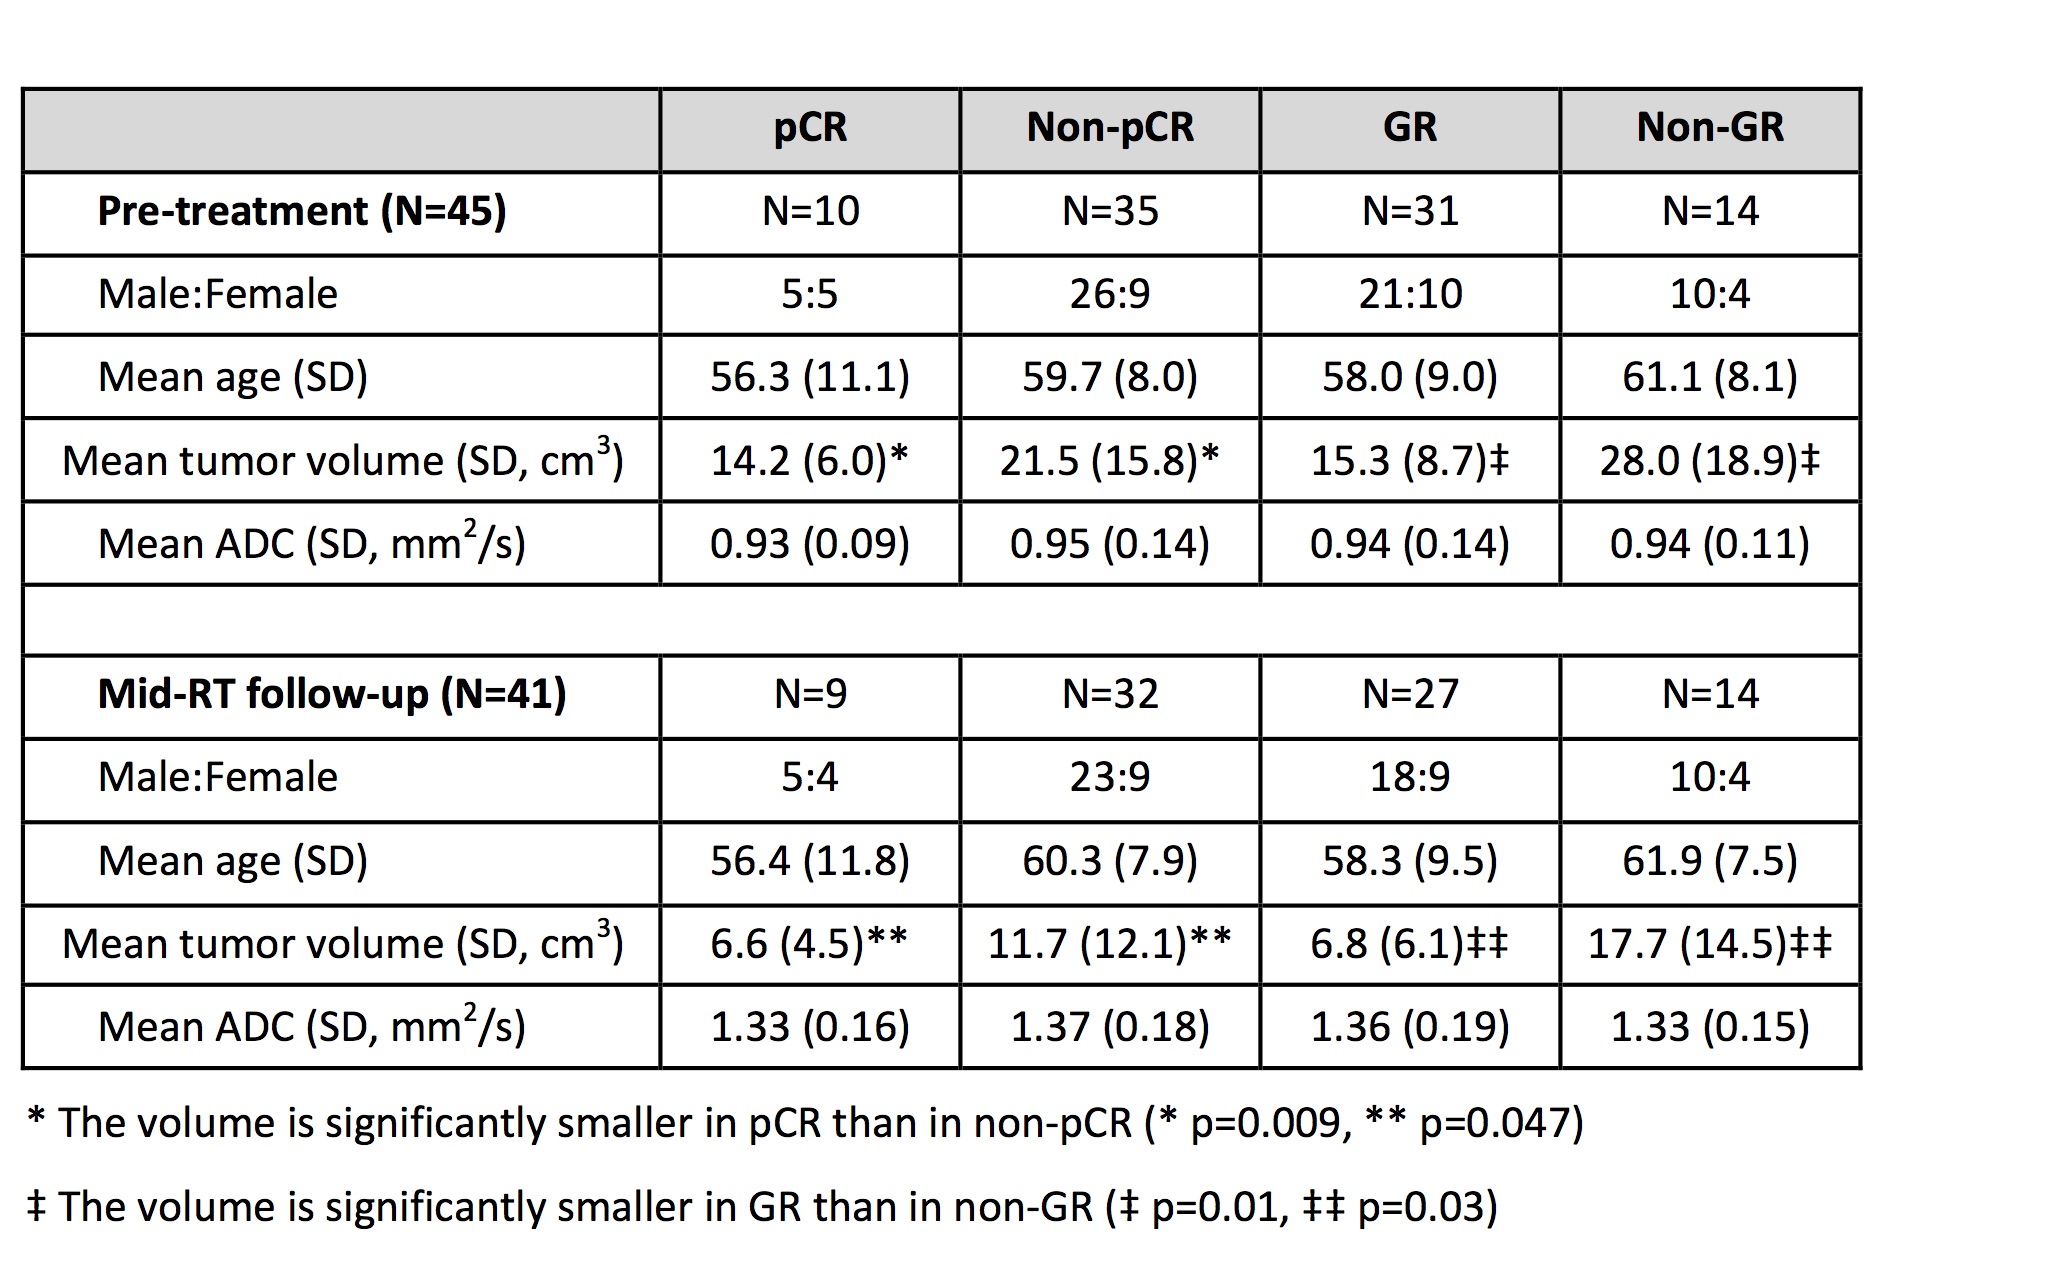
Table 1. The
demographic information, tumor volume and ADC in different response groups
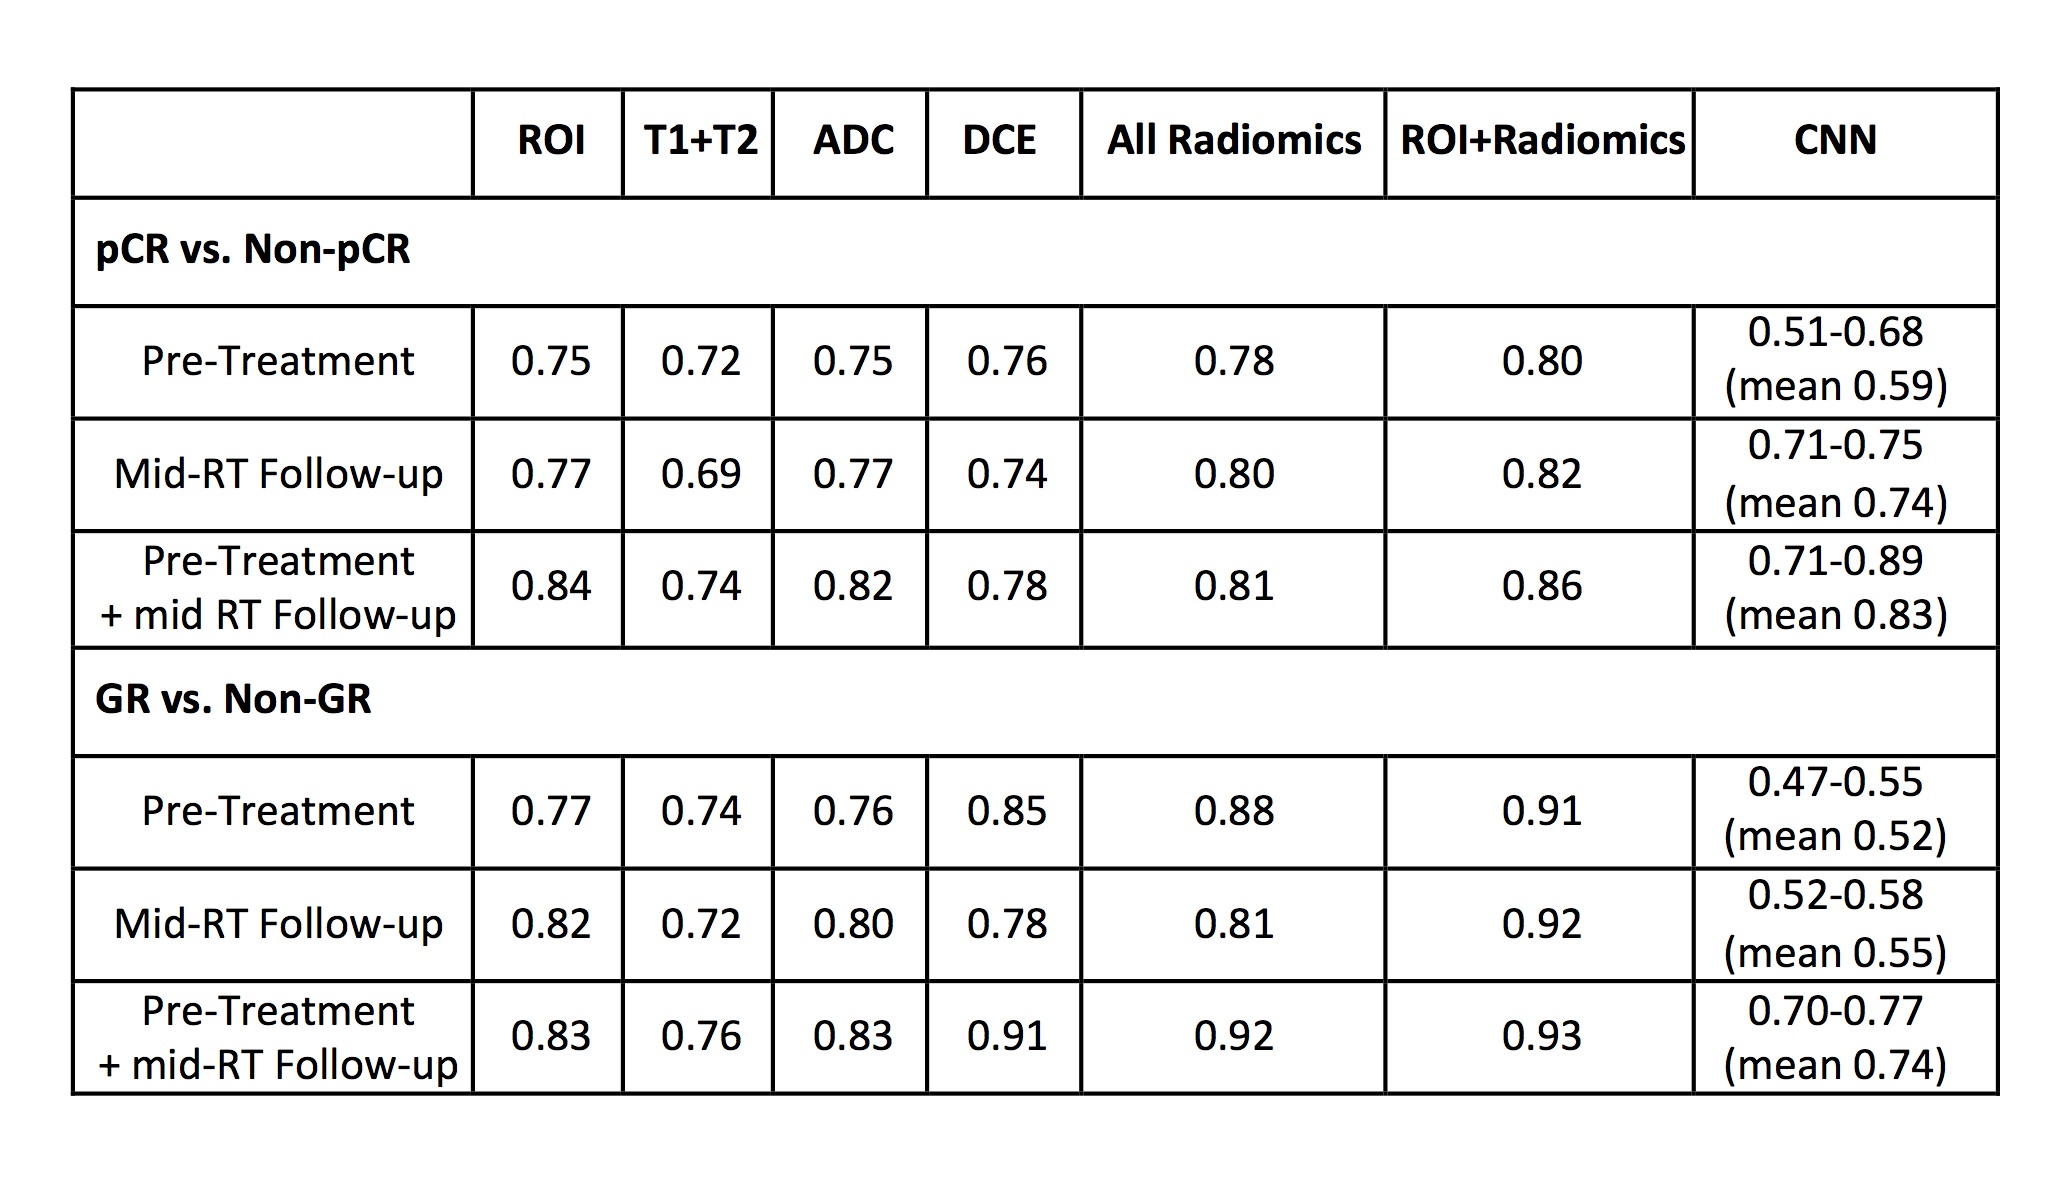
Table 2.
The area under the ROC curve in ROI-based parameters, voxelized radiomics
analysis and CNN deep learning to differentiate pCR vs. non-pCR and GR vs.
non-GR