0098
High b-value diffusion-weighted MRI in cervical cancer detection: Preliminary results1Center for MR Research,University of Illinois at Chicago, Chicago, IL, United States, 2Department of Diagnostic Radiology, National Cancer Center/Cancer Hospital, Chinese Academy of Medical Sciences and Peking Union Medical College, Beijing, China, 3Department of Bioengineering, University of Illinois at Chicago, Chicago, IL, United States, 4Departments of Radiology and Neurosurgery, University of Illinois at Chicago, Chicago, IL, United States
Synopsis
Cervical cancer remains one of the leading causes of cancer-related deaths in women. High b-value DWI with non-Gaussian modeling has made it possible to probe tumor tissue complexity, microstructures, and heterogeneity. We employed a non-Gaussian diffusion model based on continuous-time random walk (CTRW) theory to differentiate normal from cancerous cervical tissues. The CTRW parameters (Dm and β) exhibited a statistically significant difference between cancerous cervical tissue and normal. Our preliminary results illustrate the added value of high b-value DWI for cervical cancer detection, and point to a possible direction of diagnosing or staging cervical cancer using non-Gaussian diffusion models.
Introduction:
Cervical cancer remains one of the major causes of morbidity and mortality among women globally. Apparent diffusion coefficient (ADC) calculated from the conventional mono-exponential model (i.e., a Gaussian-based model) has been used for characterizing cervical cancer tissues [1-3]. Over the past few years, diffusion-weighted imaging (DWI) with high b-value has been increasingly applied to cancer studies [4]. Concurrent with high b-value diffusion imaging, more sophisticated non-Gaussian diffusion models have been developed. For example, a novel diffusion model based on the continuous-time random walk (CTRW) theory was introduced to characterize complex heterogeneous structures in biological tissues [5-8]. In this study, we investigated whether a new set of parameters from the CTRW model can be used to differentiate between malignant and normal cervical tissues.Methods:
Patients: Under approval by the Institutional Review Board and with written informed consent, this study involved a total of 51 female patients (ages: 31-84 years) with histopathologically proven cervical cancer.
Image Acquisition: All patients underwent MRI examination on a 3T scanner (GE MR750) with an 8-channel coil. In addition to routine T1 and FSE T2 imaging, DWI with 12 b-values (0, 50, 100, 250, 500, 750, 1000, 1300, 1600, 2000, 2500, 3000 s/mm2) was performed with the following parameters: TR/TE=3500/76.4ms, slice thickness=5mm, FOV=36cm×36cm, matrix size=256×256, and total scan time ≈ 7 minutes. Trace-weighted images were obtained to minimize the effect of diffusion anisotropy.
Diffusion Analysis: The multi-b-value diffusion images were analyzed with the conventional mono-exponential model and the CTRW model, $$S(b)/S_{0}=E_{\alpha}(-(bD_{m})^{\beta}),$$ where Dm is an anomalous diffusion coefficient, α and β are temporal and spatial diffusion heterogeneity parameters, respectively, and Eα is a Mittag-Leffler function. A least squares algorithm was used for nonlinear fitting. The ADC was calculated using two b-values (50 and 750 s/mm2), while the CTRW parameters were estimated using all b-values.
Statistical
Analysis: The contrast-enhancing ROIs of cervical cancer and normal cervical
tissue were drawn by a senior radiologist on images with b=750 s/mm2, guided by other MR images. A quantitative comparison (paired-samples
t-test), using the means of Dm, α, β, or ADC within the ROIs, was carried out to test the statistical
differences between cervical cancer and normal uterine cervix. The receiver
operating characteristic (ROC) analysis was also utilized to evaluate the
performance of tissue differentiation.
Results:
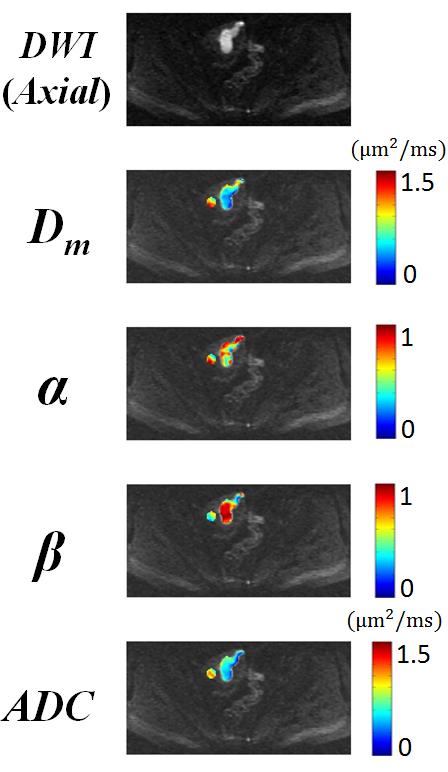
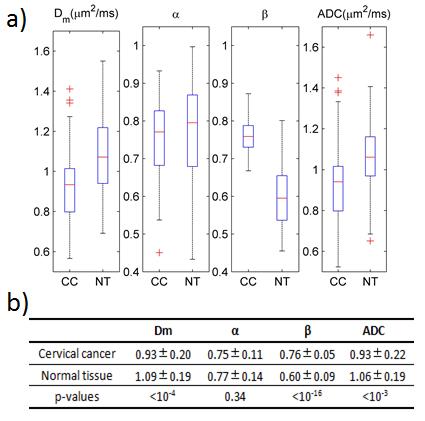
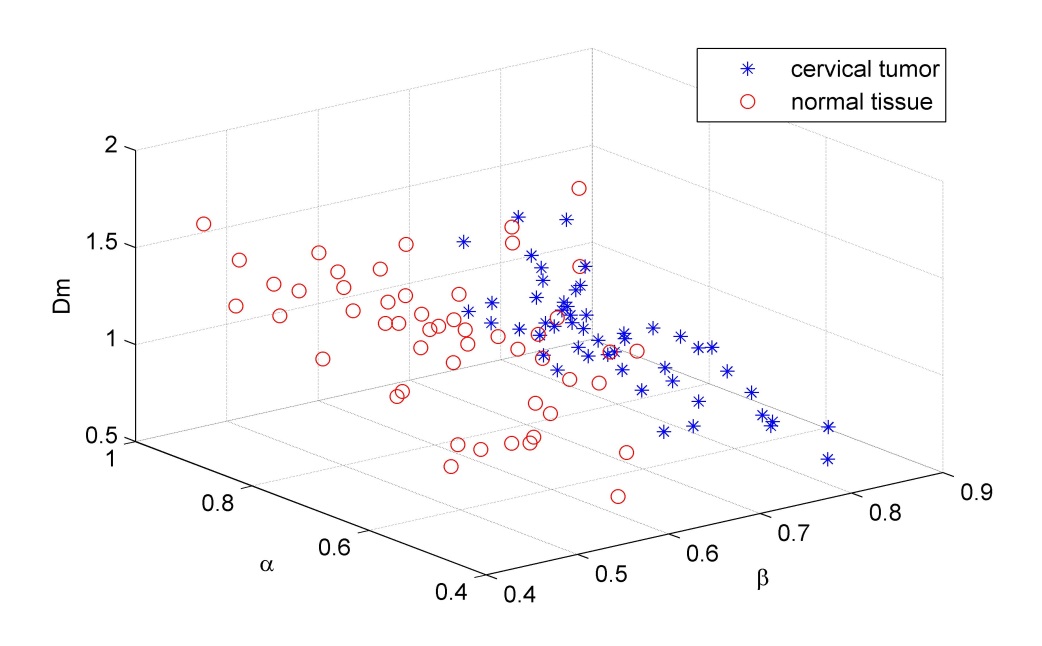
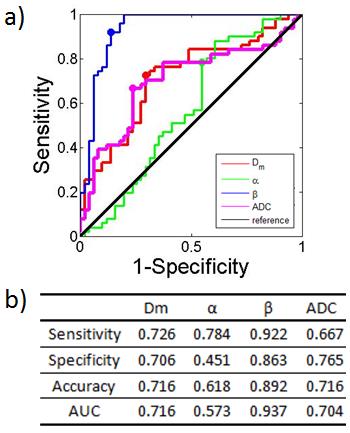
Maps of Dm, α, β, and ADC, as well as an image with b=750 s/mm2 from a representative patient, were shown in Figure 1. In comparison with normal cervical tissue, the cancer tissues exhibited higher value in β, and lower values in Dm and ADC. This observation was substantiated by boxplots of the CTRW parameters and ADC in Figure 2a, and sample means and standard deviations in Figure 2b. The CTRW parameters (Dm and β) and ADC exhibited a statistically significant difference between cervical cancer and normal tissues. The best performance of differentiating cervical cancer from normal tissues was achieved by using the CTRW parameter β (p-value<10-16). The 3D scatter plots in Figure 3 shows that the CTRW parameters can effectively separate the cervical tumors from normal tissues. The ROC results for using different CTRW parameters to differentiate cervical cancer from normal tissues are displayed in Figure 4. β from the CTRW model offered the best sensitivity (0.922), specificity (0.863), diagnostic accuracy (0.892), and the area under the curve (AUC, 0.937).Discussion and conclusion:
In this study, we investigated the value of high b-value DWI for differentiating cervical cancer from normal cervical tissues using a CTRW diffusion model. This model can provide additional parameters (Dm and β) beyond conventional ADC for tissue characterization and cancer detection. Although the performance of Dm is comparable to that of ADC, the performance of β is notably superior. These preliminary results provide evidence showing the added value of high b-value DWI for cervical cancer detection, and point to a possible direction of diagnosing or staging cervical cancer using non-Gaussian diffusion MRI techniques.Acknowledgements
This work was supported in part by NIH 1S10RR028898 and General Electric Healthcare China.References
1. V. N. Harry, S. I. Semple, F. J. Gilbert, et al., Diffusion-weighted magnetic resonance imaging in the early detection of response to chemoradiation in cervical cancer. Gynecol Oncol, 2008. 111(2): p. 213-20.
2. P. Z. McVeigh, A. M. Syed, M. Milosevic, et al., Diffusion-weighted MRI in cervical cancer. Eur Radiol, 2008. 18(5): p. 1058-64.
3. S. Naganawa, C. Sato, H. Kumada, et al., Apparent diffusion coefficient in cervical cancer of the uterus: comparison with the normal uterine cervix. Eur Radiol, 2005. 15(1): p. 71-8.
4. L. Tang, X. J. Zhou, Diffusion MRI of cancer: From low to high b-values. J Magn Reson Imaging, 2018 (online early view).
5. R. L. Magin, O. Abdullah, D. Baleanu, et al., Anomalous diffusion expressed through fractional order differential operators in the Bloch-Torrey equation. J Magn Reson, 2008. 190(2): p. 255-70.
6. X. J. Zhou, Q. Gao, O. Abdullah, et al., Studies of anomalous diffusion in the human brain using fractional order calculus. Magn Reson Med, 2010. 63(3): p. 562-9.
7. C. Ingo, R. L. Magin, L. Colon-Perez, et al., On random walks and entropy in diffusion-weighted magnetic resonance imaging studies of neural tissue. Magn Reson Med, 2014. 71(2): p. 617-27.
8. M. M. Karaman, Y. Sui, H. Wang, et al., Differentiating low- and high-grade pediatric brain tumors using a continuous-time random-walk diffusion model at high b-values. Magn Reson Med, 2016. 76(4): p. 1149-57.
Figures