0090
5D flow MRI: A free-running, fully self-gated, radial imaging framework for cardiac and respiratory motion-resolved assessment of 3D blood flow dynamics1Radiology, Northwestern University, Chicago, IL, United States, 2Biomedical Engineering, Northwestern University, Evanston, IL, United States, 3Radiology, Lausanne University Hospital (CHUV) and University of Lausanne (UNIL), Lausanne, Switzerland, 4Advanced Clinical Imaging Technology, Siemens Healthcare AG, Lausanne, Switzerland
Synopsis
Recent advances have enabled fully self-gated high resolution imaging using a Free-running framework, where data is continuously collected, retrospectively binned into cardiac and respiratory phases, and reconstructed using multi-dimensional compressed sensing (CS) for efficient functional and anatomical imaging of the heart. Here, we propose a novel expansion of this framework to cardiac and respiratory motion-resolved 3D flow imaging— or 5D flow MRI. The findings of this study show that 5D flow MRI is feasible in-vitro and in-vivo and can depict cardiac and respiratory-resolved 3D hemodynamics.
Purpose
3D-CINE-PC imaging, also known as 4D flow MRI, is hampered by long scan times (10-15 minutes for whole-heart applications) due to its multi-dimensional nature, as well as cumbersome ECG-gating and respiration control. While the effects of respiration on cardiopulmonary circulation are well-documented in physiologic literature (increased caval flow during inspiration)1,2, current 4D flow techniques typically use respiration-gating and thus discard data outside end-expiration. Consequently, respiratory-related changes in blood flow dynamics (e.g. Fontan patients and other subjects with venous abnormalities) cannot be investigated within reasonable scan times. Recent advances have enabled fully self-gated high resolution imaging using a Free-running framework, where data is continuously collected, retrospectively binned into cardiac and respiratory phases, and reconstructed using multi-dimensional compressed sensing (CS) for efficient functional and anatomical imaging of the heart.3,4 Here, we propose a novel expansion of this framework to cardiac and respiratory motion-resolved5 3D flow imaging— or 5D flow MRI. This study aimed to evaluate the feasibility of a prototype continuous-acquisition, radial, 5D flow MRI sequence for cardiac and respiratory motion-resolved evaluation of 3D hemodynamics in-vitro and in-vivo, in volunteers and patients with aortic valve disease.Methods
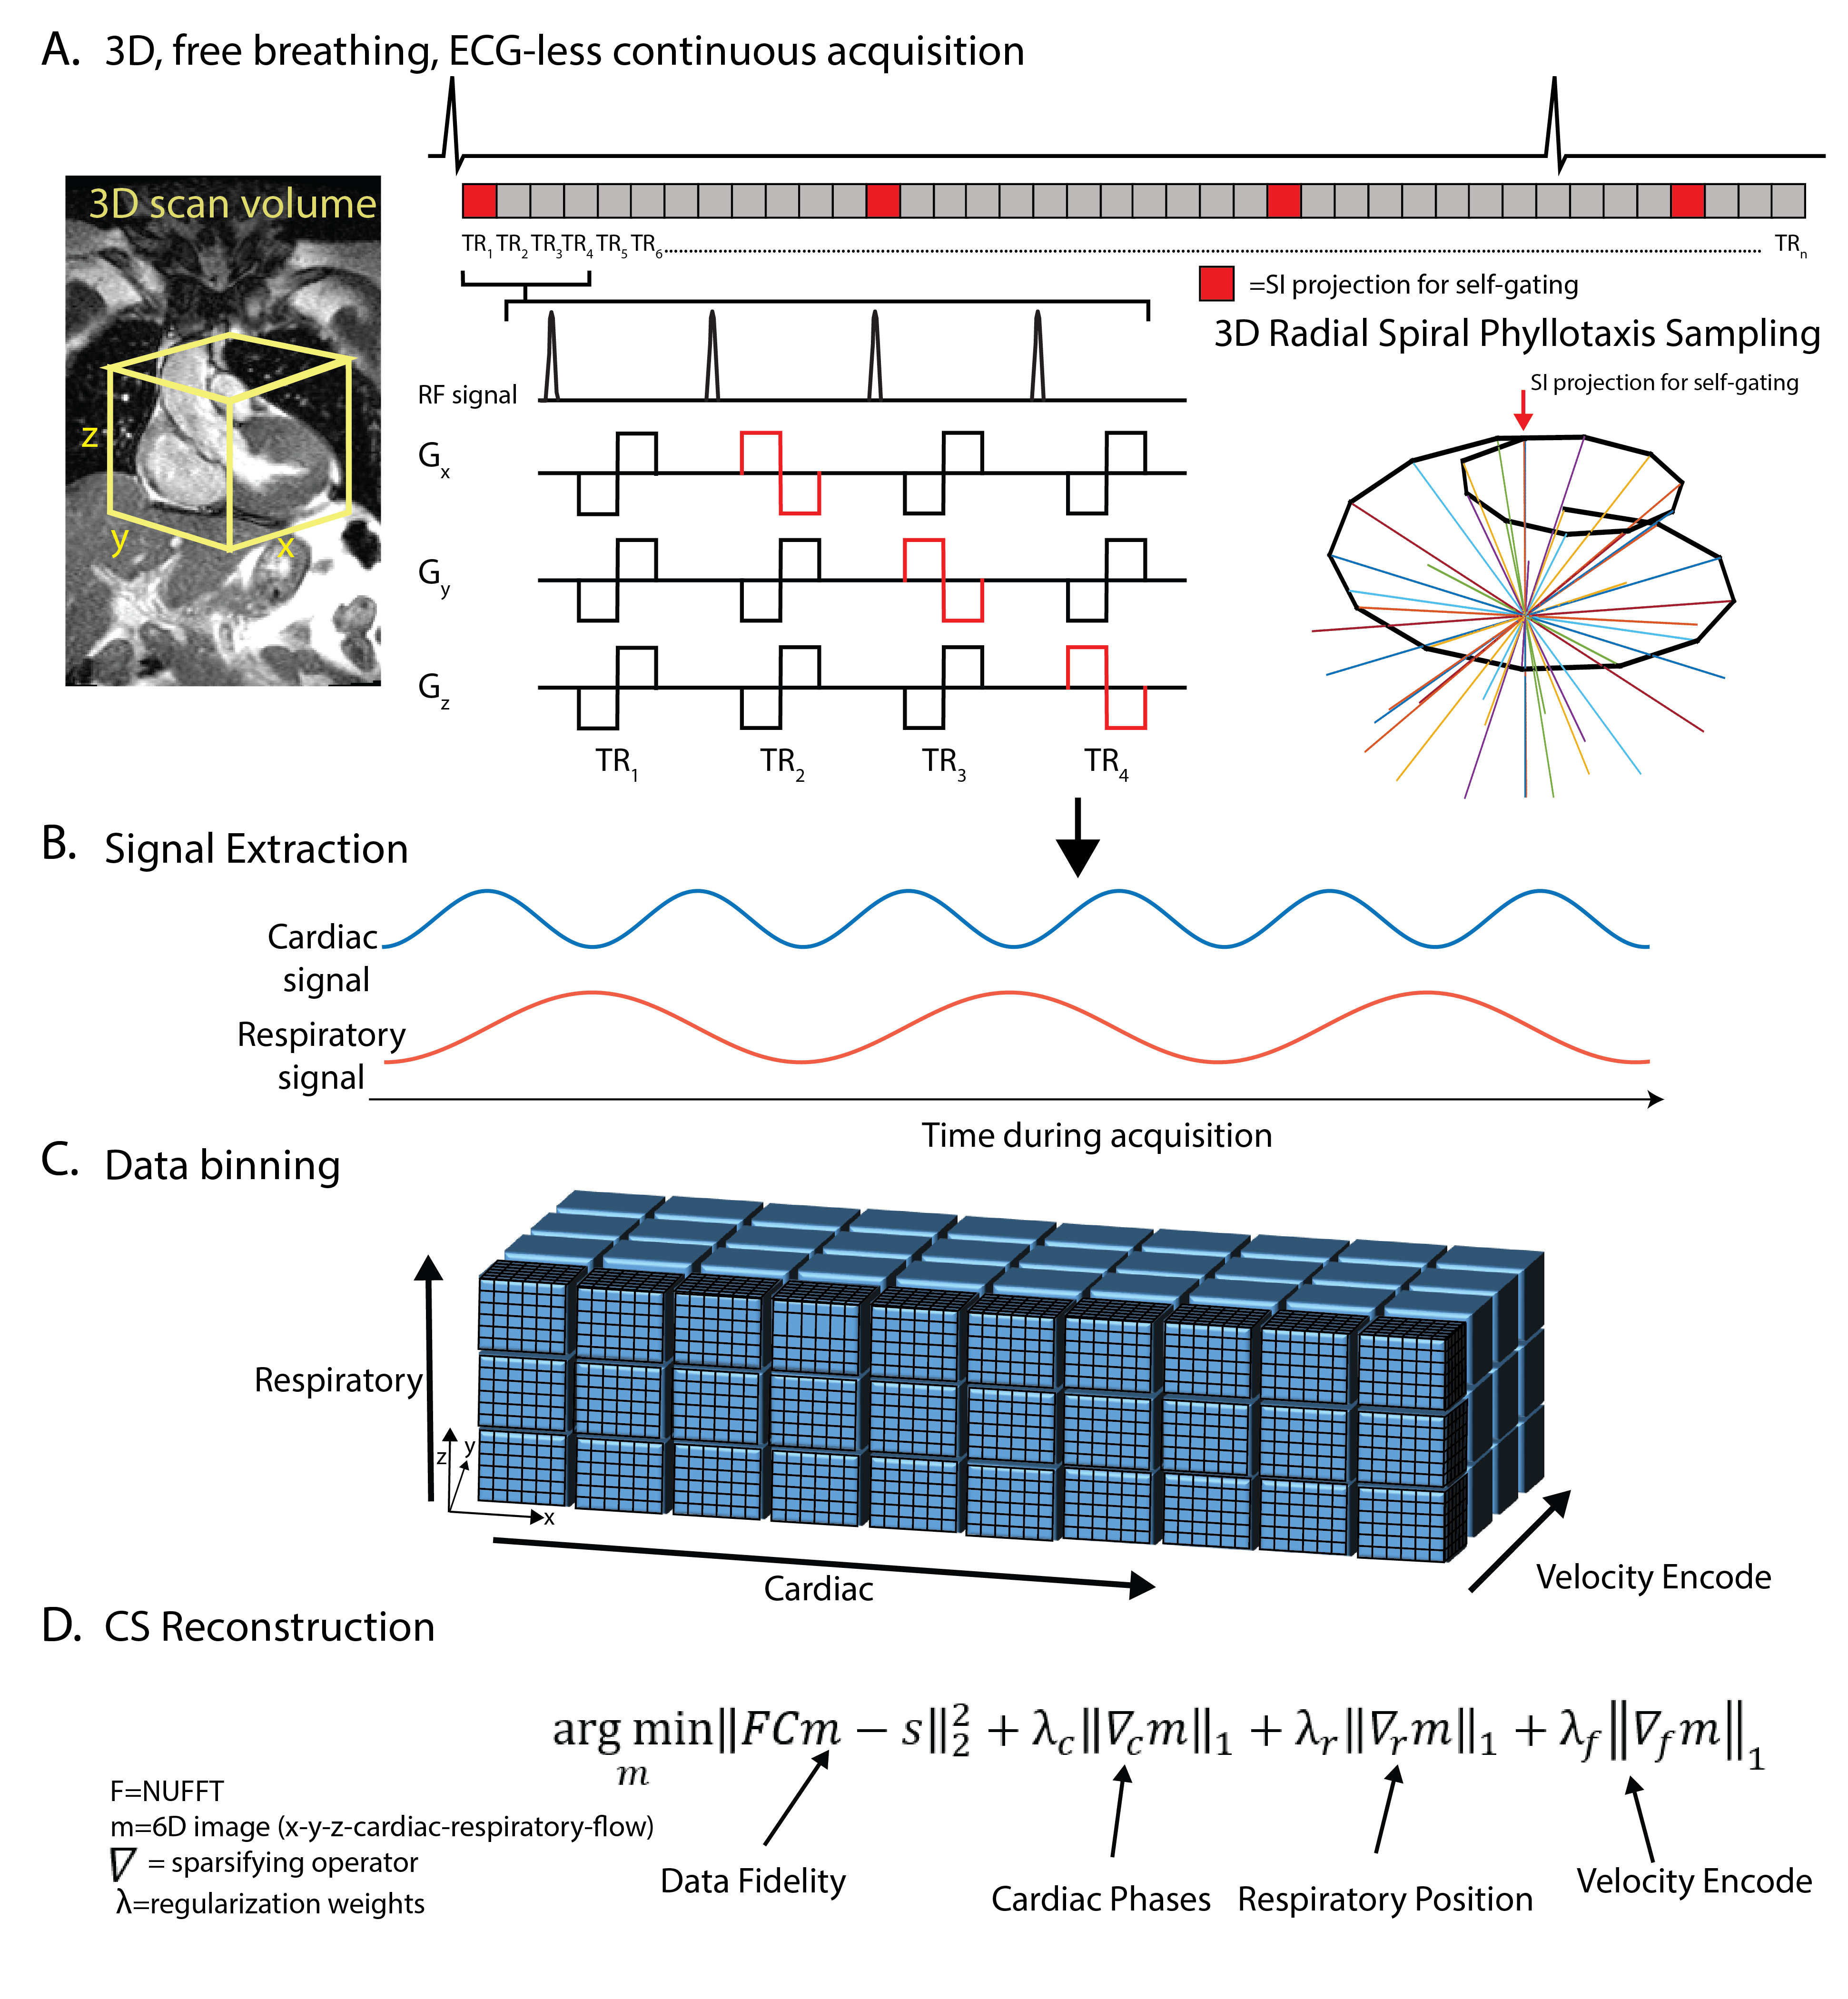
5D flow: As shown in Figure 1, a 5D flow sequence was implemented with bipolar velocity-encoding gradients in three orthogonal directions (x,y,z). 3D radial sampling following a spiral phyllotaxis pattern6 was interspersed with a self-navigation superior-inferior (SI) projections acquired at the beginning of each interleave.1 Cardiac and respiratory signals were extracted from SI profiles5 and used to bin the continuously acquired radial k-space lines into a 6D dataset (kx-ky-kz-cardiac-respiratory-flow) for reconstruction using CS. All imaging was performed at 1.5T (MAGNETOM Aera, Siemens Healthcare, Erlangen, Germany).
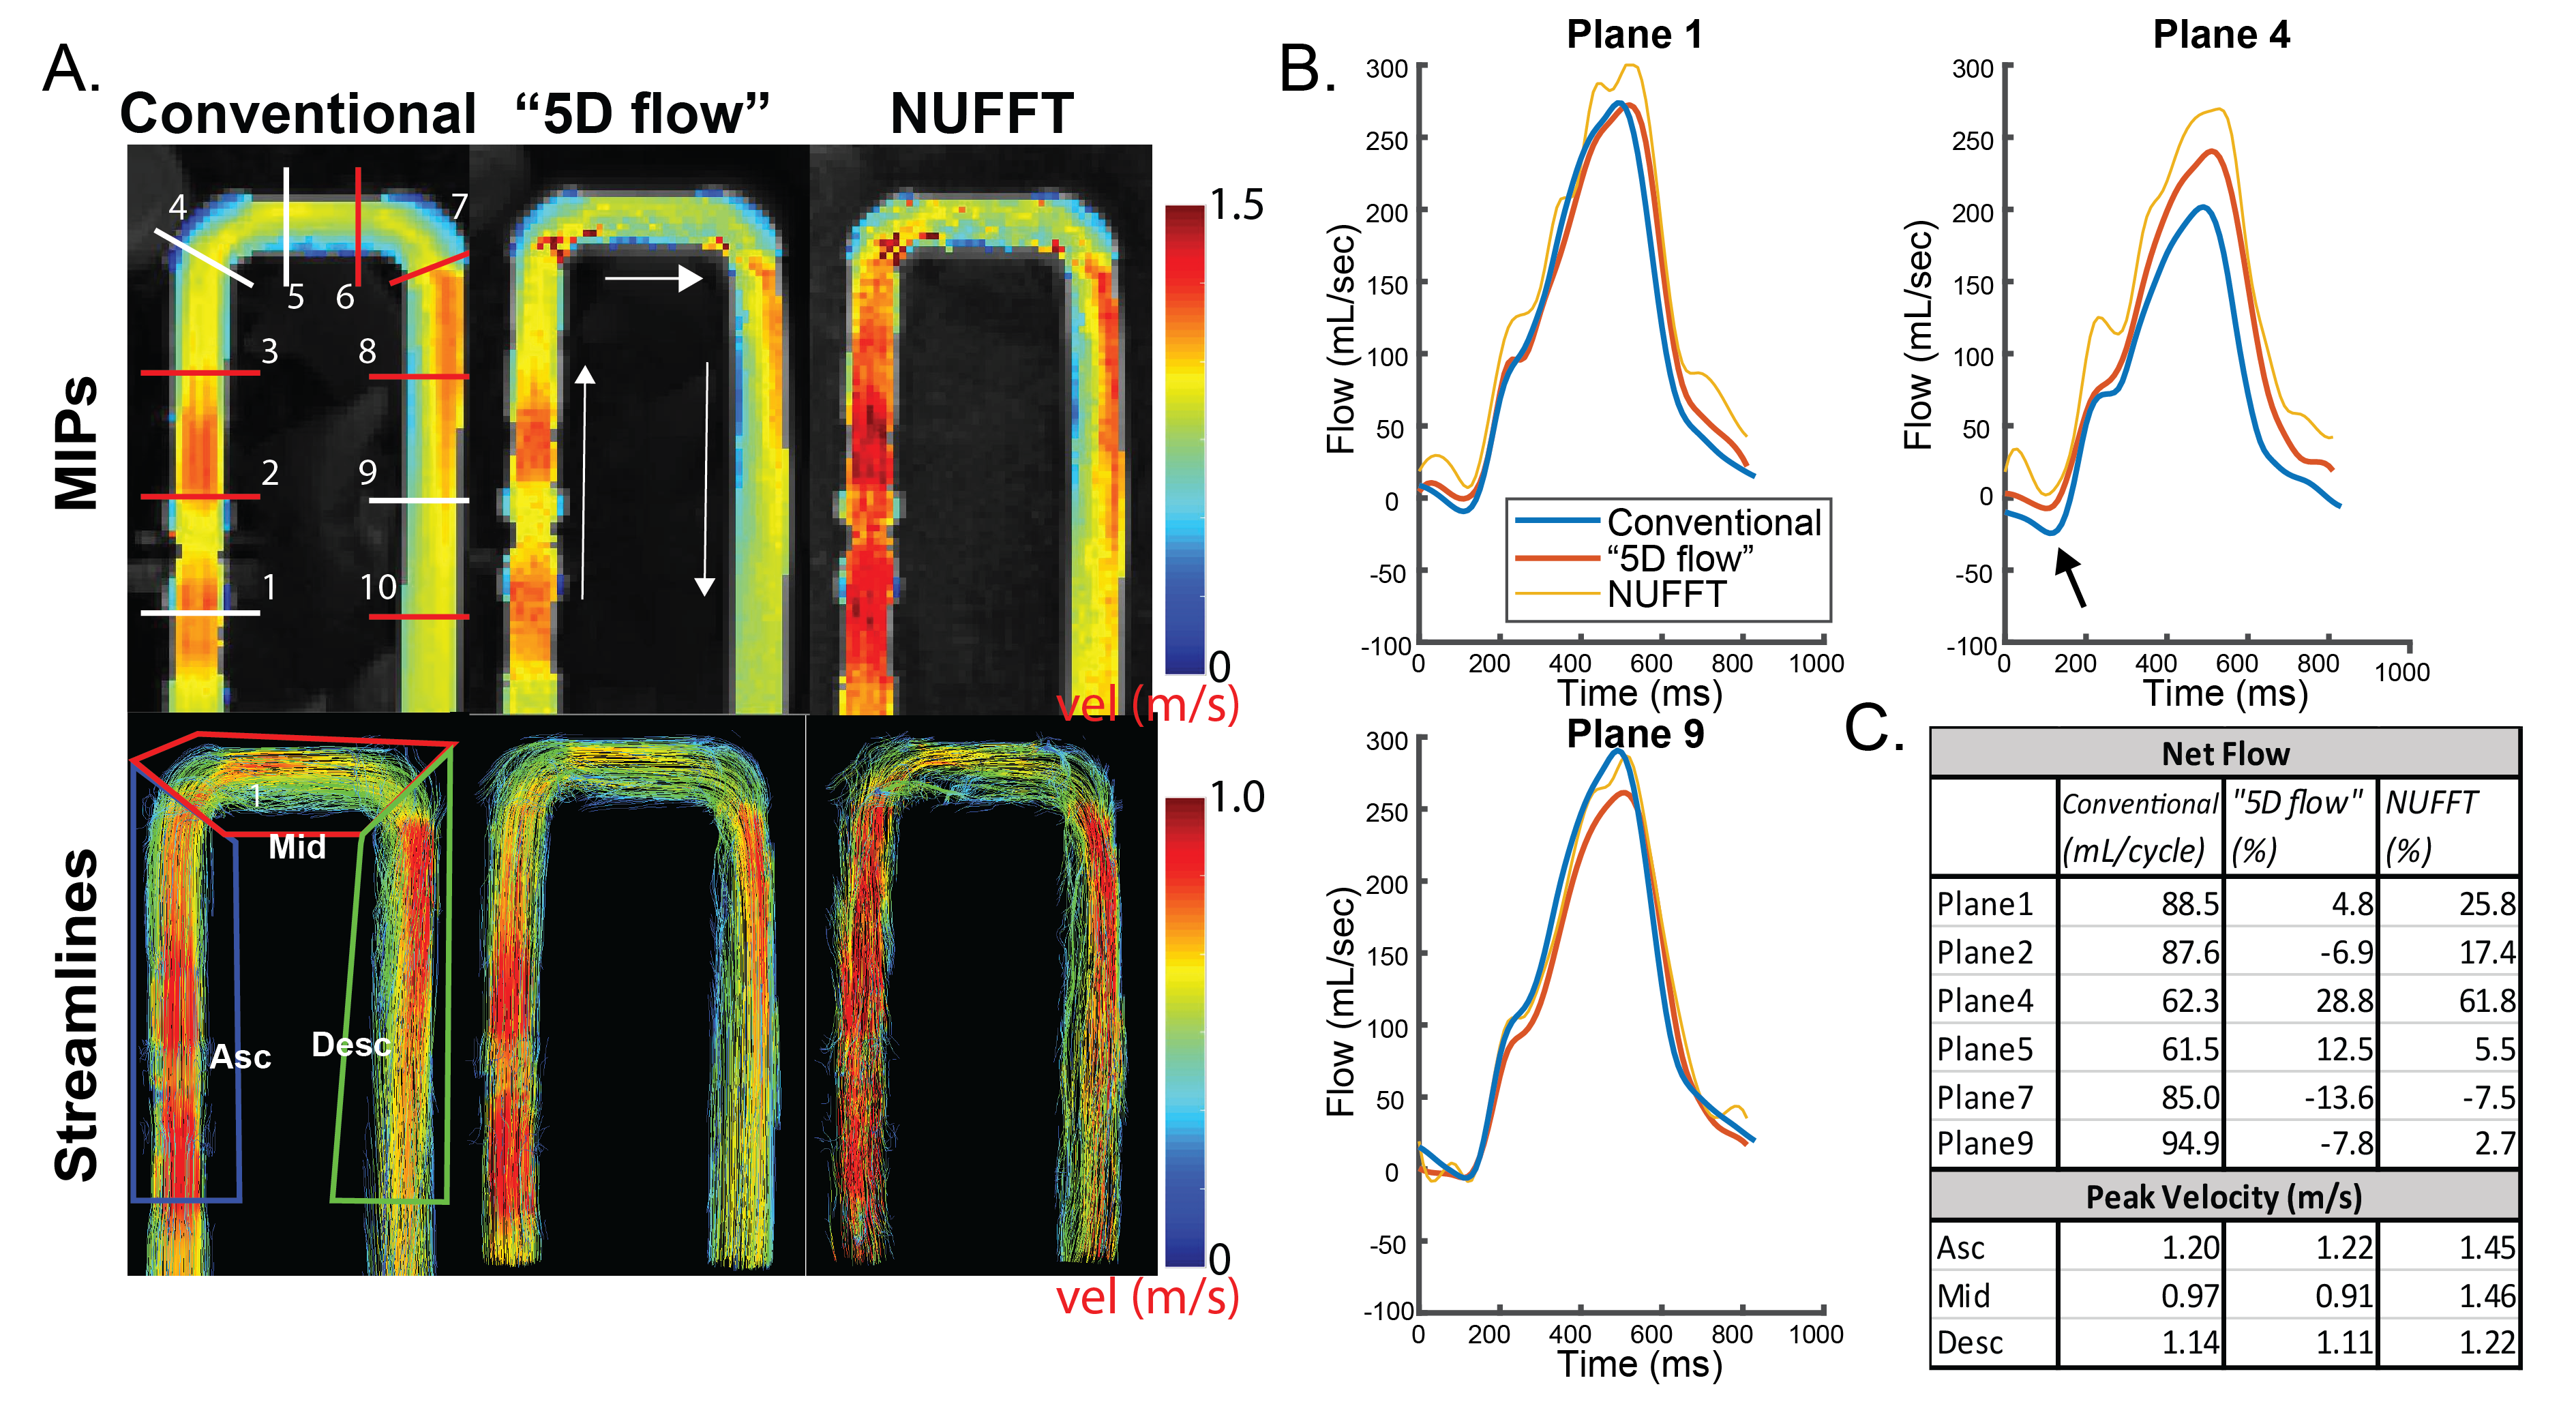
In-vitro: The 5D flow sequence was evaluated in-vitro using an MRI-compatible pulsatile flow pump and a U-shaped pipe. Data were acquired with isotropic spatial resolution [SR]=2.3 mm3, TE/TR/FA=3.1 ms/5.5 ms/15°, 130320 radial views, BW=600 Hz/pixel. k-space lines were sorted into 20 cardiac time frames for 43.0 ms reconstructed temporal resolution using acquired ECG timestamps, and reconstructed using a non-uniform FFT (NUFFT) or CS reconstruction. As a reference standard, a conventional Cartesian 4D flow scan was acquired with matched reconstructed SR (GRAPPA R=2, retrospective ECG-gating, acquired SR=2.3x2.3x2.8mm3, TE/TR/FA=2.36/5.1/15°, BW=455 Hz/pixel, temp res=40.8 ms).
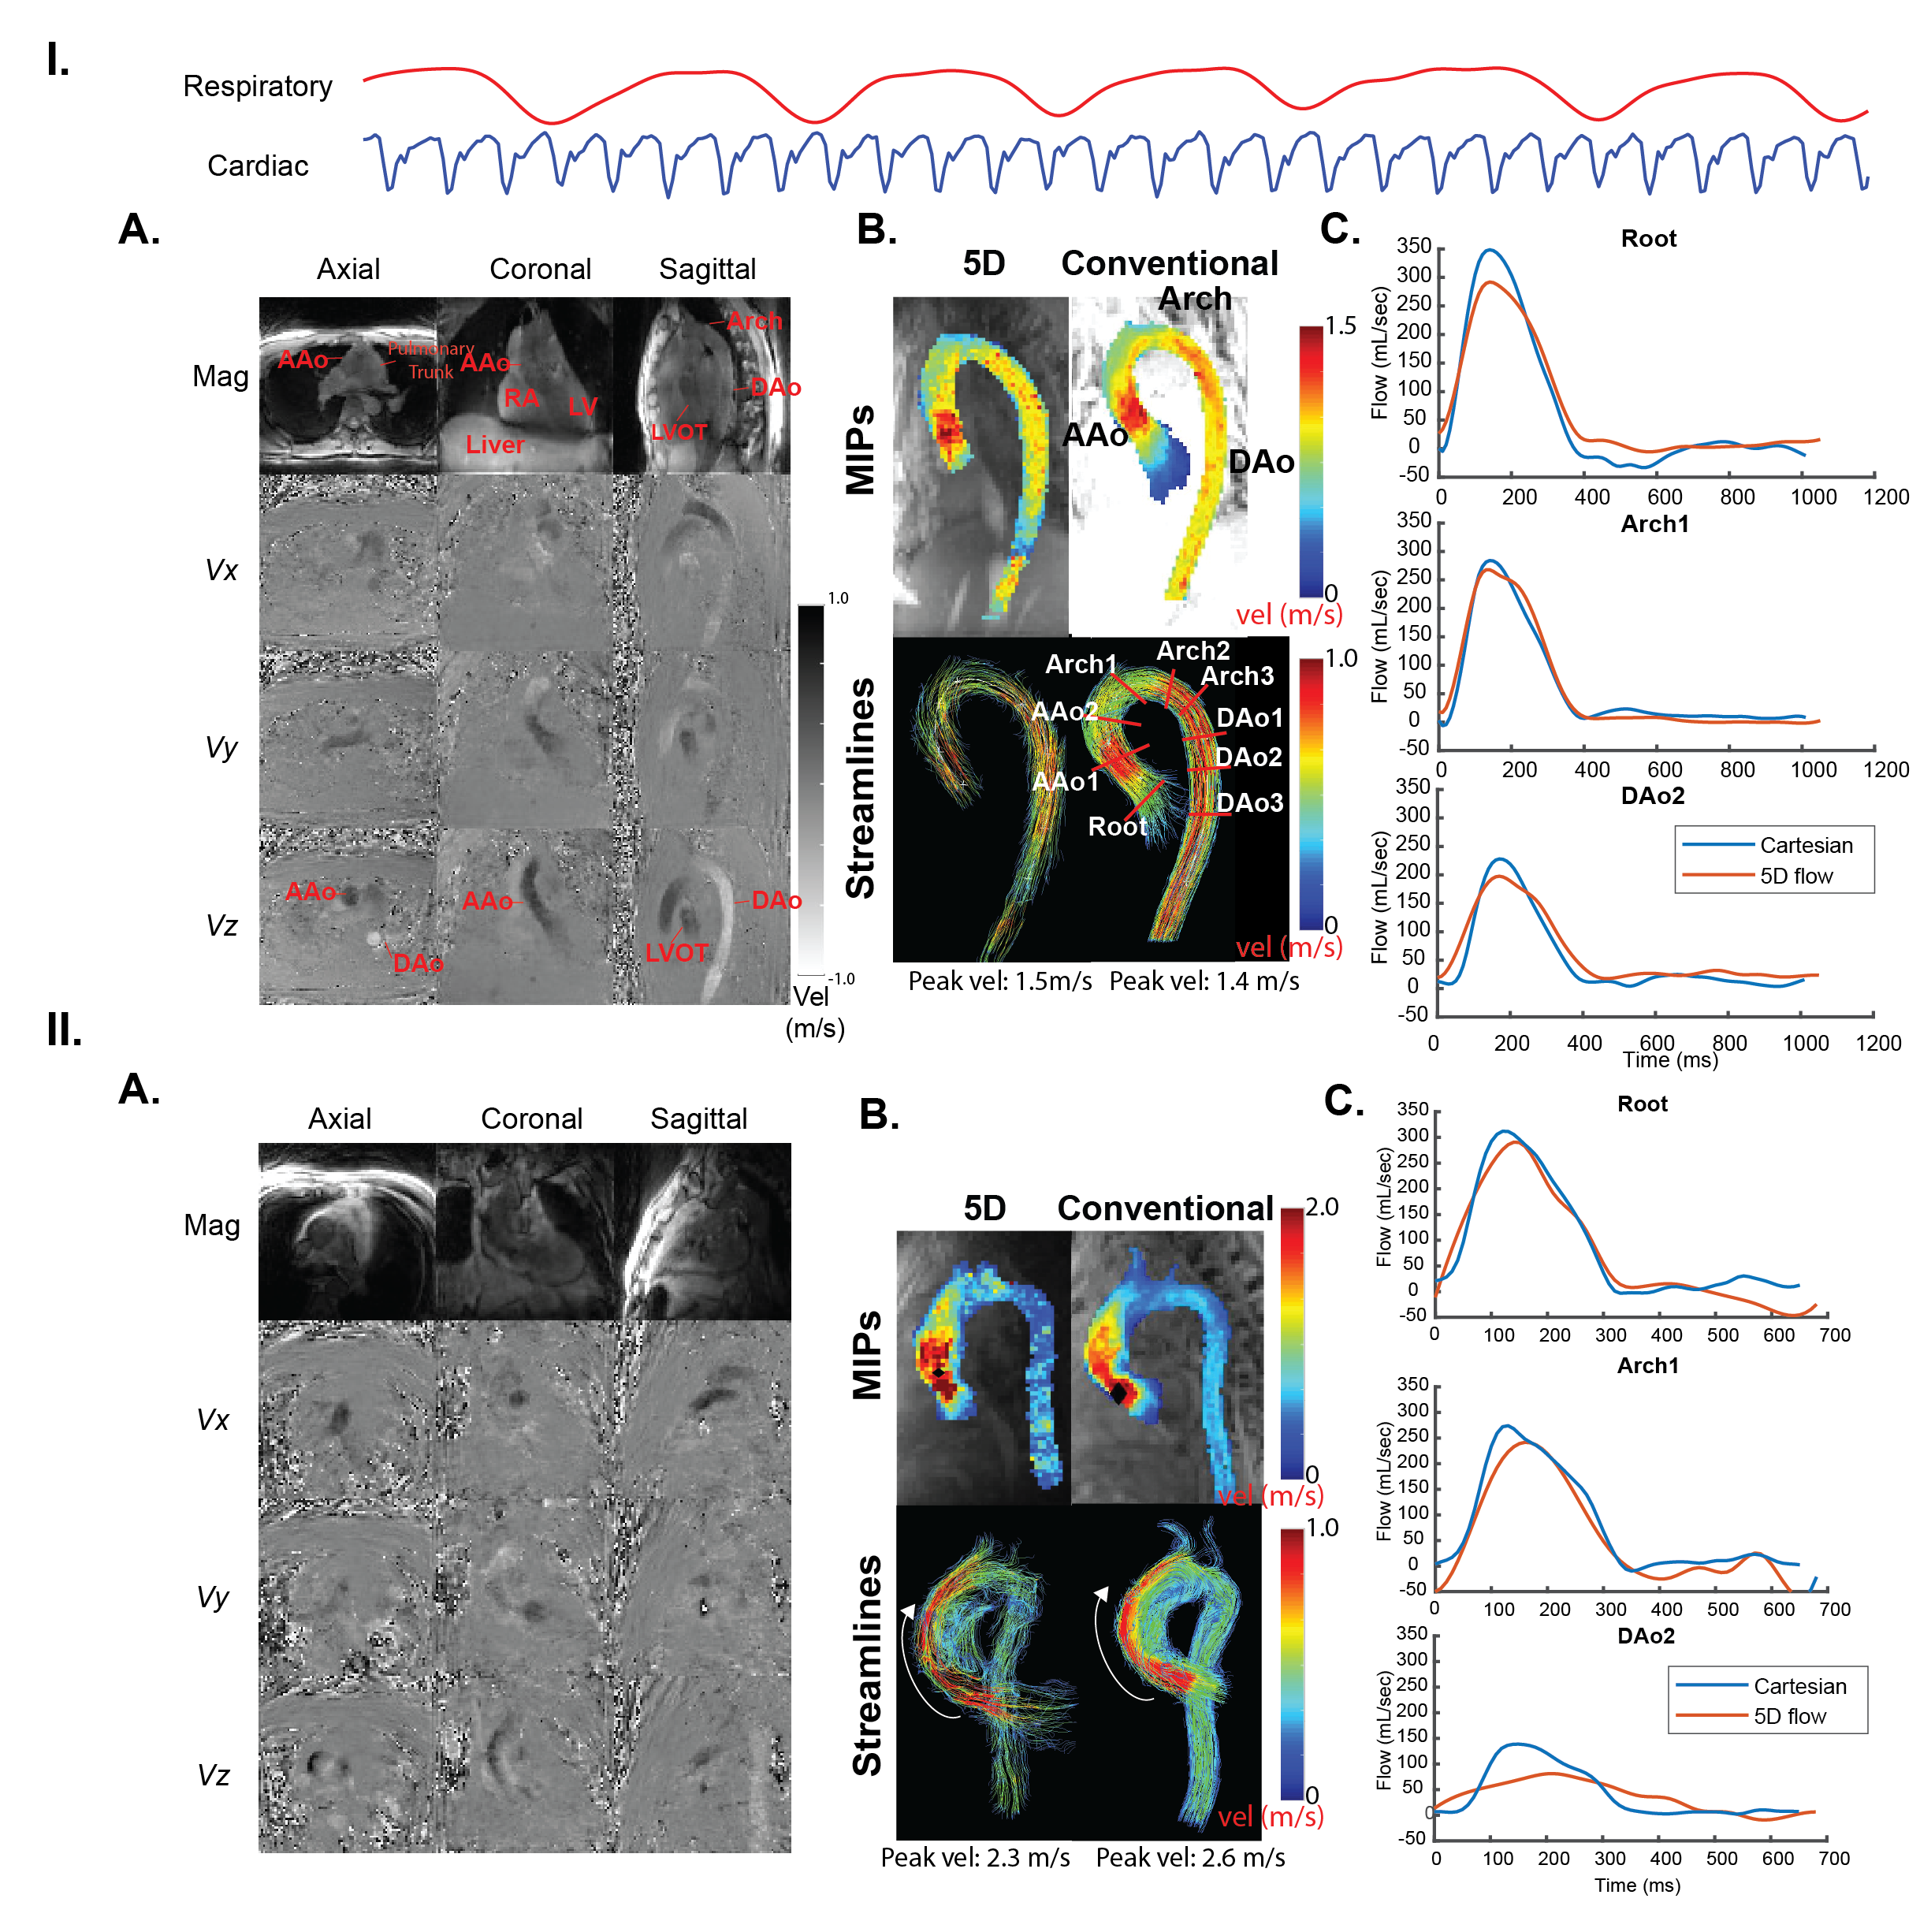
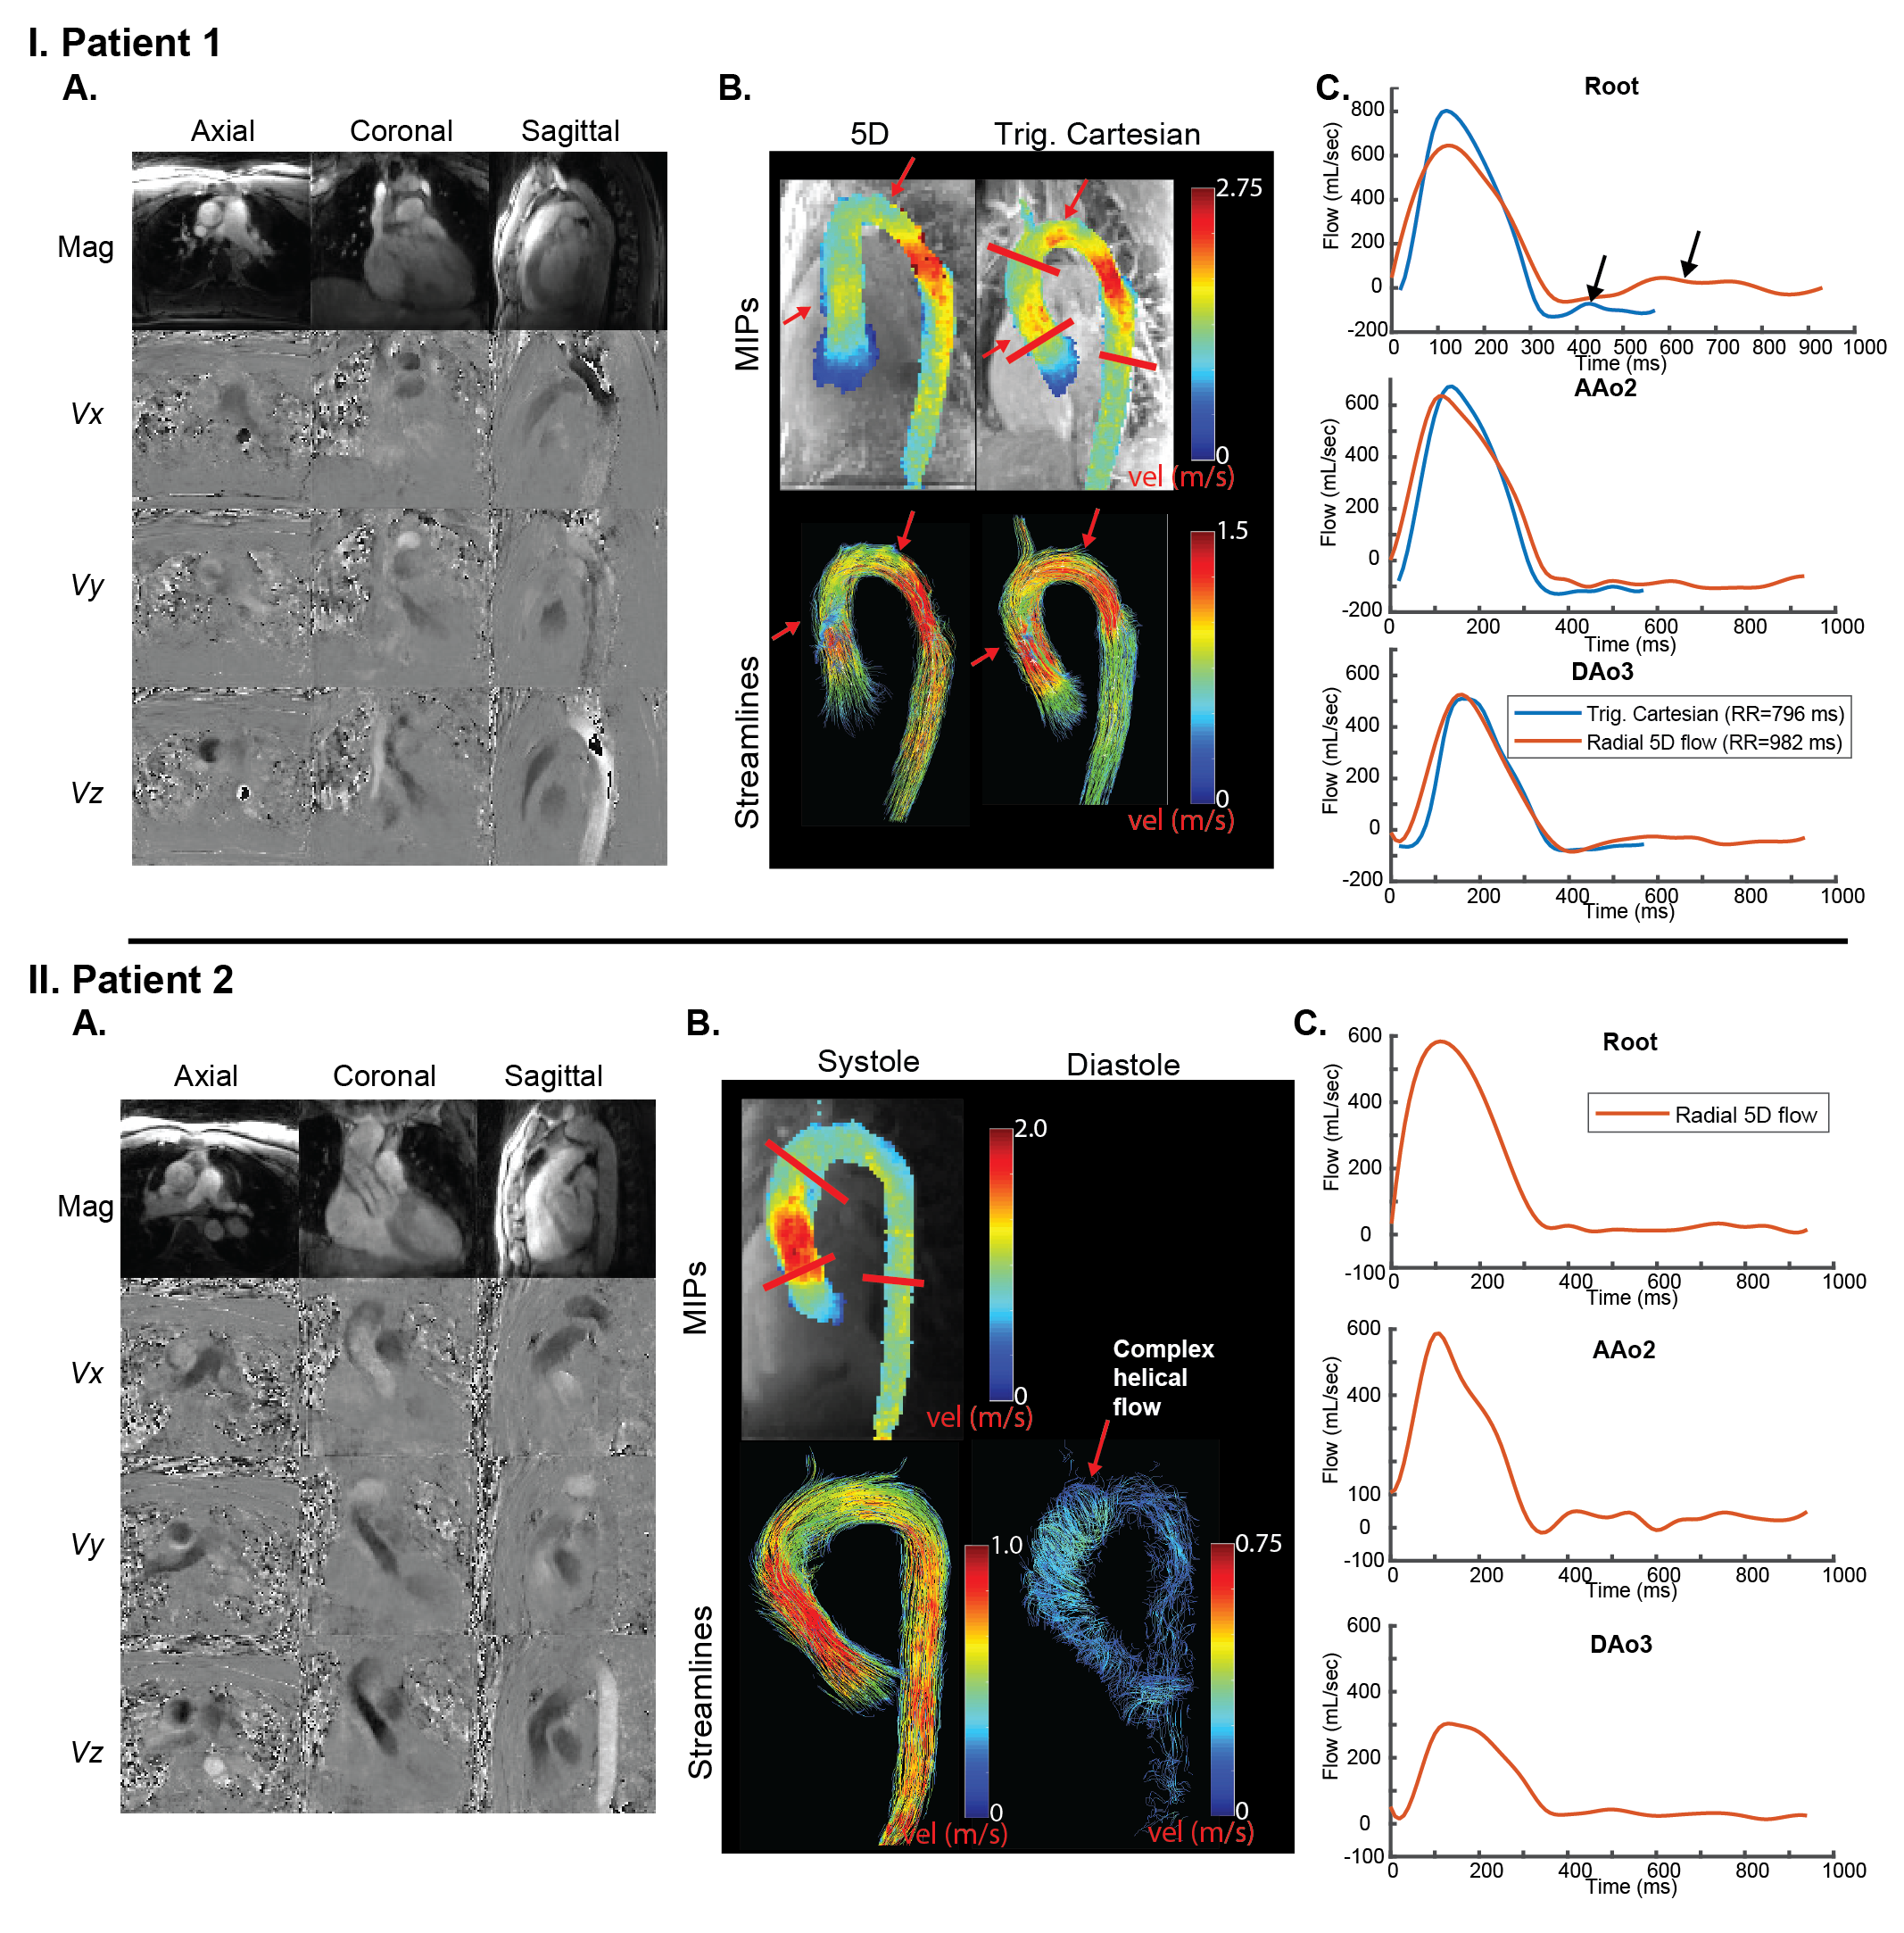
In-vivo: 5D flow imaging was performed in 3 healthy volunteers (2M/1F, age=30-75 years, Venc=150 cm/s, TE/TR/FA=3.13-3.41ms/4.9ms/5.4ms/7°, SR=2.3-2.75 mm3, BW=450-600 Hz/pixel, 95448-130320 radial views, temp. res=49.8-51.6 ms, non-contrast) and 2 patients (post Gd-contrast, Dotarem, 2M, age=30, 38 years, BW=600 Hz/pixel, 101040 radial views, FA=15°) with bicuspid aortic valve disease. Volunteers received an additional conventional cartesian 4D flow scan of the thoracic aorta with similar reconstructed SR (retrospective gating, Venc=150 cm/s, acquired SR=2.4-2.75x3.0-3.7x3.1-4.0 mm3, temp. res.=40.4-40.8 ms, BW=455 Hz/pixel). One patient had conventional 4D flow imaging (prospectively triggered, Venc=350 cm/s, temp res=36.8 ms) as standard-of-care 27 days prior to 5D flow imaging.
Results
In-vitro results show good-excellent visual depiction of hemodynamics (MIPS, streamlines, Fig. 2A). Time-resolved flow curves demonstrate improved agreement in CS reconstructed data versus NUFFT radial data (Fig. 2C) with conventional 4D flow, and excellent agreement of peak velocity values. Net flow values of 5D flow data were within 15% of conventional 4D flow values except in planes 4+6, which were among those further from isocenter.
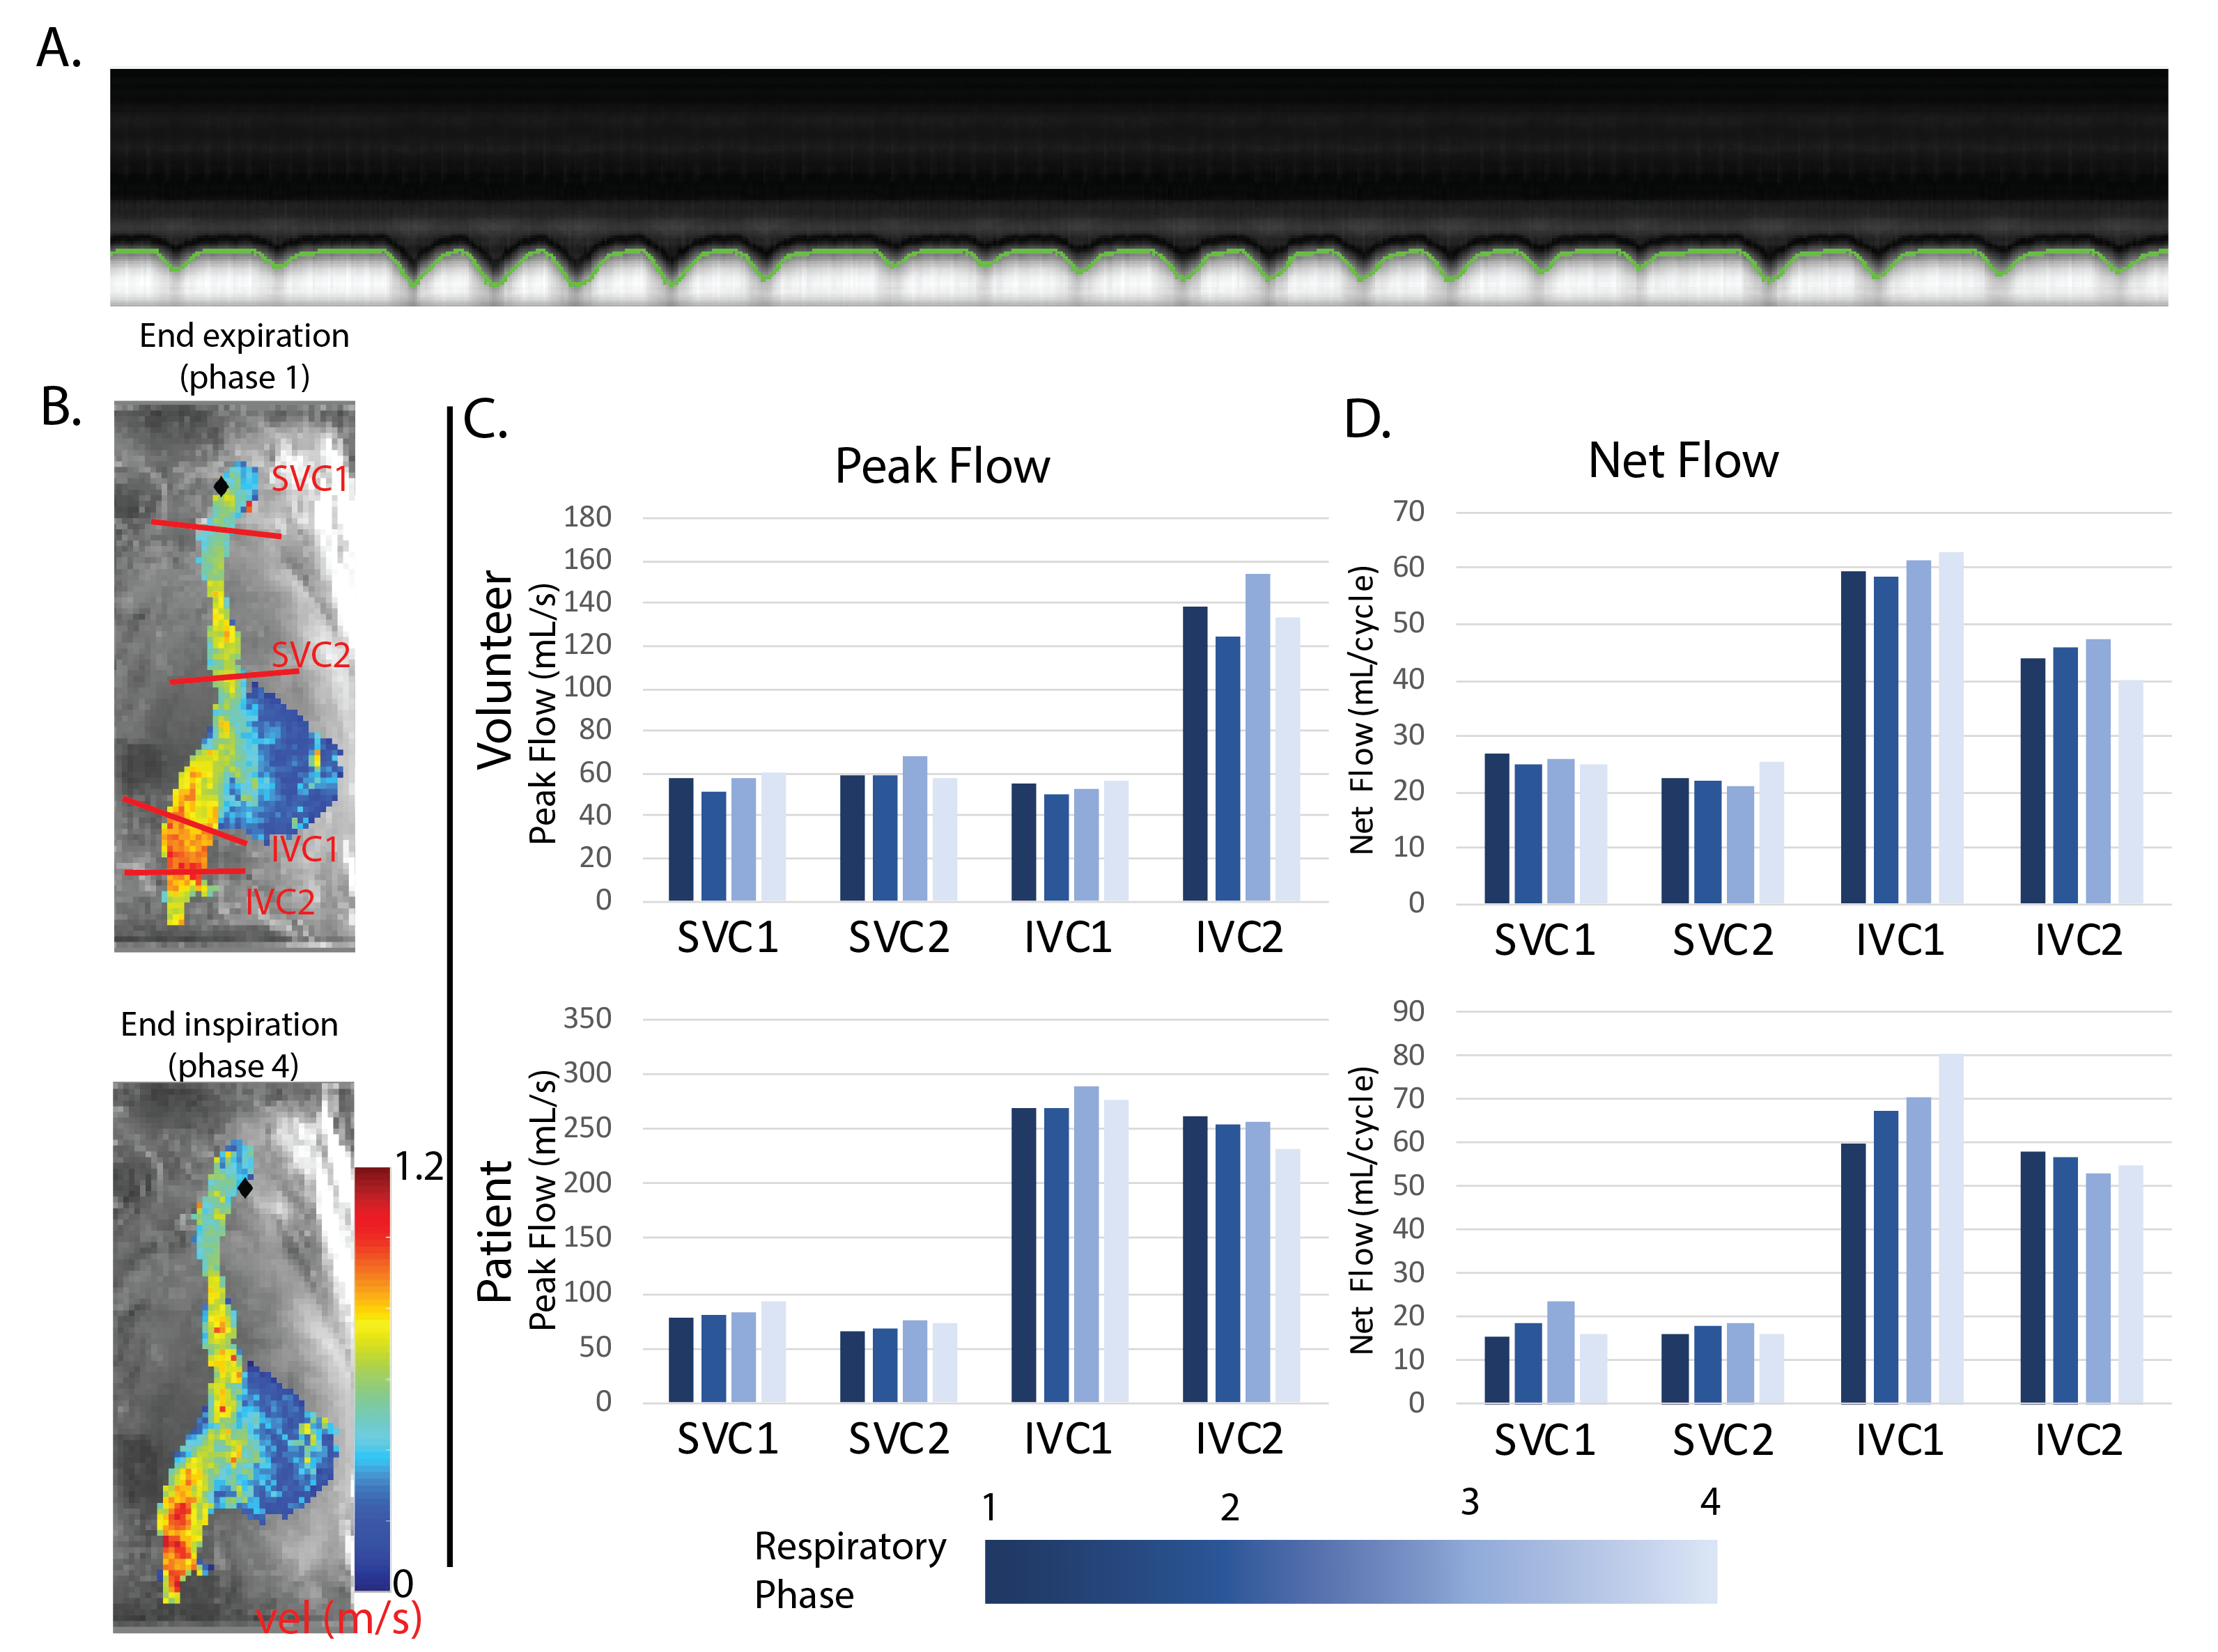
In-vivo: Cardiac and respiratory signals were successfully extracted for all volunteers and patients (Fig 3.I, top). 5D flow scan times for all subjects were 8-12 minutes (8:15, 11:27, or 8:17). Representative volunteer results with differing image quality are depicted in Figure 3. 5D flow tended to underestimate peak velocities and peak flows, but showed similar systolic hemodynamic patterns and time-resolved flow curve shapes. Contrast-enhanced patient data demonstrated improved streamline visualization compared to volunteers (Fig. 4). Respiratory-resolved (4 phases) evaluation of caval venous flow from 5D flow data established the potential of the technique to quantify respiration-driven changes in net and peak flow, especially in the inferior vena cava (Fig. 5).
Discussion and conclusions
The findings of this study show that 5D flow MRI is feasible in-vitro and in-vivo and can depict respiratory-resolved 3D hemodynamics within 8-12 minutes scan time. Underestimation in peak flows and velocities may be explained by temporal undersampling and regularization. Improved streamline collinearity in patients with Gd-contrast indicates a need for improved SNR in non-contrast acquisitions. Future investigations will include comparisons with contrast, acquisition and reconstruction protocol improvement, improved background phase correction, and higher field strengths. 5D flow imaging using a Free-running framework has the potential to expand the capabilities and simplify cardiac flow imaging, through the investigation of Fontan patients for respiratory-related hemodynamics, or even through improved arrhythmia rejection methods and scan efficiencies.Acknowledgements
National Heart, Lung and Blood Institute of the NIH under award F30HL137279References
1. Wei Z, Whitehead KK, Khiabani RH, et al. Respiratory effects on Fontan circulation during rest and exercise using real-time cardiac magnetic resonance imaging. The Annals of thoracic surgery. 2016;101(5):1818-1825.
2.Wexler L, Bergel D, Gabe I, Makin G, Mills C. Velocity of blood flow in normal human venae cavae. Investigative Radiology. 1969;4(3):204-205.
3. Coppo S, Piccini D, Bonanno G, et al. Free‐running 4D whole‐heart self‐navigated golden angle MRI: initial results. Magnetic resonance in medicine. 2015;74(5):1306-1316.
4. Feng L, Coppo S, Piccini D, et al. 5D whole‐heart sparse MRI. Magnetic resonance in medicine. 2018;79(2):826-838.
5. Di Sopra LP, Davide; Coppo, Simone; Bastiaansen, Jessica; Stuber, Matthias; Yerly, Jérôme Motion-Resolved 5D Imaging of the Heart: Time to Get Rid of the ECG. Presented in the Proceedings of the International Society for Magnetic Resonance in Medicine 2017; Honolulu, Hawaii
6. Piccini D, Littmann A, Nielles‐Vallespin S, Zenge MO. Spiral phyllotaxis: the natural way to construct a 3D radial trajectory in MRI. Magnetic resonance in medicine. 2011;66(4):1049-1056.
Figures