0089
5D Flow Tensor MRI for Mapping Reynolds Stresses in the Aorta1Institute for Biomedical Engineering, University and ETH Zurich, Zurich, Switzerland
Synopsis
We present a 5D Flow MRI approach for mapping the Reynolds stress tensor in the in-vivo aorta within 6 minutes. First and second statistical moments of fluctuating velocities are encoded using six different velocity encoding gradient directions embedded in a Cartesian Golden angle undersampling scheme with data-driven motion detection and locally low-rank imaging reconstruction. It is demonstrated that this approach permits a time-efficient assessment of velocity vector fields, turbulent kinetic energy and Reynolds shear stresses of the aorta in-vivo.
Introduction
Quantification of mean and fluctuating velocity components of transient and turbulent flows promises a comprehensive characterization of valvular and aortic flows including calculation of net pressure gradients and pressure recovery across and downstream of stenoses1–4. Moreover, the identification of abnormal shear stresses may help identifying the risk of potential damage of formed elements in blood5,6. Here, we present a framework for the in-vivo assessment of mean velocities and the Reynolds stress tensor (RST) by combining the Normal+Bisecting (N+B) encoding scheme5,7 with multi-point encoding8 and respiratory motion resolved 4D flow MRI 9 (5D Flow MRI). It is demonstrated that this approach permits the assessment of velocity vector fields, turbulent kinetic energy and Reynolds shear stresses of the aorta in-vivo in 6 minutes.Theory
Turbulent flow encoding In general flow velocities may be decomposed into a mean value $$$\bar{v}$$$ and a fluctuating component $$$v^{'}$$$10:
$$v = \overline{v} + v^{'}.$$
Assuming a Gaussian intra-voxel velocity distribution of variance $$$\sigma^2$$$, the MR signal model reads10
$$S(k_v)=S_0 e^{\frac{-\sigma^2 {k_v}^2}{2}}e^{-ik_v \overline{v}}$$
where $$$k_v=\gamma \int_0^TtG(t)dt$$$ denotes the first gradient moment of a bipolar velocity encoding gradient and $$$T$$$ the time of application of gradient $$$G$$$ . The statistical description of velocity fluctuations $$$v^{'}$$$ includes variances and covariances as described by the Reynolds stress tensor (RST)
$$R=\rho \begin{bmatrix}\overline{v_{x}^{'}v_{x}^{'}}&\overline{v_{x}^{'}v_{y}^{'}}&\overline{v_{x}^{'}v_{z}^{'}}\\ \overline{v_{x}^{'}v_{y}^{'}}&\overline{v_{y}^{'}v_{y}^{'}}&\overline{v_{y}^{'}v_{z}^{'}}\\\overline{v_{x}^{'}v_{z}^{'}}&\overline{v_{y}^{'}v_{z}^{'}}&\overline{v_{z}^{'}v_{z}^{'}}\end{bmatrix}$$ with standard deviations $$$\overline{v_{i}^{'}v_{i}^{'}}$$$, covariances $$$\overline{v_{i}^{'}v_{j}^{'}}$$$ and fluid density $$$\rho$$$. The magnitude of the measured signal can be written as5
$$|S(\bf{k}_v)|=|S_0|e^{\frac{-1}{2\rho}\bf{k}_v^TR\bf{k}_v}$$
with $$$\bf{k}_v=\begin{bmatrix}k_{vx}&k_{vy}&k_{vz}\end{bmatrix}^T$$$.
For six measurements along six different velocity encodings and by denoting the intra-voxel standard deviations (IVSD) $$$\sigma_{k_v,i}^2=\frac{2}{|\bf{k}_v|^2} ln \frac{|S(\bf{k_v}=\bf{0})|} {|S(\bf{k}_{v,i})|}$$$, the following encoding equation is obtained:
$$\begin{bmatrix}\sigma_{\bf{k}_{v,1}}^2\\...\\\sigma_{\bf{k}_{v,6}}^2\end{bmatrix}=\begin{bmatrix}\left(\begin{array}{c}{k_{vx,1}}^2&{{k}_{vy,1}}^2&{{k}_{vz,1}}^2&{2{k}_{vx,1}}{k}_{vy,1}&{2{k}_{vx,1}}{k}_{vz,1}&{2{k}_{vy,1}}{k}_{vz,1}&\end{array}\right)/ \left |\bf{k_{v,1}} \right| \\...\\\left(\begin{array}{c}{{k}_{vx,6}}^2&{{k}_{vy,6}}^2&{{k}_{vz,6}}^2&{2{k}_{vx,6}}{k}_{vy,6}&{2{k}_{vx,6}}{k}_{vz,6}&{2{k}_{vy,6}}{k}_{vz,6}&\end{array}\right)/ \left|\bf{k_{v,6}} \right|\end{bmatrix}\begin{bmatrix}\overline{v_{x}^{'}v_{x}^{'}}\\\overline{v_{y}^{'}v_{y}^{'}}\\\overline{v_{z}^{'}v_{z}^{'}}\\\overline{v_{x}^{'}v_{y}^{'}}\\\overline{v_{x}^{'}v_{z}^{'}}\\\overline{v_{y}^{'}v_{z}^{'}}\end{bmatrix}=H\begin{bmatrix}\overline{v_{x}^{'}v_{x}^{'}}\\\overline{v_{y}^{'}v_{y}^{'}}\\\overline{v_{z}^{'}v_{z}^{'}}\\\overline{v_{x}^{'}v_{y}^{'}}\\\overline{v_{x}^{'}v_{z}^{'}}\\\overline{v_{y}^{'}v_{z}^{'}}\end{bmatrix}.$$
Accordingly, the elements of the RST can be calculated voxel-wise using the pseudoinverse:
$$\begin{bmatrix} \overline{v_{x}^{'}v_{x}^{'}}\\
\overline{v_{y}^{'}v_{y}^{'}}\\\overline{v_{z}^{'}v_{z}^{'}}\\\overline{v_{x}^{'}v_{y}^{'}}\\\overline{v_{x}^{'}v_{z}^{'}}\\\overline{v_{y}^{'}v_{z}^{'}}\end{bmatrix} = (H^T H)^{-1} H \begin{bmatrix}\sigma_{\bf{k}_{v,1}}^2 \\ ... \\ \sigma_{\bf{k}_{v,6}}^2 \end{bmatrix}.$$
Methods
Experiments
In a first sub-study, the range of IVSD in the aorta during systole was retrospectively analyzed in datasets previously obtained in 9 healthy volunteers and 28 patients with aortic valve stenosis1.
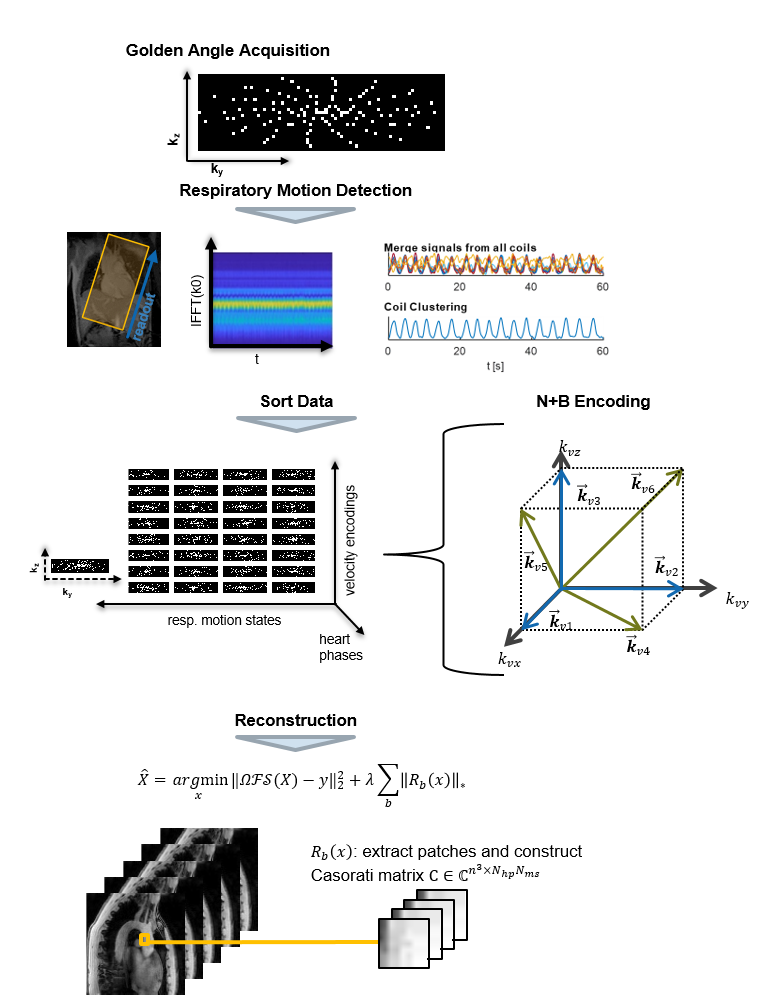
Thereafter, prospective data were collected using a Cartesian Golden angle undersampling scheme11,12 with data-driven motion detection and locally low-rank image reconstruction in healthy subjects as illustrated in Figure 1. Scan parameters were: spatial resolution 2.5x2.5x2.5 mm3, 25 cardiac phases and scan duration of 6 minutes. During image reconstruction, data were sorted into four discrete respiratory motion bins and respiratory motion resolved datasets were reconstructed with BART13 enforcing a locally low rank model14,15 along cardiac phases and respiratory motion states. Velocities were encoded with the Normal+Bisecting (N+B) encoding scheme7 as illustrated in Figure 1 using encoding velocities of 80 cm/s.
Data analysis
Turbulent Kinetic Energy (TKE) was calculated from the main diagonal of the RST as
$$ TKE=\frac{\rho}{2}(\overline{v_{x}^{'}v_{x}^{'}}+\overline{v_{y}^{'}v_{y}^{'}}+\overline{v_{z}^{'}v_{z}^{'}}).$$
Principal stress analysis was performed and the maximum shear stress was calculated from the eigenvalues $$$\delta_1>\delta_2>\delta_3$$$ of the RST as
$$\tau_{max}=0.5(\delta_1-\delta_3)$$ assuming a density of blood of $$$\rho=1060kg/m^3$$$.
Results
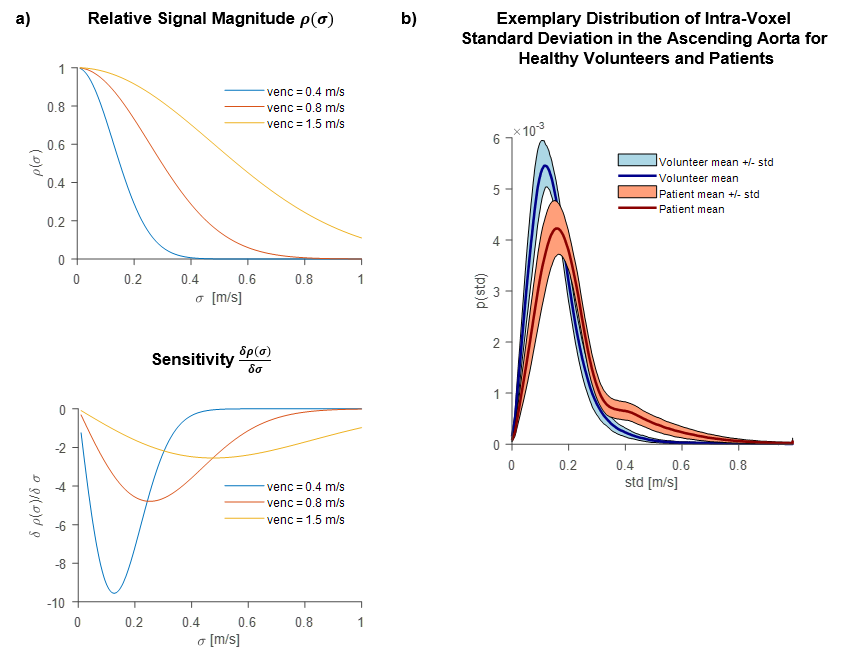
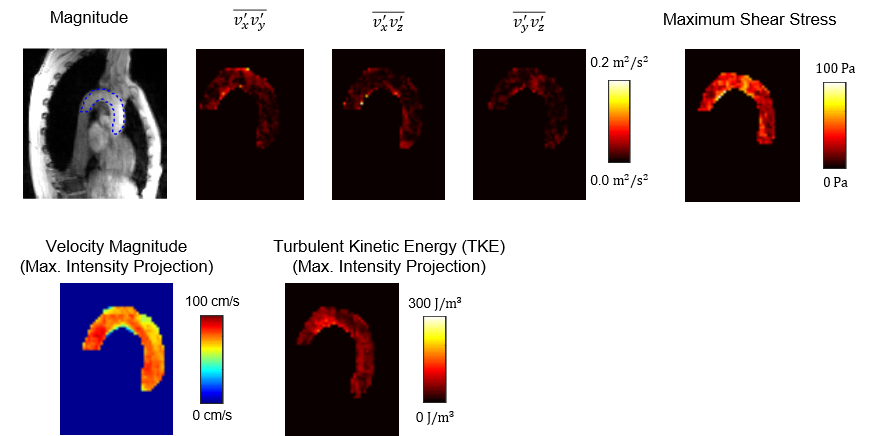
Figure 2 shows the distribution of IVSD in the ascending aorta. For healthy subjects a range between 0 m/s and 0.4 m/s is observed whereas for patients with aortic valve stenosis IVSD ranges between 0 and 0.8 m/s. In Figure 3 maps of off-diagonal elements of the RST, as well as a maximum intensity projection of TKE and maximum shear stress are shown. TKE ranges up to 300 J/m3 in the healthy subject. Maximum shear stresses range from 50 Pa to 100 Pa.Discussion
A 5D Flow MRI approach for mapping the Reynolds stress tensor in the in-vivo aorta within 6 minutes has successfully been implemented and its in-vivo feasibility demonstrated. A particular problem in encoding turbulence is the non-linear dependency between the IVSD and the signal magnitude in Equation 1 as illustrated in Figure 2. The distribution of IVSD in the ascending aorta in healthy subjects shows that the range of IVSD cannot be fully covered with a single value velocity encoding. Accordingly, a single encoding velocity of 80 cm/s is regarded a compromise. However, in patients with aortic stenosis a larger range of IVSD was observed. To this end, the framework requires additional multi-point encoding5,8 at the expense of scan time. Extending from the current 7-point encoding scheme to 13-point encoding implies scan times of 11 instead of 6 minutes which are still considered acceptable relative to current scan time constraints.Conclusion
5D Flow Tensor MRI allows time-efficient mapping of Reynolds stresses in the in-vivo aorta in clinically acceptable scan times.Acknowledgements
No acknowledgement found.References
1. Binter C, Gotschy A, Sündermann SH, Frank M, Tanner FC, Lüscher TF, Manka R, Kozerke S. Turbulent Kinetic Energy Assessed by Multipoint 4-Dimensional Flow Magnetic Resonance Imaging Provides Additional Information Relative to Echocardiography for the Determination of Aortic Stenosis Severity. Circulation: Cardiovascular Imaging. 2017;10(6):1–8.
2. Haraldsson H, Kefayati S, Ahn S, Dyverfeldt P, Lantz J, Karlsson M, Laub G, Ebbers T, Saloner D. Assessment of Reynolds stress components and turbulent pressure loss using 4D flow MRI with extended motion encoding. Magnetic Resonance in Medicine. 2018;79(4):1962–1971.
3. Casas B, Lantz J, Dyverfeldt P, Ebbers T. 4D Flow MRI-Based Pressure Loss Estimation in Stenotic Flows : Evaluation Using Numerical Simulations. 2016;1821:1808–1821.
4. Ha H, Kvitting JPE, Dyverfeldt P, Ebbers T. Validation of pressure drop assessment using 4D flow MRI-based turbulence production in various shapes of aortic stenoses. Magnetic Resonance in Medicine. 2018;(February):1–14.
5. Binter C, Knobloch V, Sigfridsson A, Kozerke S. Direct quantification of turbulent shear stresses by multi-point phase-contrast MRI. Proceedings of the 20th Annual Meeting of ISMRM, Melbourne, Australia.
6. Ha H, Kvitting J-PE, Dyverfeldt P, Ebbers T. 4D Flow MRI quantification of blood flow patterns, turbulence and pressure drop in normal and stenotic prosthetic heart valves. Magnetic Resonance Imaging. 2019;55(July 2018):118–127.
7. Elkins CJ, Alley MT, Saetran L, Eaton JK. Three-dimensional magnetic resonance velocimetry measurements of turbulence quantities in complex flow. Experiments in Fluids. 2009;46(2):285–296.
8. Binter C, Knobloch V, Manka R, Sigfridsson A, Kozerke S. Bayesian multipoint velocity encoding for concurrent flow and turbulence mapping. Magnetic Resonance in Medicine. 2013;69(5):1337–1345.
9. Jonas Walheim and Sebastian Kozerke. 5D Flow MRI – Respiratory Motion Resolved Accelerated 4D Flow Imaging Using Low-Rank + Sparse Reconstruction. In: Proceedings of the 26th Annual Meeting of ISMRM. Presented at the ISMRM. 2018. p. 0032.
10. Dyverfeldt P, Sigfridsson A, Kvitting JPE, Ebbers T. Quantification of intravoxel velocity standard deviation and turbulence intensity by generalizing phase-contrast MRI. Magnetic Resonance in Medicine. 2006;56(4):850–858.
11. Wundrak S, Paul J, Ulrici J, Hell E, Rasche V. A small surrogate for the golden angle in time-resolved radial MRI based on generalized fibonacci sequences. IEEE Transactions on Medical Imaging. 2015;34(6):1262–1269.
12. Cheng JY, Hanneman K, Zhang T, Alley MT, Lai P, Tamir JI, Uecker M, Pauly JM, Lustig M, Vasanawala SS. Comprehensive motion-compensated highly accelerated 4D flow MRI with ferumoxytol enhancement for pediatric congenital heart disease. Journal of Magnetic Resonance Imaging. 2016;43(6):1355–1368.
13. Tamir JI, Ong F, Cheng JY, Uecker M, Lustig M. Generalized Magnetic Resonance Image Reconstruction using The Berkeley Advanced Reconstruction Toolbox. Proceedings of the ISMRM 2016 Data Sampling and Image Reconstruction Workshop. 2016;2486:9660006.
14. Zhang T, Pauly JM, Levesque IR. Accelerating parameter mapping with a locally low rank constraint. Magnetic Resonance in Medicine. 2015;73(2):655–661.
15. Trzasko J, Manduca A, Borisch E. Local versus global low-rank promotion in dynamic MRI series reconstruction. In: Proc. Int. Symp. Magn. Reson. Med. 2011. p. 4371.
Figures