0088
Machine learning for automatic three-dimensional segmentation of the aorta in 4D flow MRI1Department of Radiology, University Medical Center Utrecht, Utrecht, Netherlands, 2Department of Cardiothoracic Surgery, Amsterdam University Medical Centers, AMC, Amsterdam, Netherlands, 3Department of Radiology & Nuclear Medicine, Amsterdam University Medical Centers, AMC, Amsterdam, Netherlands
Synopsis
In this study we present a machine learning convolutional neural network (CNN) for automatic segmentation of the aorta used for peak systolic wall shear stress (WSS) assessment from 4D flow MRI data. The automated three-dimensional WSS profiles (WSSMACHINE) were compared with WSS calculated using manually (WSSMAN) created segmentations. Bland-Altman and orthogonal regression analysis revealed good agreement between WSSMAN and WSSMACHINE in terms of small mean differences and slopes and intercepts close to unity and zero respectively. The CNN has the ability to drastically accelerate aortic segmentation from 4D flow MRI data, which will greatly improve the clinical applicability of WSS.
Introduction
Peak systolic wall shear stress (WSS) is a clinically relevant biomarker for extracellular matrix dysregulation and elastic fiber degeneration of the ascending aortic wall in congenital heart disease [1]. The three-dimensional (3D) quantification of WSS from 4D flow MRI demands a precise segmentation of the aortic lumen for definition of the aortic wall [2]. However, manual segmentation is time-consuming, laborious and inhibits clinical use of WSS and automated methods for delineation of the aortic lumen are lacking. In this study we developed an automatic machine learning approach for lumen segmentation. We hypothesize that WSS estimated with automated aortic segmentations is comparable with WSS estimated using manual segmentations.Methods
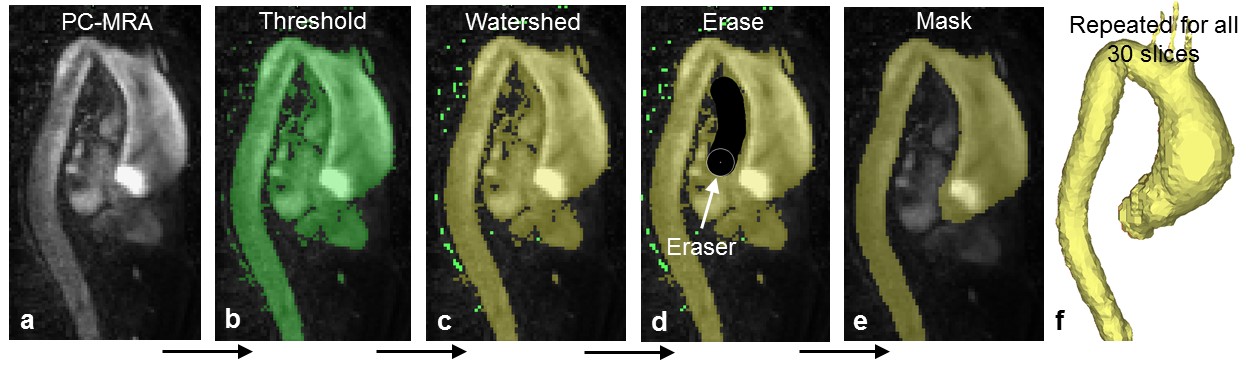
4D flow MRI datasets were acquired on a 3T MRI Ingenia system (Philips, Best, the Netherlands) in 25 healthy volunteers and 42 patients with bicuspid aortic valves (BAV, of which 22 patients with repaired coarctation). Spatial resolution was 2.5 x 2.5 x 2.5 mm3, temporal resolution: 24 timeframes (±42 ms depending on heart rate), TE / TR / FA: 2.1 ms / 3.4 ms / 8°, k-t Principal Component Analysis acceleration R = 8 [3]. Phase contrast MR angiography (PC-MRA) images were created by multiplying velocity magnitude with the phase contrast magnitude images followed by voxel-wise averaging over all timeframes. Commercial software (Mimics, Materialise, Leuven) was used to segment the aortic lumen semi-automatically from the PC-MRA images using thresholding, watershed and manual drawing/erasing algorithms [4] (figure 1).
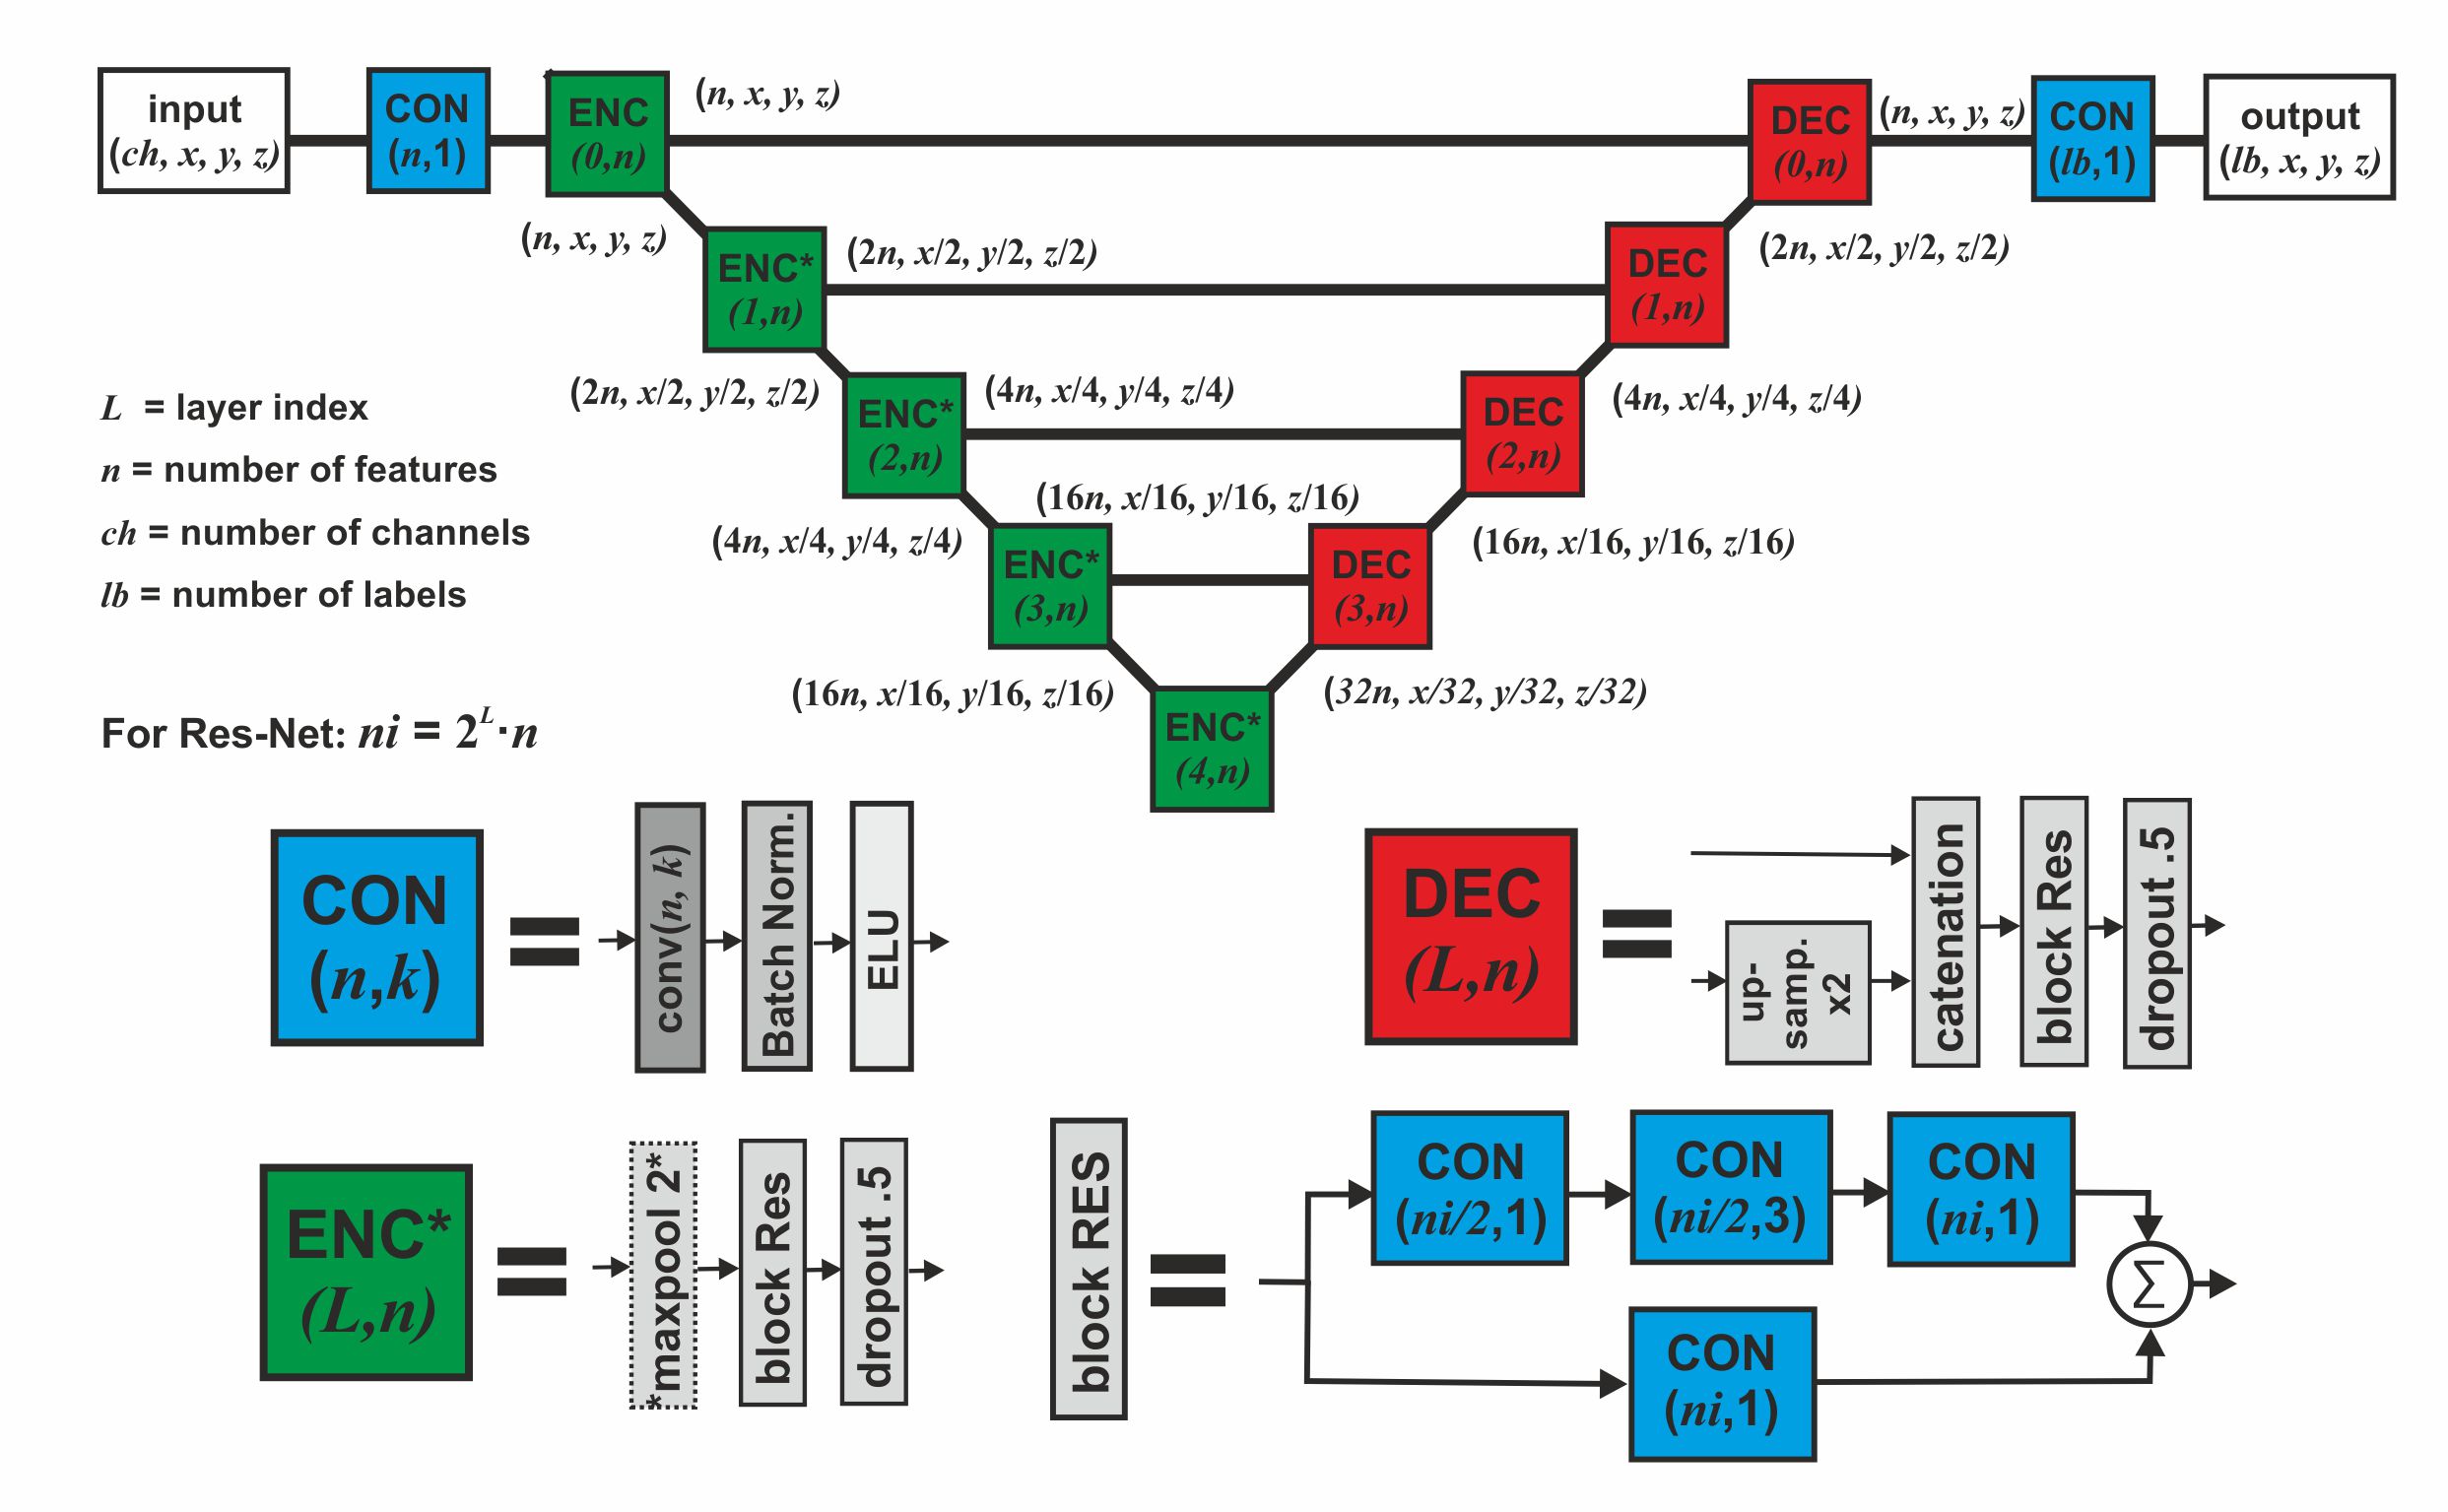
Training of the convolutional neural network (CNN) was performed using n=47 datasets (70% of all datasets, 18 controls, 29 patients) and validated with n=13 (20%, 5 controls, 8 patients) datasets. Performance of the CNN was tested with on n=7 (10%, 2 controls, 5 patients) test datasets. As input for the CNN, time-averaged phase contrast magnitude, time-averaged velocity magnitude and the PC-MRA images were used, in addition to the manually created masks. A hybrid 3D-UNet/RESNET CNN [5] (figure 2) was developed in Mathematica (github.com/mfroeling/UNET) and used for training with 32 features in the first layer and 1024 in the deepest (38 convoluting layers with 3.8 million parameters in total). Cross-entropy and soft-dice were used as loss functions. Training of the CNN was performed using 500 epochs using an ADAM optimizer (Nvidia TitanXP).
The peak systolic time frame was determined by selecting the timeframe with the highest spatially averaged velocity magnitude in the manual segmentation. Peak systolic 3D WSS was calculated using wall definition by 1) the manual segmentations (WSSMAN) and 2) the machine learning segmentations (WSSMACHINE) with a previously published algorithm [2]. WSSMACHINE was rigidly registered and interpolated to WSSMAN to enable voxel-by-voxel Bland-Altman and orthogonal regression analysis [4].
Results
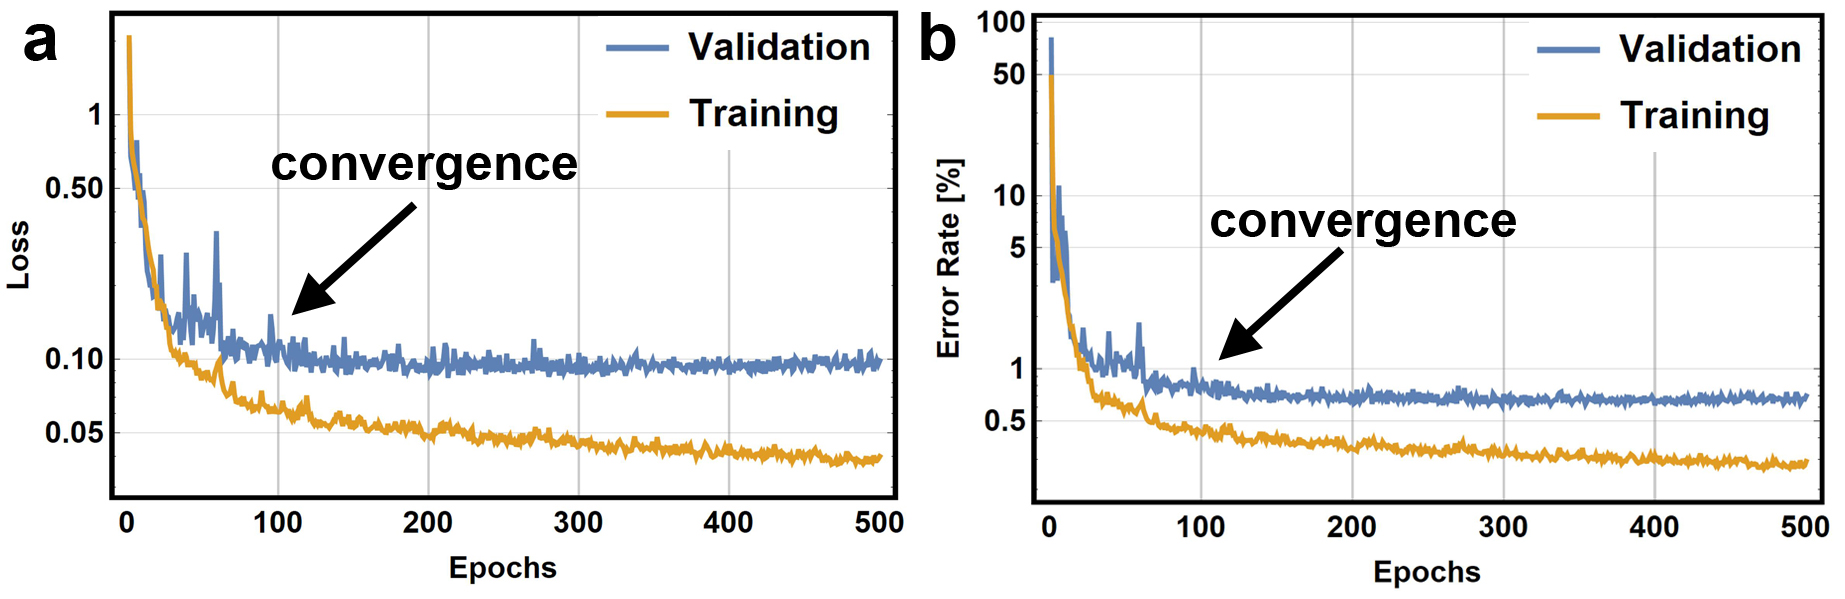
Training of the CNN took 2.1 hours for 500 epochs but the loss and error curves show that training converged after ±100 epochs (figure 3). Segmentation of the test datasets took 1 second per dataset, as compared to at least 10 minutes for manual segmentation.
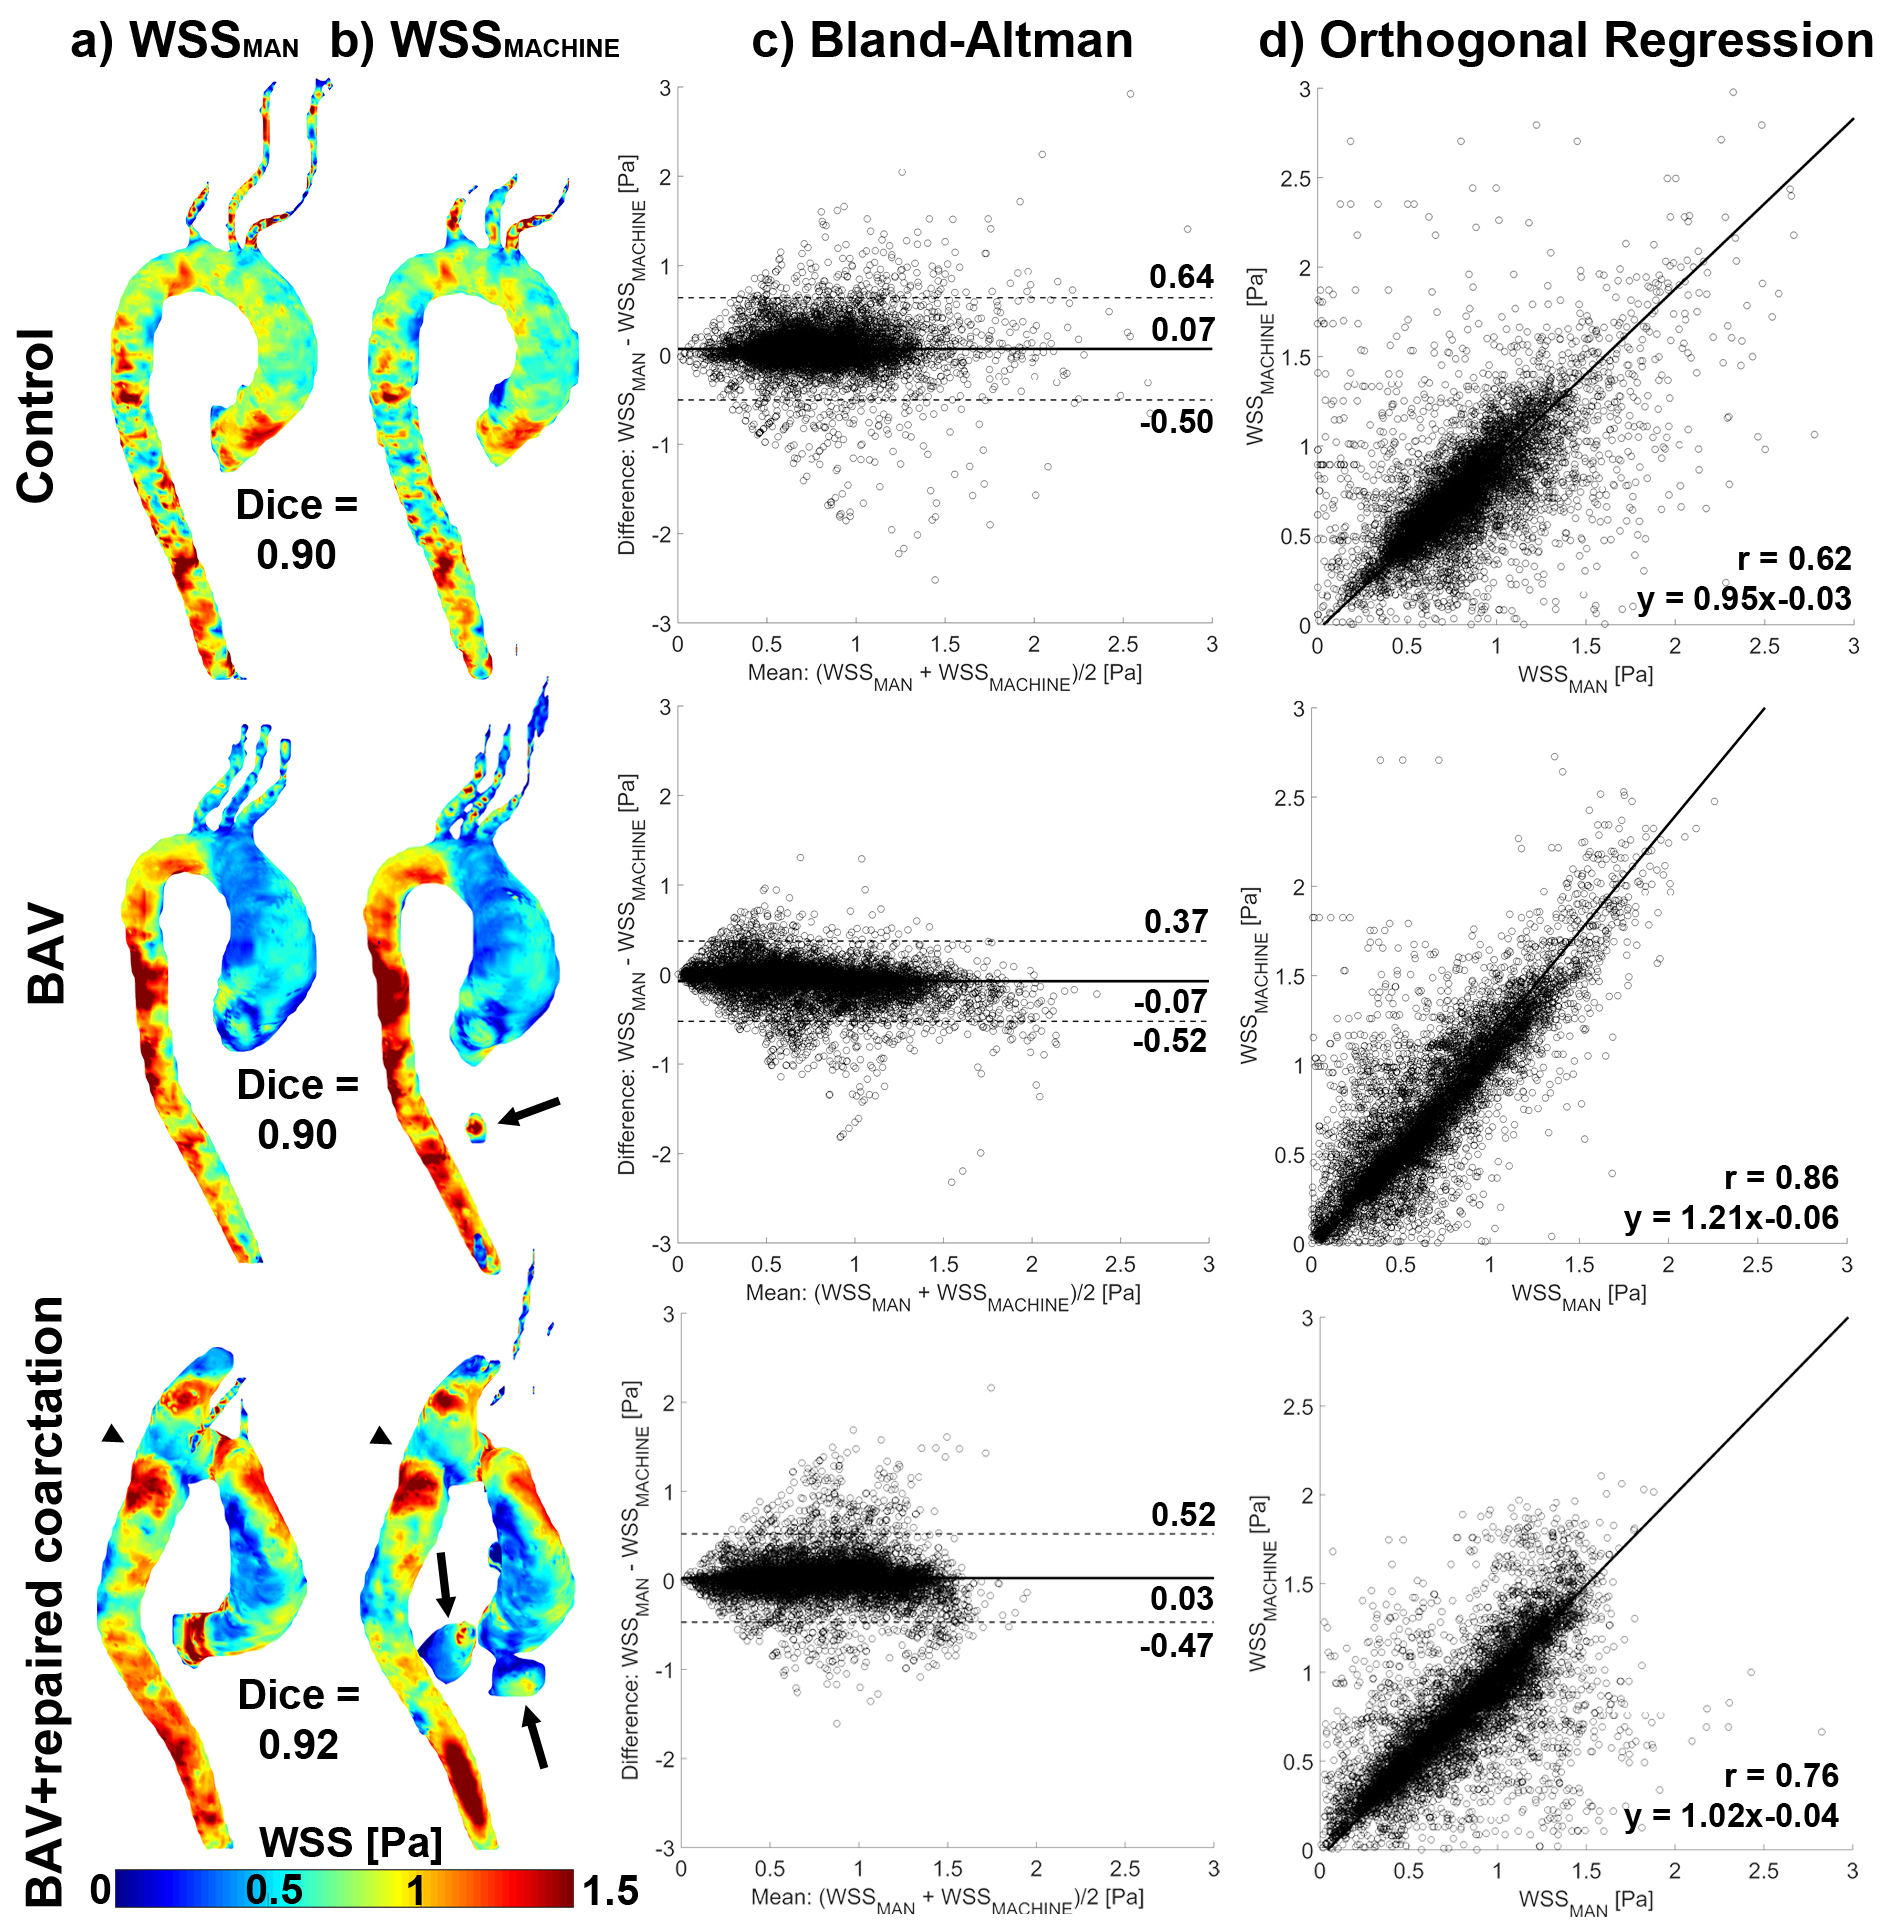
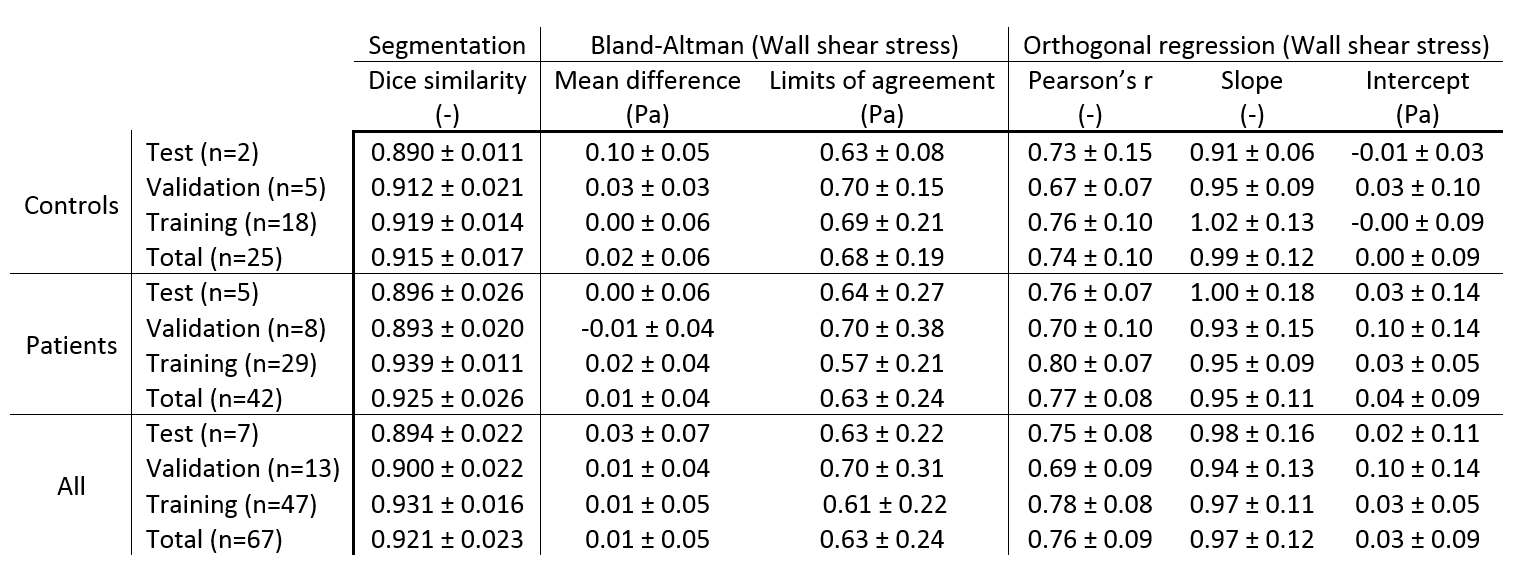
In figure 4 three test exemplary datasets of WSSMACHINE vs. WSSMAN are displayed with their corresponding Bland-Altman and orthogonal regression plots. Some segmentation errors made by the CNN can be seen for the BAV and BAV+repaired coarctation subjects. These errors and others, such as slightly smaller or larger diameters can lead to disagreement in local WSS values, as indicated by the limits of agreement (LOA) and Pearson r in table 1. Table 1 further displays the Dice-similarities, the mean differences and the slope and intercept for WSSMACHINE vs. WSSMAN. All Dice-similarities were close to 0.9, the mean differences and intercepts close to 0 and the slope close to unity.
Discussion
Quantitative analysis using Dice-similarity coefficients showed that the agreement between manual segmentations and segmentations created with the novel machine learning algorithm was higher than 90%. The agreement of the segmentations created with manual interaction and the CNN resulted in good agreement of 3D WSS. Qualitative analysis revealed that deviations were caused by small regions of incorrectly segmented voxels by the CNN. Inclusion of more data and further training of the network are warranted to improve the algorithm to increase segmentation accuracy further. Ultimately, the CNN can replace the time-consuming labor of manually segmenting the aorta for WSS calculations, thereby accelerating post-processing of 4D flow MRI data, which will greatly improve the applicability of WSS in a clinical setting.Conclusion
In this study we presented a machine learning network for automatic segmentation of the aorta to facilitate WSS estimations based on 4D flow MRI data. The three-dimensional WSS patterns were comparable with WSS estimated with manually created segmentations.Acknowledgements
No acknowledgement found.References
1. Guzzardi DG, Barker AJ, van Ooij P, Malaisrie SC, Puthumana JJ, Belke DD, Mewhort HEM, Svystonyuk DA, Kang S, Verma S, Collins J, Carr J, Bonow RO, Markl M, Thomas JD, Mccarthy PM, Fedak PWM (2015) Valve-Related Hemodynamics Mediate Human Bicuspid Aortopathy: Insights From Wall Shear Stress Mapping. J Am Coll Cardiol 66:892–900.
2. Potters W V, van Ooij P, Marquering HA, VanBavel E, Nederveen AJ (2015) Volumetric arterial wall shear stress calculation based on cine phase contrast MRI. J Magn Reson Imaging Feb; 41:505–516.
3. Giese D, Wong J, Greil GF, Buehrer M, Schaeffter T, Kozerke S (2014) Towards highly accelerated Cartesian time-resolved 3D flow cardiovascular magnetic resonance in the clinical setting. J Cardiovasc Magn Reson 16:42.
4. van Ooij P, Powell AL, Potters W V, Carr JC, Markl M, Barker AAJ (2016) Reproducibility and interobserver variability of systolic blood flow velocity and 3D wall shear stress derived from 4D flow MRI in the healthy aorta. J Magn Reson Imaging 43:236–48.
5. Ronneberger O, Fischer P, Brox T (2015) U-Net: Convolutional Networks for Biomedical Image Segmentation. In: Navab N, Hornegger J, Wells WM, Frangi AF (eds) Med. Image Comput. Comput. Interv. -- MICCAI 2015. Springer International Publishing, Cham, pp 234–241
Figures