0087
Stochastic Flow Co-expression Signatures: A novel concept for volumetric 4D flow assessment with application to aortic valve disease1Radiology, Northwestern University, Chicago, IL, United States, 2University of Colorado, Anschutz Medical Campus, Aurora, Colo., CO, United States, 3Cardiac Surgery, Northwestern University, Chicago, IL, United States, 4Mayo Clinic, Rochester, MN, United States, 5Cardiology, Northwestern University, Chicago, IL, United States
Synopsis
Studies have shown an impact of aortic valve disease, as
Purpose:
Studies have shown an impact of aortic valve disease, such as bicuspid aortic valve (BAV), on altered aortic blood flow. Nevertheless, regional and global aortic flow changes can be complex (including a mixture of flow jets, vortical, and helical patterns, etc.), for which a visual assessment is challenging and suffers limited reproducibility. Existing quantitative flow metrics (e.g., wall shear stress, vorticity, energy loss, etc.) are useful, but each reflects only partial components of the overall complex flow changes. Here we propose a novel concept that uniquely captures the signature of normal and altered volumetric aortic flow changes derived from 4D Flow MRI. This concept is based on deriving a signature of pairwise flow disparities throughout the aorta volume stochastically. We refer to such pairwise flow disparity as flow co-expression. The aims of this study were: (1) demonstrate the feasibility and reproducibility of the proposed signature in healthy controls. (2) evaluate its potential in identifying distinct 4D flow co-expression signatures in BAV patients compared to controls.Methods:
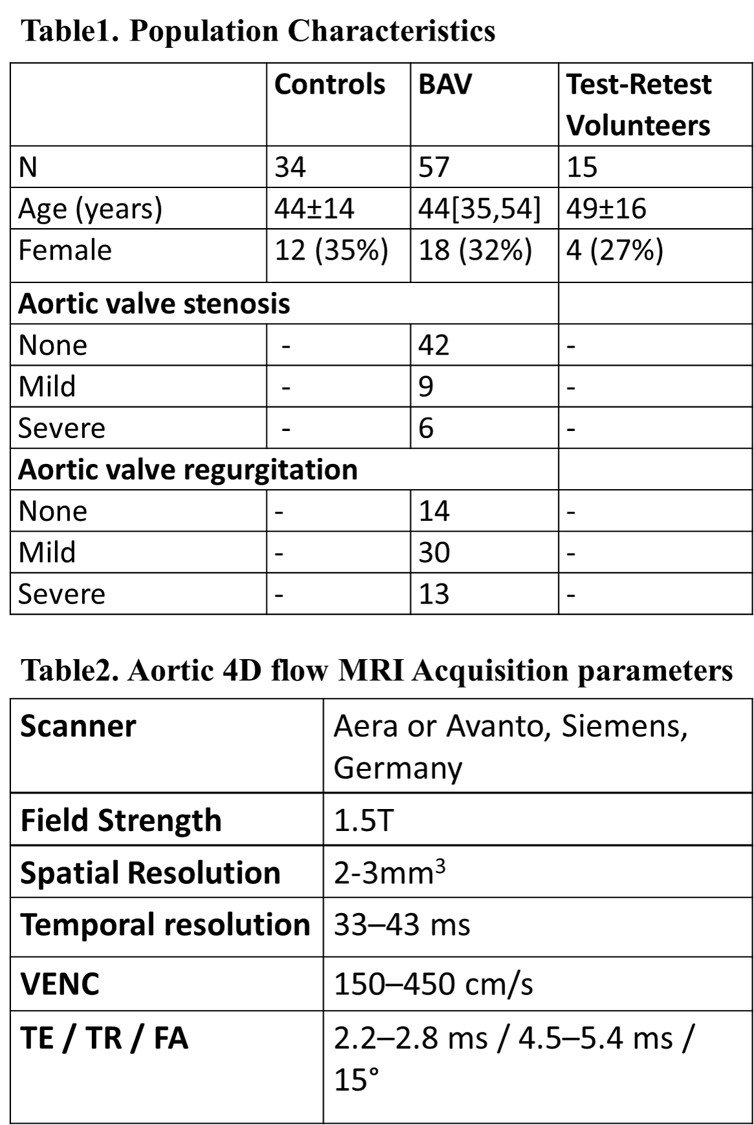
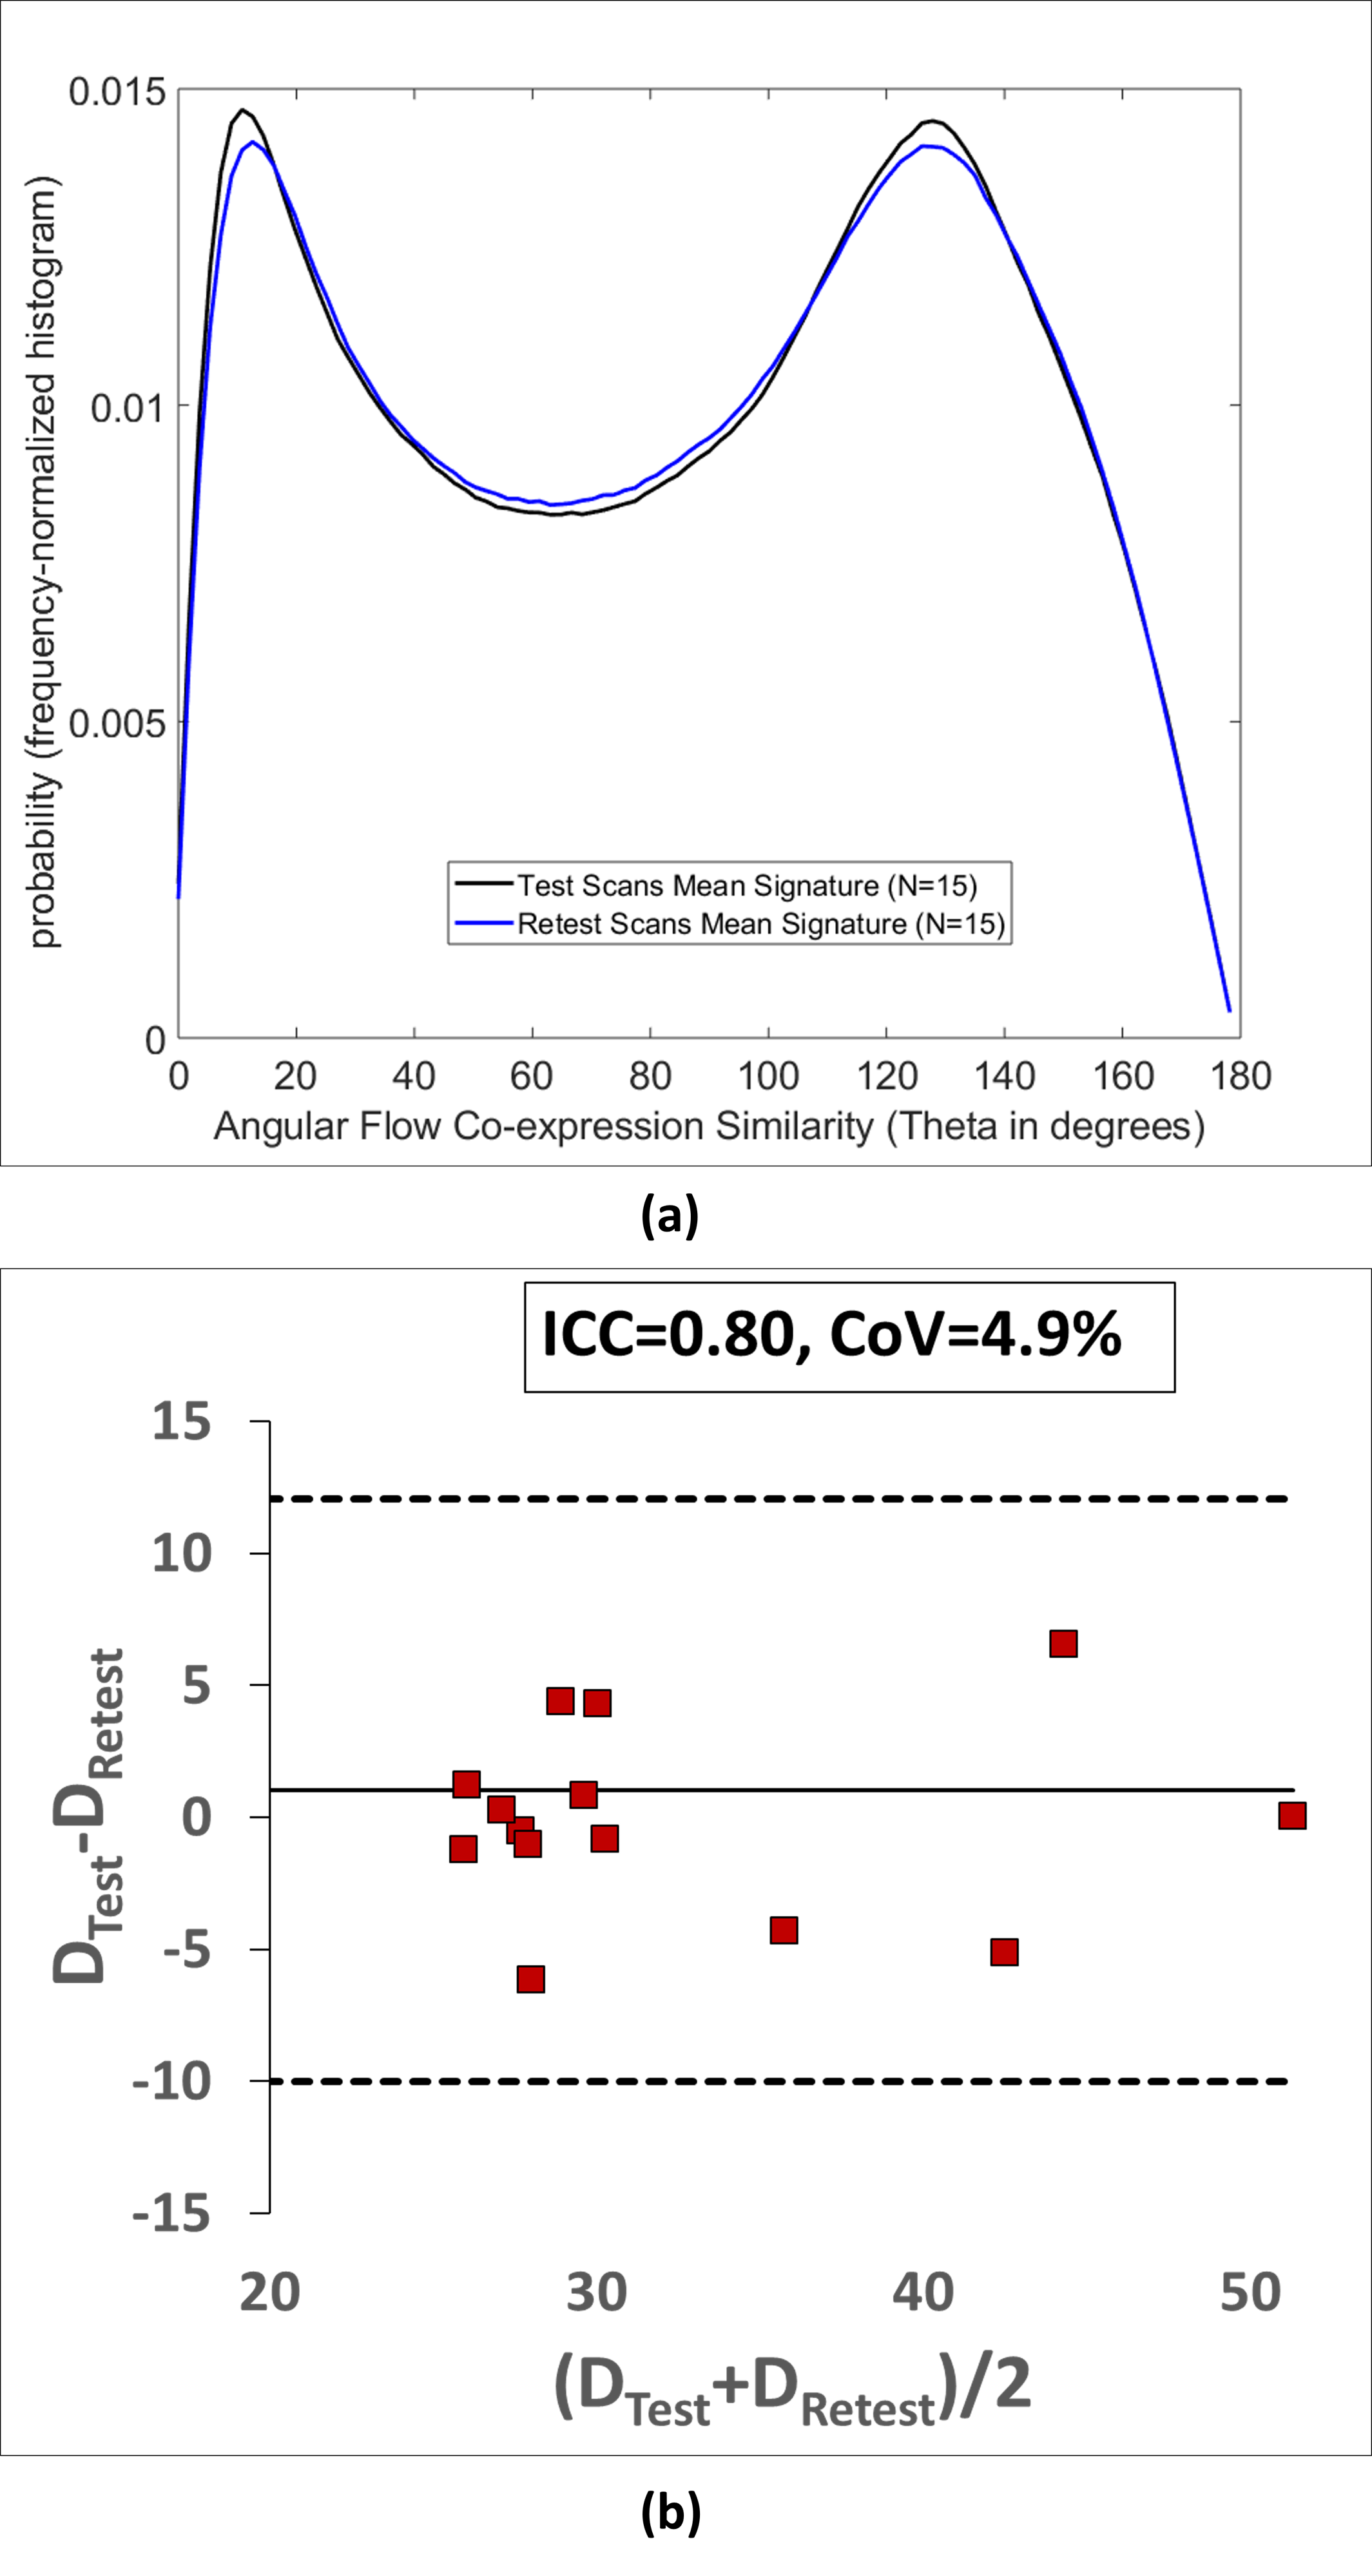
A total of 106 aortic 4D Flow MRI scans were analyzed from 91 subjects (57 BAV patients, 34 healthy controls) retrospectively enrolled from an IRB-approved study (Table.1). All patients underwent standard-of-care MRI protocol and 4D Flow MRI scanning (Table 2). Signature reproducibility was tested in 15 healthy subjects who undergone test-retest 4D Flow scanning within 2 weeks.
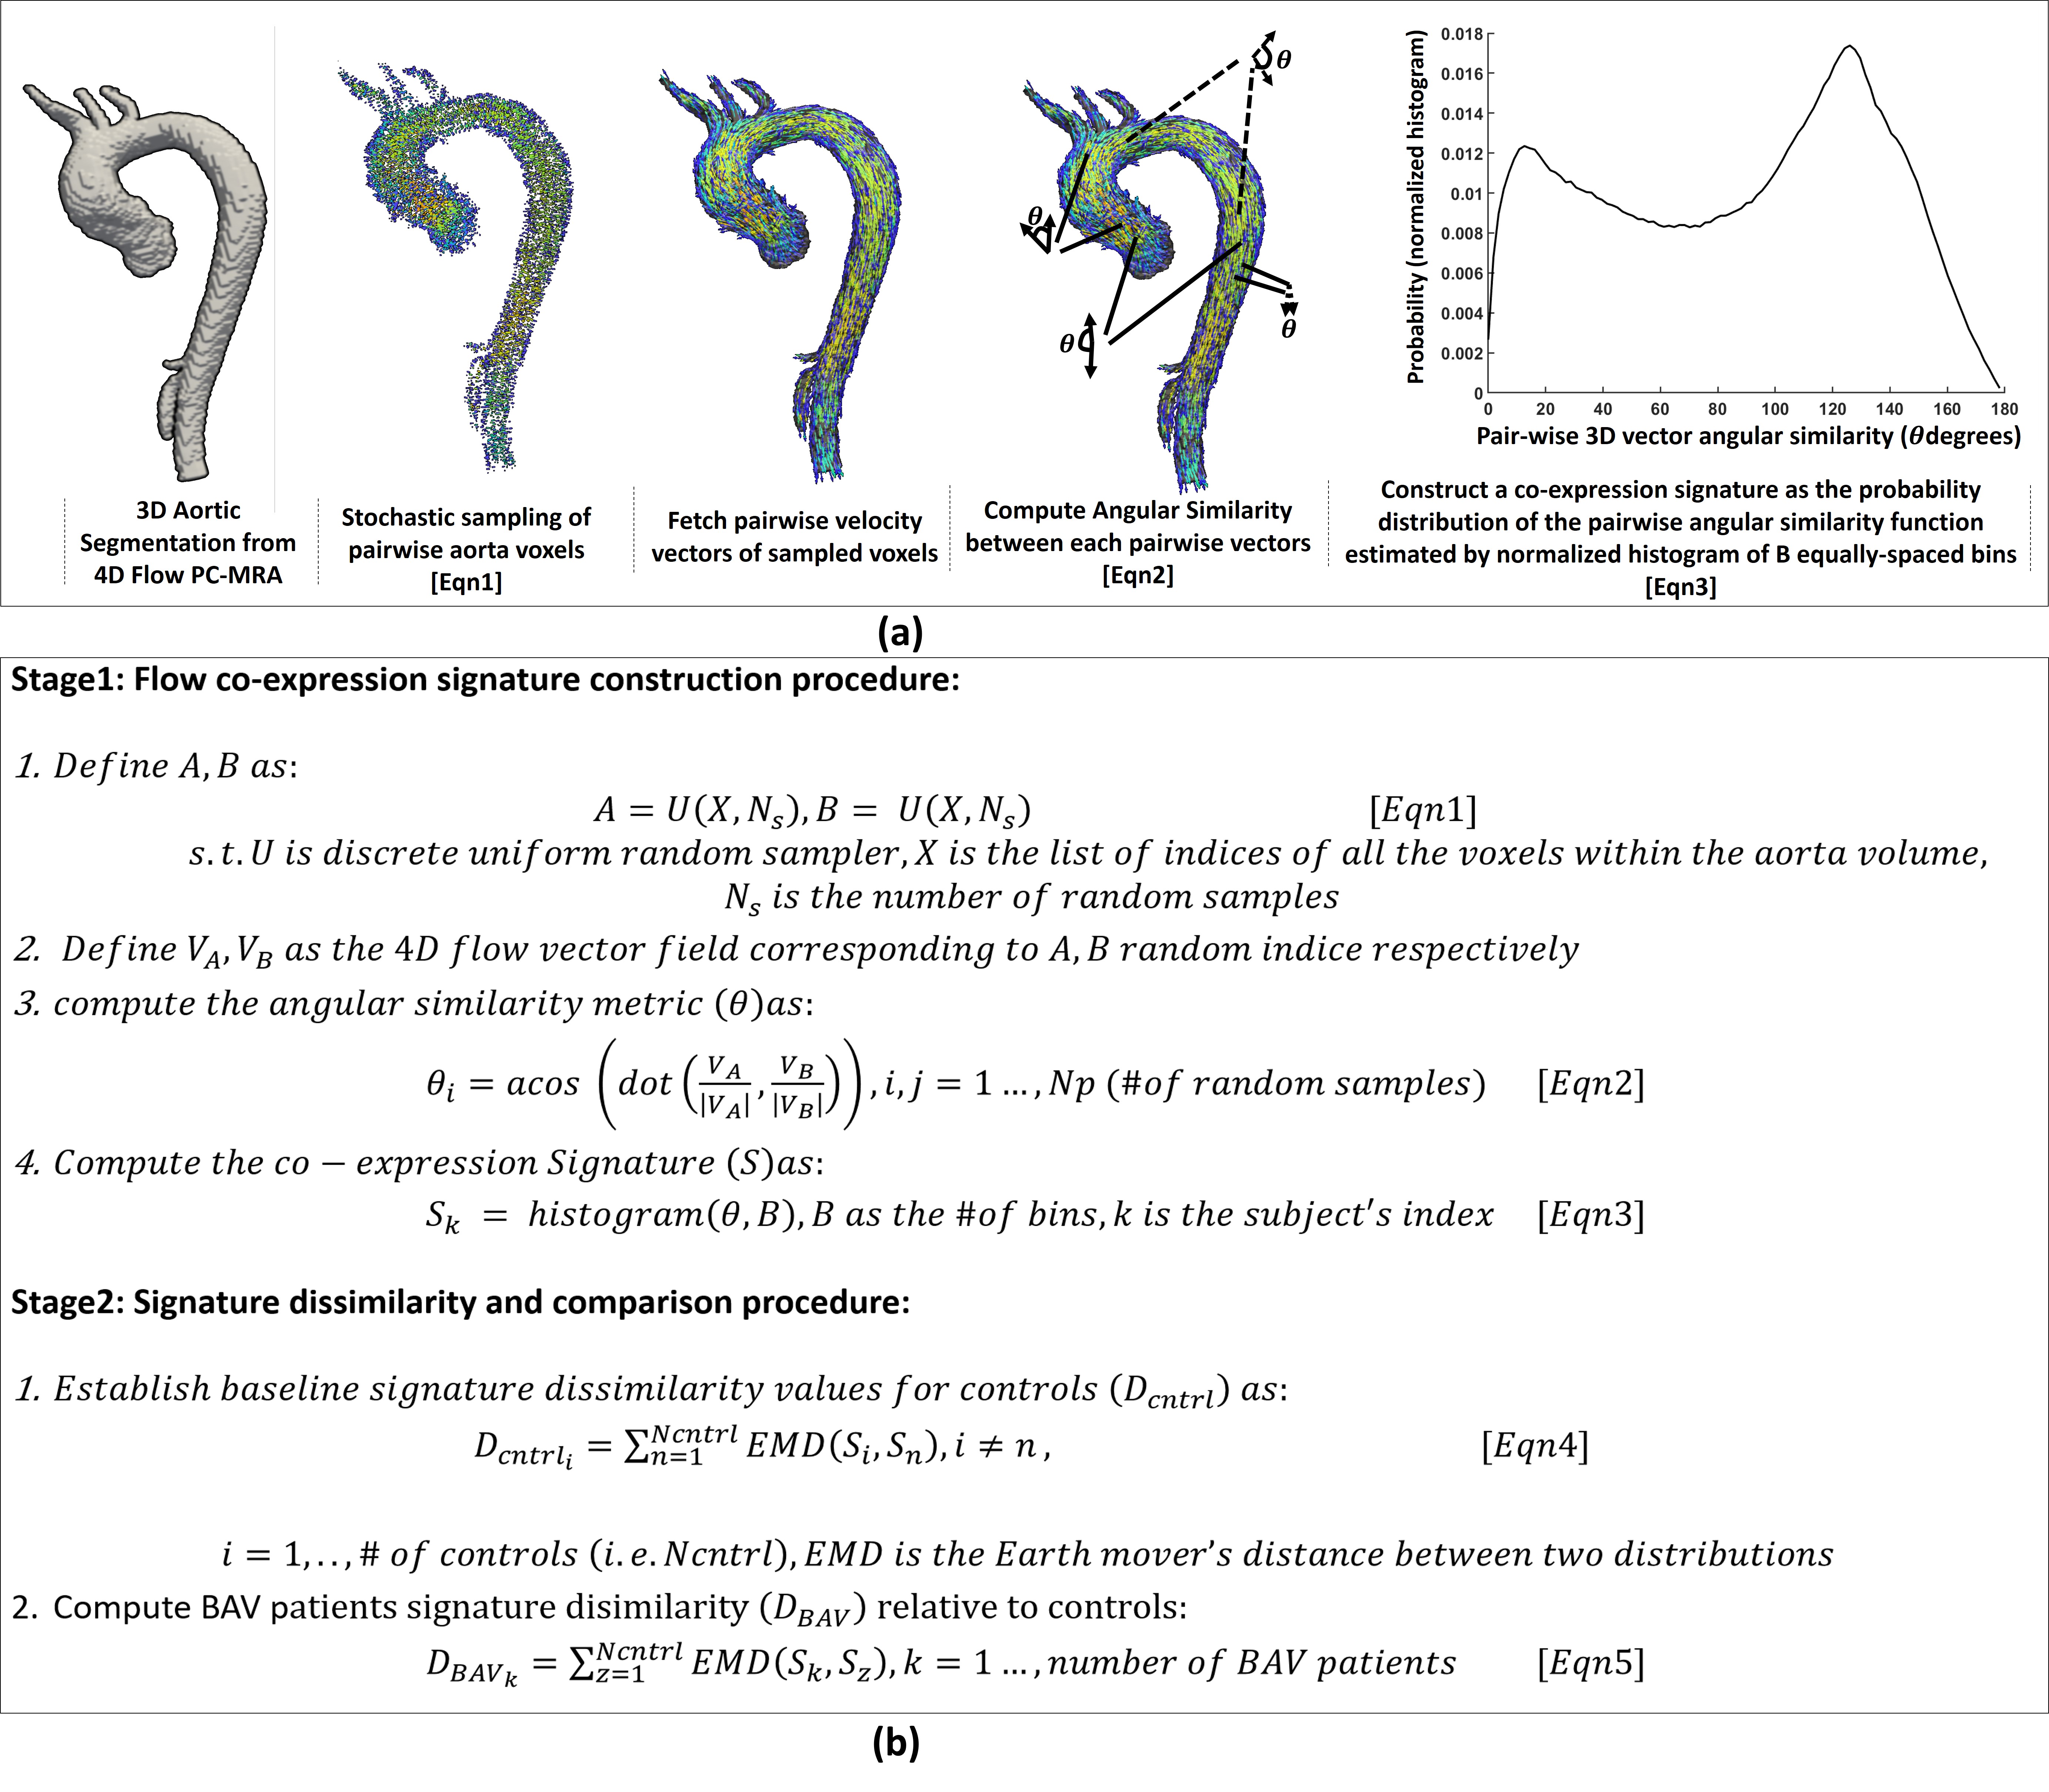
Stochastic Flow co-expression signature: The two analysis stages are summarized in Fig. 1:
Signature construction: 1) Segment the aorta volume from preprocessed 4D Flow MRI (Fig.1). 2) define a consistent time-point in the cardiac cycle to derive the signature. Peak systole was used for all subjects in this work. 3) Perform stochastic discrete uniform random sampling of Ns point (voxel) pairs over the entire segmented aortic volume. Ns = three million pairs of samples was used [Fig1. Eqn1]. 4) For each pair of samples, compare the disparity between their corresponding 4D Flow-derived velocity vectors using the angular similarity metric (θ) [Fig1. Eqn2] with θ=0° as perfect match, θ =180° as complete mismatch. Note that the angular similarity metric is scale invariant. 5) The subject’s signature (S) is then derived as the probability density function of θ as estimated using a frequency-normalized histogram of B bins [Fig1. Eqn3]. B=100 equally spaced bins was used.
Signature dissimilarity comparison (Fig.1b): 1) Define a dissimilarity metric to compare the derived signatures of different subjects. Here, we used the Earth Mover’s Distance (EMD) of distributions as the signatures dissimilarity metric1. 2) Establish baseline signature dissimilarity values for controls (Dcntrl) [Fig1. Eqn4]. 3) Compute dissimilarity of each BAV patient (DBAV) compared to all controls [Fig.1 Eqn5].
Results:
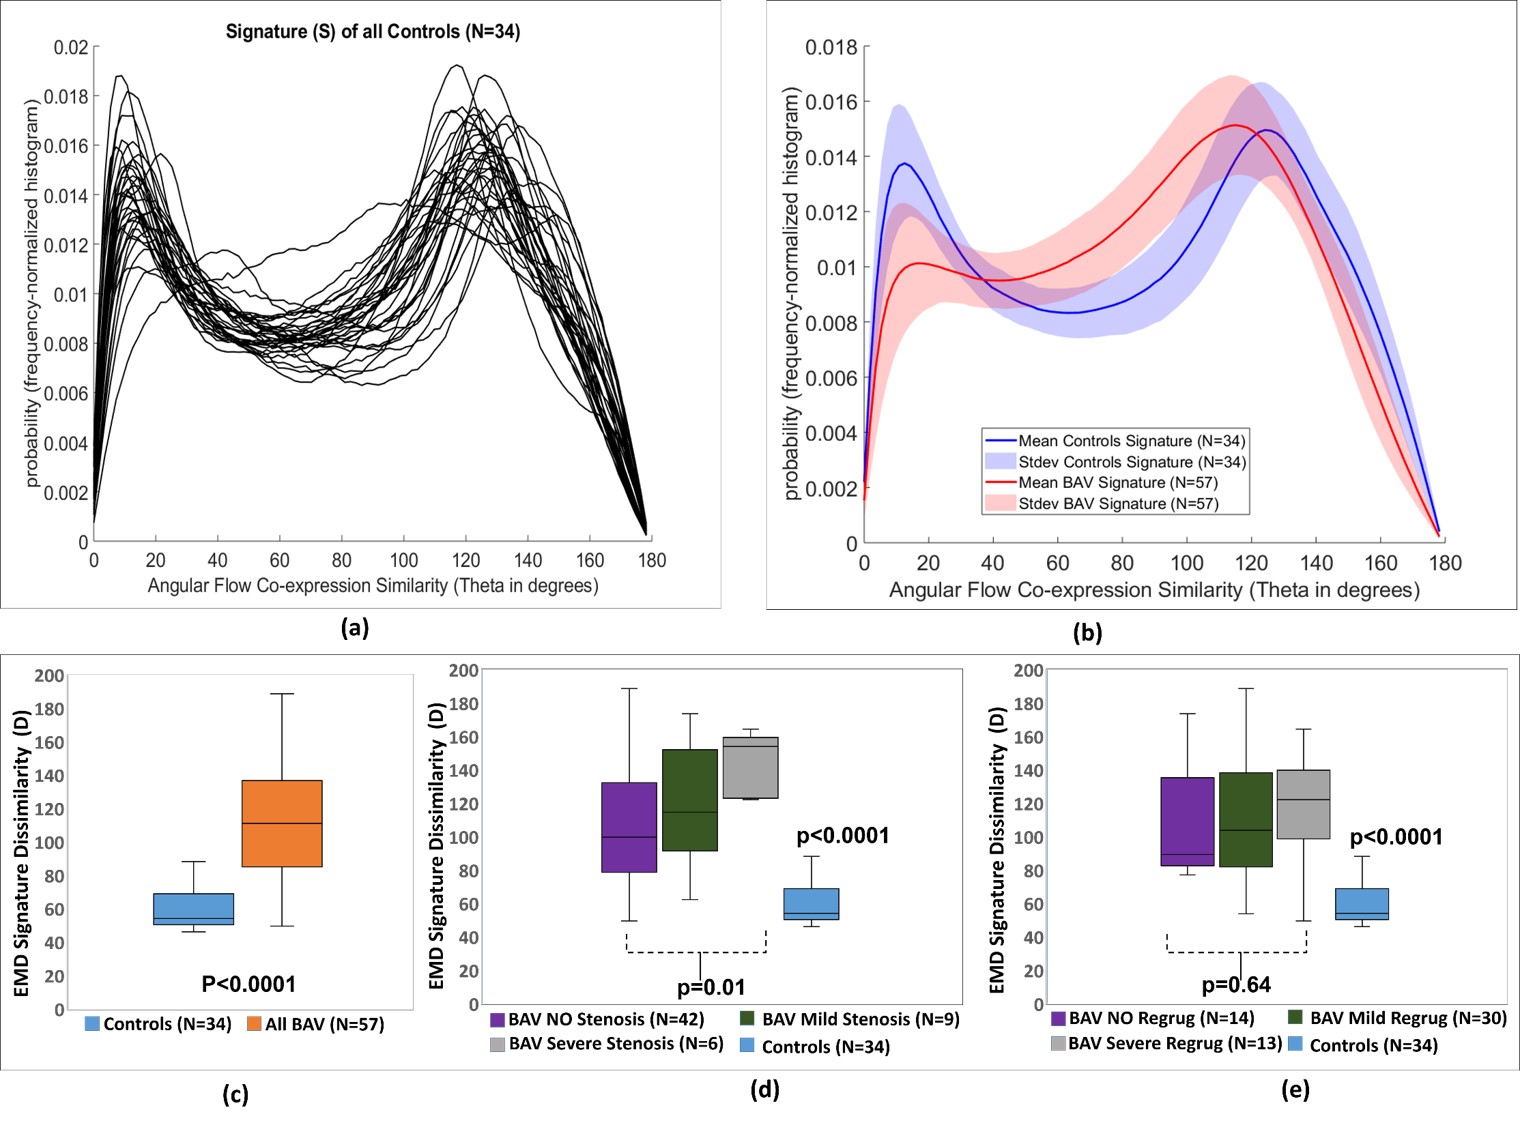
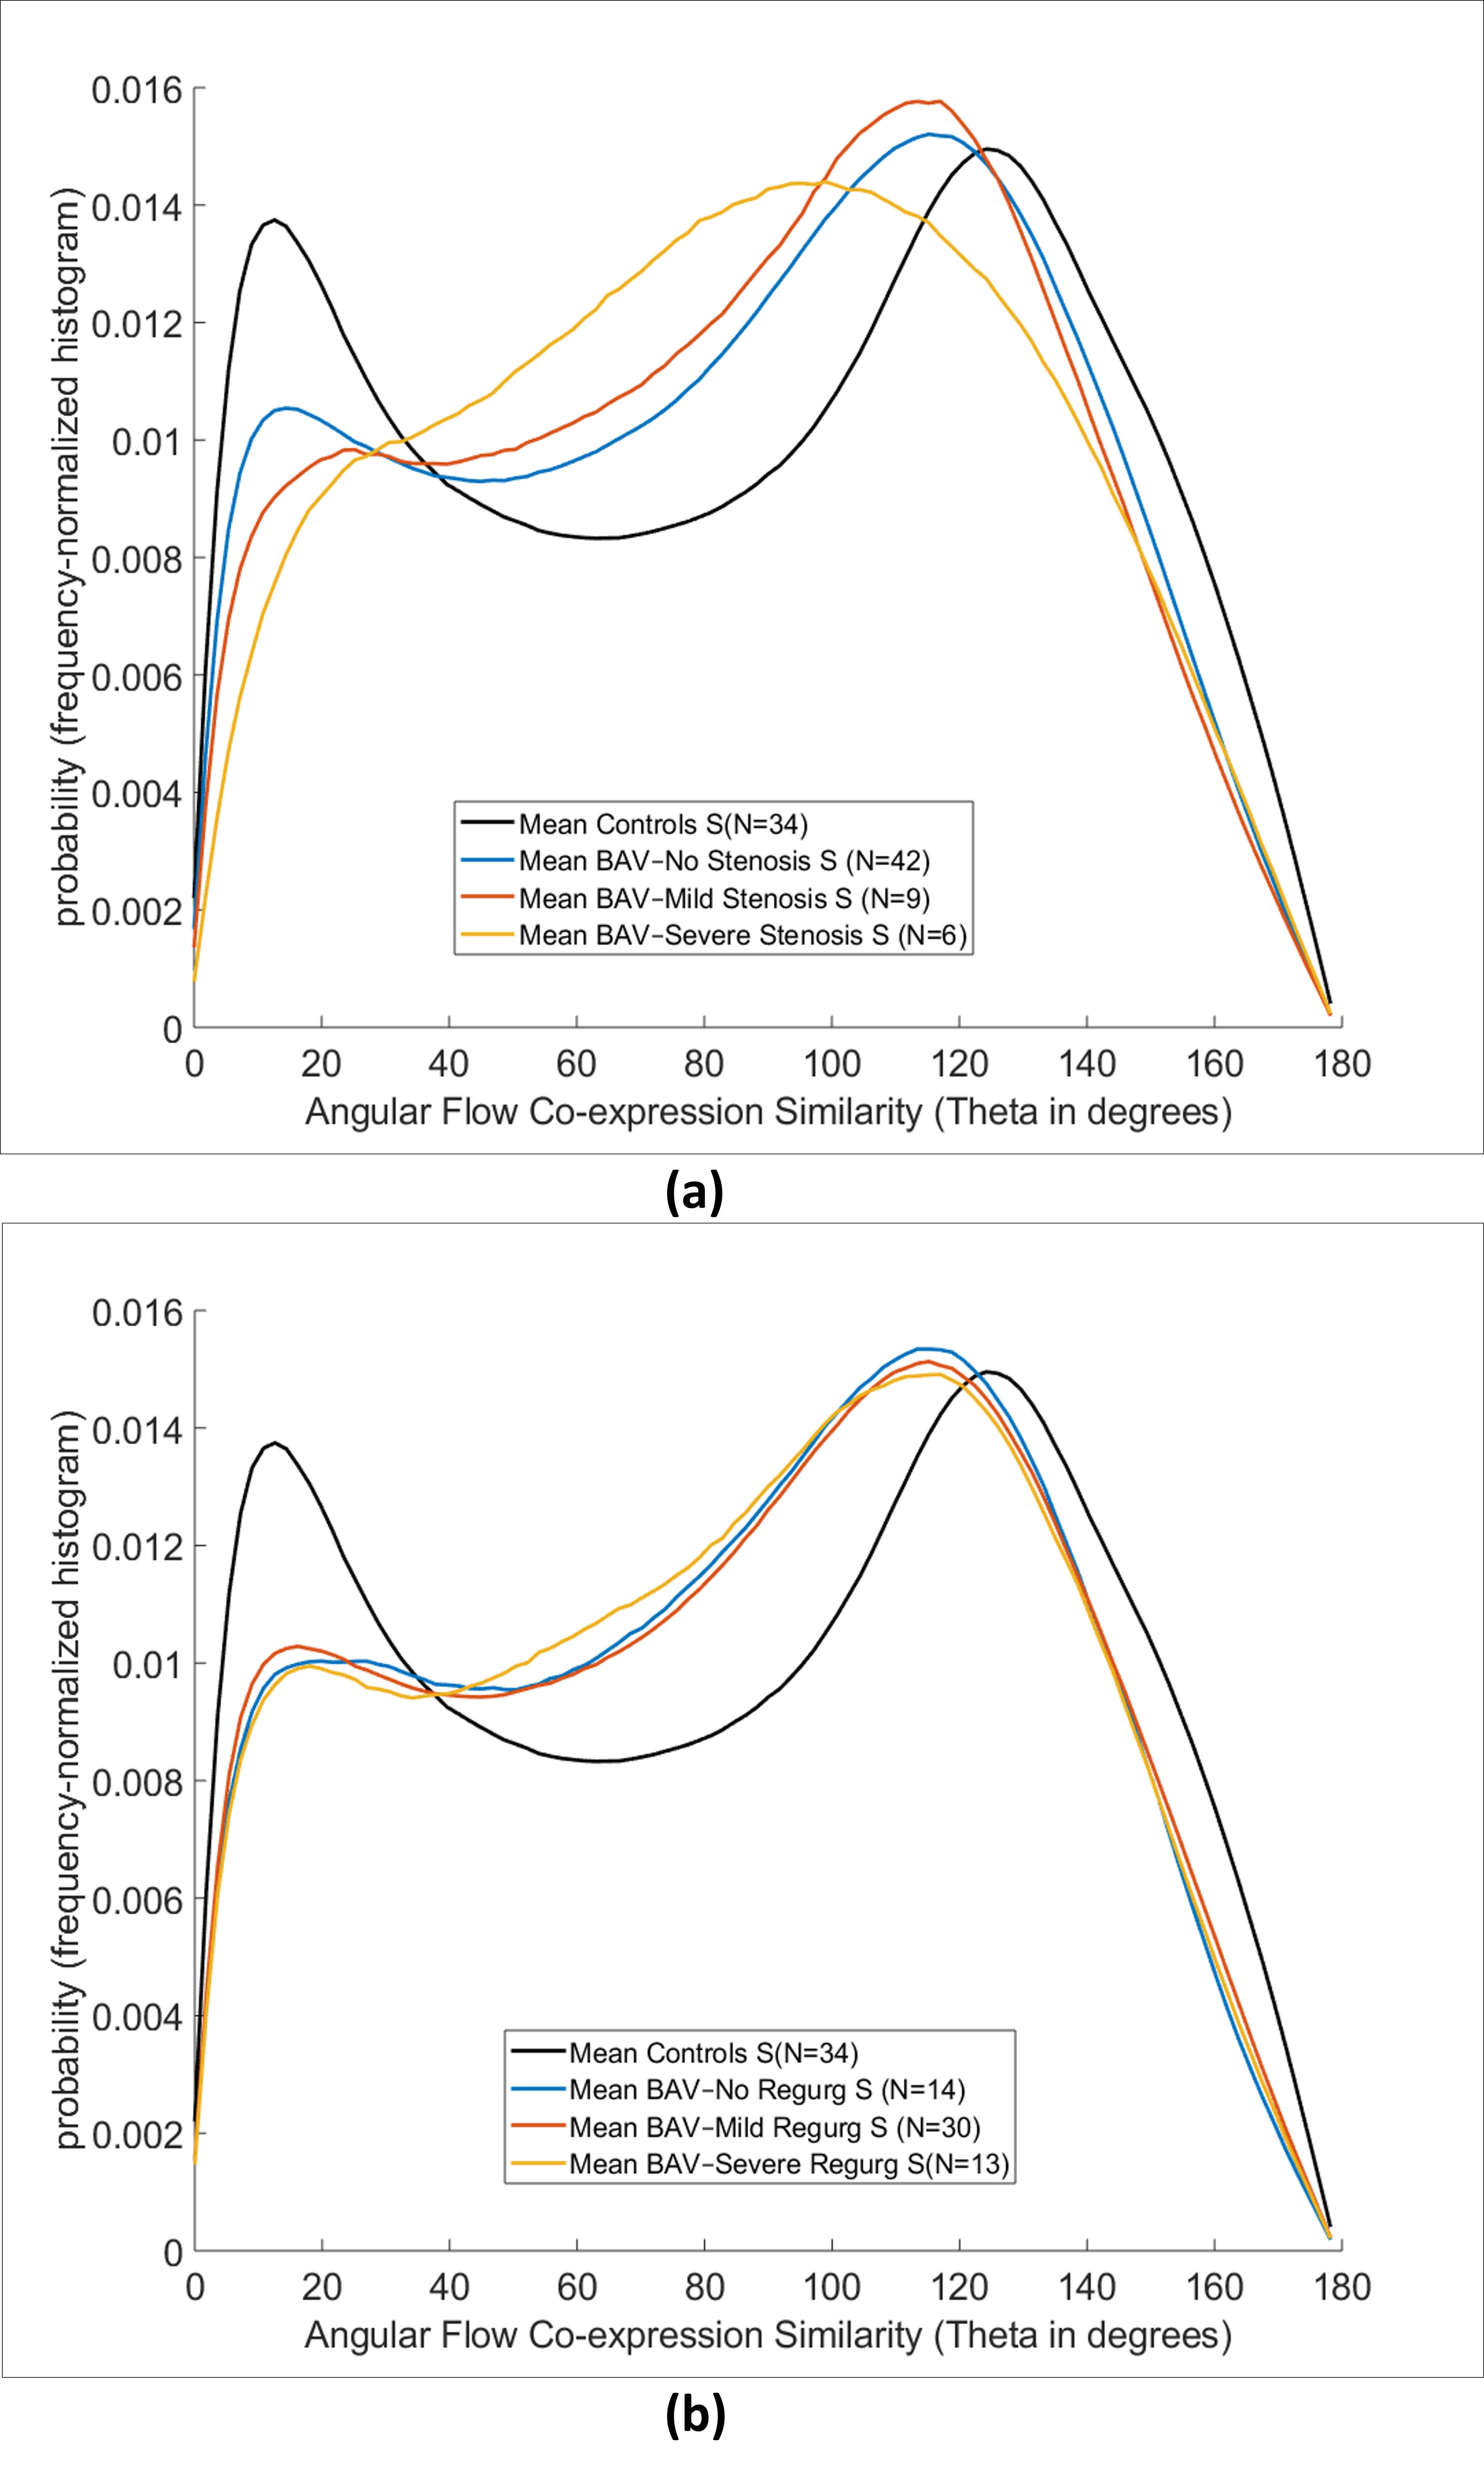
In all 106 4D Flow MRI scans, automated aortic flow co-expression signature construction was successful from the segmented aorta. Fig.2 shows that controls presented consistent signature while BAV patients showed distinctly altered flow co-expression signatures. This is highlighted by the rise in the co-expression disparity in BAV patients as indicated by the higher frequencies of large θ values and the decline in the frequencies of small θ values (Fig2.b, c). Importantly, as shown in (Fig. 2d, 3a), significant differences were found between the signatures of BAV patients with different stenosis degrees (Table 1) (Kruskal-Wallis p-value=0.01) and from controls (p-value<0.001 for all) with most pronounced alterations found in patients with severe aortic valve stenosis. The three BAV patient groups with different aortic valve regurgitation severity (Table 1) presented significantly different flow co-expression signatures compared to controls (p-value <0.001 for all) but not from each other (Kruskal-Wallis p-value=0.64) (Fig. 2e, 3b). High test-retest signature reproducibility was found (Fig.4a, b).Discussion and conclusions:
This study demonstrated the feasibility and reproducibility of a novel stochastic 4D flow co-expression signature concept. This quantitative signature identified distinctly altered volumetric pairwise aortic flow disparities in BAV patients from 4D Flow MRI. The pilot results showed the potential of the technique in identifying distinct flow co-expression signatures in BAV patients with different degrees of aortic valve stenosis. Notably, the derived signature is scale invariant hence identifies inherent flow changes independent of the aorta size or the absolute flow magnitude. The signature is volumetric and is directly applied to the 4D Flow MRI velocity field enabling high degree of automation. This eliminates the need for the challenging manual placement of 2D planes required by other techniques. The probabilistic nature of the signature makes it intrinsically robust to noise as this would appear in the low frequencies. In future, we will extend the technique to characterize time-varying signatures over the cardiac cycle and to assess large cohorts of various cardiovascular diseases.Acknowledgements
Grant support by R01HL115828 and R01HL133504References
1. Rubner Y, Tomasi C, and Guibas LJ. The earth mover's distance as a metric for image retrieval. International journal of computer vision. 2000;40:99-121.Figures