0086
Acute effects of nicotine-free e-cigarette aerosol inhalation on vascular function detected by multi-parametric quantitative MRI1Radiology, Laboratory for Structural, Physiologic and Functional Imaging, Perelman School of Medicine, University of Pennsylvania, Philadelphia, PA, United States, 2Institute for Environmental Medicine and Department of Phisiology, University of Pennsylvania Perelman School of Medicine, Philadelphia, PA, United States
Synopsis
Electronic cigarette (e-cig) vaping has been causally associated with arterial stiffening, oxidative stress, and impaired vasodilatory capacity. Here we investigated acute effects of nicotine-free e-cig vaping in terms of aortic pulse-wave velocity, a marker of arterial stiffness, and measures of peripheral and neurovascular reactivity to induced hypoxia, by means of a quantitative MRI protocol. Flow mediated dilation, a marker of endothelial function, was significantly impaired after vaping; moreover, the peripheral vascular response to cuff-induced ischemia and neurovascular reactivity were altered. Considering the increasing use of e-cig among youth, these results underscore the urgency of further investigation.
Background and Purpose
E-cigarettes (e-cig) can deliver nicotine through the vaporization of a liquid containing propylene glycol, (PG), vegetable glycerin (VG) or a blend of both as solvents and flavorings, thus avoiding combustion. E-cigs have thus been purported to constitute a safe alternative to tobacco smoking, and increasingly advertised to and used by youth1. However, recent evidence suggests potential adverse health effects of e-cig ‘vaping’, based on the following observations: 1) at common usage temperatures (T>215°C) the heated solvents in the e-cig can produce carcinogenic and neurotoxic carbonyl compounds by thermal breakdown2; 2) ultrafine particles present even in nicotine-free e-cig aerosol3 can translocate from the alveoli into the vasculature4; 3) flavor aldehydes can rapidly react with PG to form toxic and irritant acetals5.
As part of an ongoing research investigating the impact of e-cig aerosol inhalation on vascular function and tone, we derived MRI measures of peripheral and neuro-vascular reactivity as well as aortic pulse wave velocity (PWV) after nicotine-free e-cig aerosol inhalation in young non-smokers, using a multi-parametric MRI protocol.
Methods
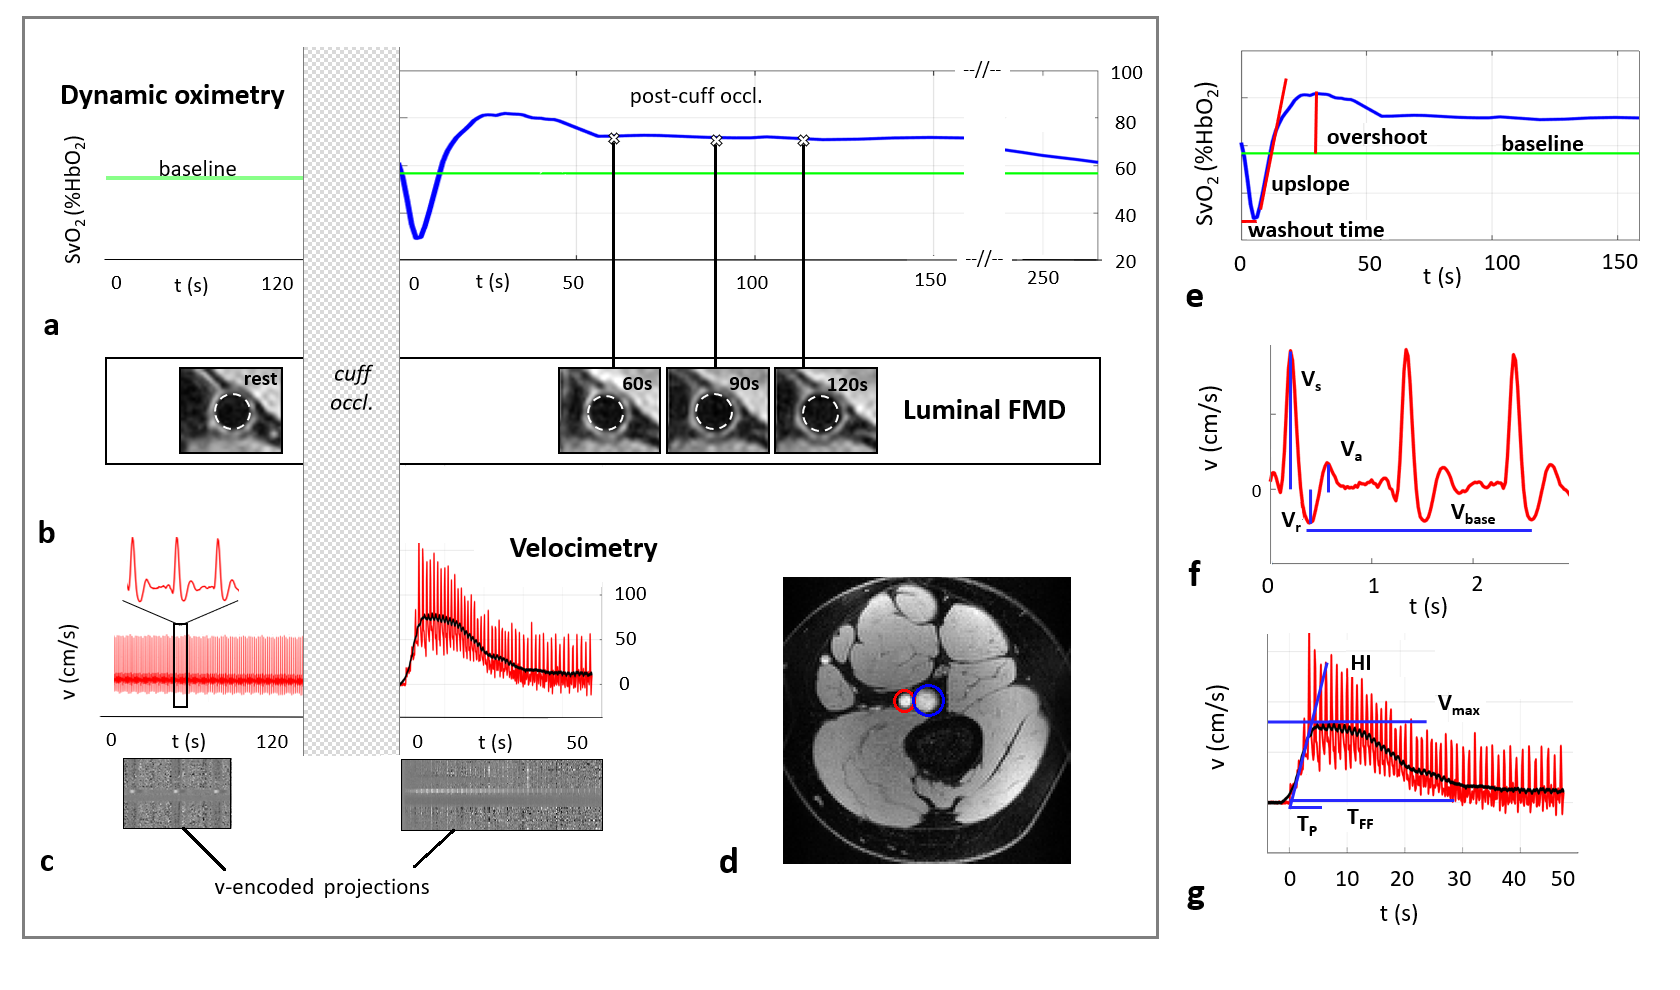
Young non-smokers (N=27, 11 female, age=24.2±4.4 years) with no history of cardiovascular disease, normal weight (BMI=23.2±2.3 kg/m2) and normal blood pressure (SBP/DBP=116.3±9.4/67.4±7.6) were recruited. Subjects underwent the same 50-min MRI protocol before and after a nicotine-free e-cig challenge (16 puffs, puff duration=3s, brand ePuffer: disposable e-cig containing 0 mg nicotine, pharma grade PG/VG=70/30%, flavors, with a lithium battery operating at 3.7 V). E-cig vaping was monitored and guided by a former smoker to ensure compliance with the inhalation paradigm. MRI scans were performed on a Siemens Prisma at 3.0 T. The protocol included: 1) peripheral vascular reactivity, which was assessed by means of a pneumatic cuff inflated at approximately 210-220mmHg on the thigh for 5 minutes (PVR, Fig. 1). An 8-channel knee coil was used to target the femoral vein (fv), where the temporal changes in oxygen saturation (SvO2) were followed dynamically, and femoral artery (fa) flow velocity was measured both before cuff occlusion and during hyperemia6. Luminal FMD was measured as $$$FMD_L=(A_t-A_0)/A_0 \cdot100$$$, where $$$A_0$$$ and $$$A_t$$$ are the fa’s cross-sectional area estimated at pre-cuff occlusion and at t=60, 90, 120 seconds from cuff release with vessel wall images7,8 . 2) neurovascular reactivity (NVR) was assessed with a hypercapnic-hypoxic challenge (three 30s breath-holds, interval=2mins). A 20 channels head coil was used to target the superior sagittal sinus, and a breath-hold index was computed as the upslope of blood velocity (Fig.2a-c), using flow-encoded BRISK cartesian sampling9. 3) Aortic stiffness was assessed by means of PWV quantification in free-breathing mode, with an ungated projection method10 (see Fig.2d-f for details). Differences in quantitative MRI (qMRI) parameters between pre and post e-cig vaping were evaluated with standard statistical tools.Results and Discussion
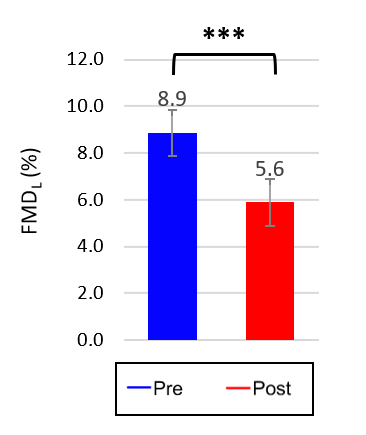
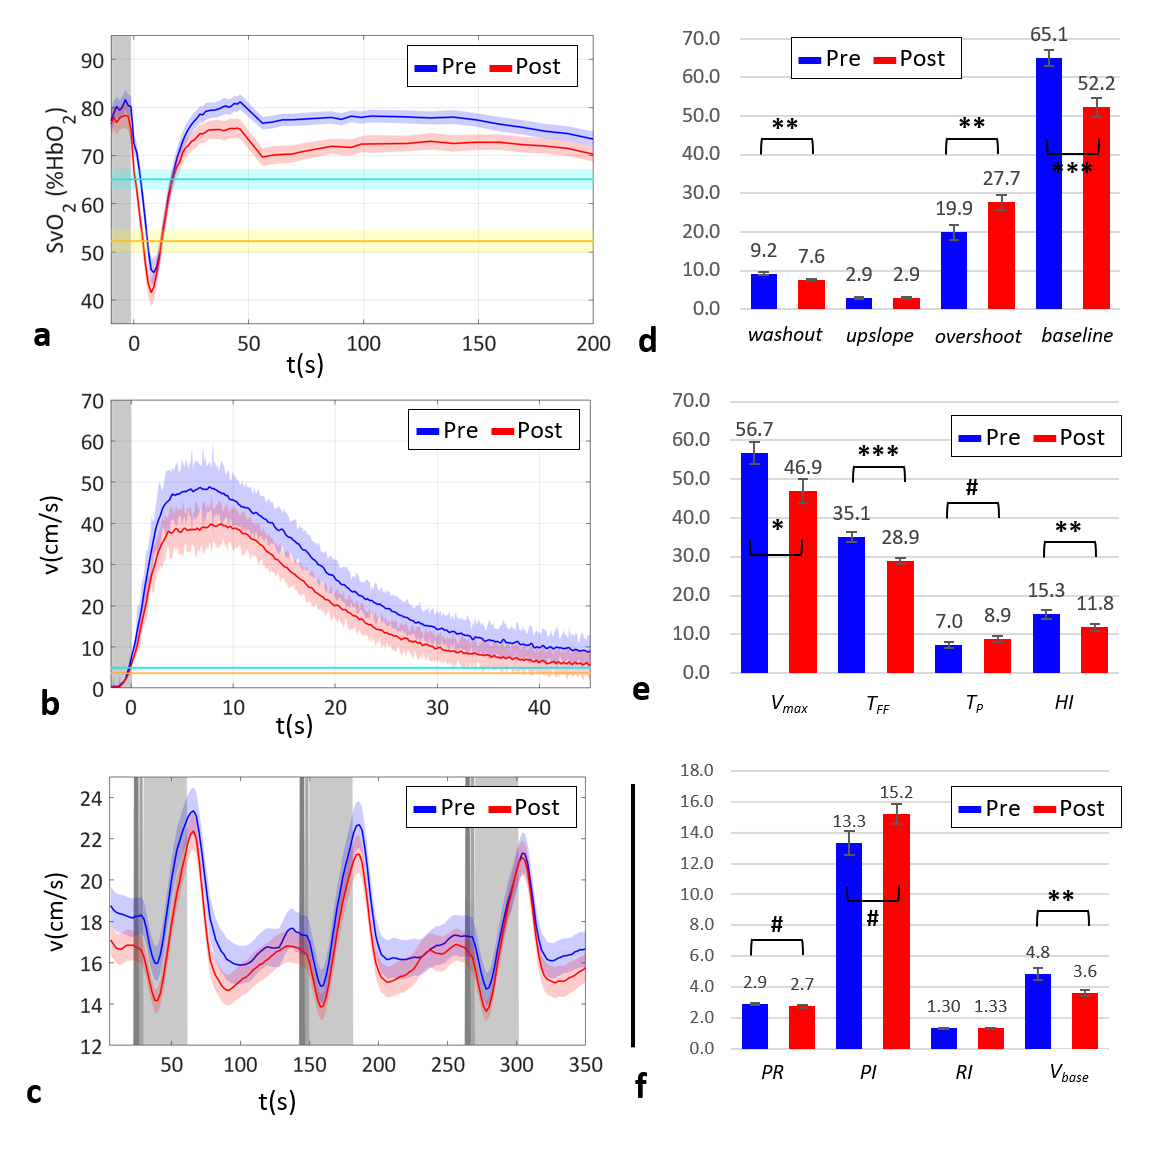
Study population averages and respective standard deviations of the qMRI parameters are listed in Table 1. Max FMDL was reduced by almost 40% after e-cig vaping (Fig.3), suggesting reduced nitric oxide bioavailability, possibly due to increased oxidative stress. Moreover, e-cig vaping altered dynamic oximetry and velocimetry responses to cuff occlusion (Fig.4a,b): after e-cig aerosol inhalation there was a faster washout of desaturated blood, and an increased re-saturation level in the post-cuff recovery period in the fv (Fig.4d); on the other hand, e-cig vaping caused decreased hyperemic flow, in terms of flow rate and peak velocity (Fig.4e). Unexpectedly, even the pre-cuff (baseline) parameters changed after vaping: the level of SvO2 and the arterial blood velocity at baseline were significantly reduced relative to pre e-cig values (Fig.4d,f). NVR was slightly but not significantly reduced (Fig.4c). However, there were no significant alterations in PWV due to e-cig aerosol inhalation, in agreement with a recent study showing no acute arterial stiffening after nicotine-free e-cig vaping11.Conclusions
Our results suggest that aerosol inhalation adversely impacts vascular function, unrelated to nicotine. Although many of our findings are highly statistically significant, corroboration of these observations in larger cohorts are indicated. While transient in nature, repeated vaping in brief intervals, is likely to cause permanent impairment of vascular tone.Acknowledgements
NIH Grant R01 HL139358References
1. Grana R, Benowitz N, Glantz SA. E-cigarettes: a scientific review. Circulation. 2014;129(19):1972-86. 2. Wang P, Chen W, Liao J, et al. A device-independent evaluation of carbonyl emissions from heated electronic cigarette solvents. PloS one. 2017;12(1):e0169811. 3. Williams M, Villarreal A, Bozhilov K, et al. Metal and silicate particles including nanoparticles are present in electronic cigarette cartomizer fluid and aerosol. PloS one. 2013;8(3):e57987. 4. Nakane H. Translocation of particles deposited in the respiratory system: a systematic review and statistical analysis. Environmental health and preventive medicine. 2012;17(4):263. 5. Erythropel HC, Jabba SV, DeWinter TM, et al. Formation of flavorant–propylene Glycol Adducts With Novel Toxicological Properties in Chemically Unstable E-Cigarette Liquids. Nicotine & Tobacco Research. 2018. 6. Langham MC, Wehrli FW. Simultaneous mapping of temporally-resolved blood flow velocity and oxygenation in femoral artery and vein during reactive hyperemia. Journal of Cardiovascular Magnetic Resonance. 2011;13(1):66. 7. Langham MC, Li C, Englund EK, et al. Vessel-wall imaging and quantification of flow-mediated dilation using water-selective 3D SSFP-echo. Journal of Cardiovascular Magnetic Resonance. 2013;15(1):100. 8. Schär M, Soleimanifard S, Bonanno G, et al. Precision and accuracy of cross‐sectional area measurements used to measure coronary endothelial function with spiral MRI. Magnetic resonance in medicine. 2018. 9. Rodgers ZB, Leinwand SE, Keenan BT, et al. Cerebral metabolic rate of oxygen in obstructive sleep apnea at rest and in response to breath-hold challenge. Journal of Cerebral Blood Flow & Metabolism. 2016;36(4):755-67. 10. Langham MC, Li C, Magland JF, Wehrli FW. Nontriggered MRI quantification of aortic pulse‐wave velocity. Magnetic resonance in medicine. 2011;65(3):750-5. 11. Franzen KF, Willig J, Cayo Talavera S, et al. E-cigarettes and cigarettes worsen peripheral and central hemodynamics as well as arterial stiffness: A randomized, double-blinded pilot study. Vascular Medicine. 2018;23(5):419-25.Figures