0065
Combined Diffusion-Relaxometry MRI to Identify Dysfunction in the Human Placenta1Centre for Medical Image Computing, University College London, London, United Kingdom, 2Biomedical Engineering, Kings College London, London, United Kingdom, 3Centre for the Developing Brain, King's College London, London, United Kingdom, 4Women's Health Department, King's College London, London, United Kingdom
Synopsis
We demonstrate simultaneous diffusion-relaxometry in the in-vivo human placenta. Two MRI measures widely used for characterizing the placenta, T2* relaxometry and diffusion, are combined into a single scan. We estimate the T2*-ADC spectrum, which enables study of the coupling between these complementary MR contrasts by disentangling joint effects. This gives new potential for improved characterisation of placental dysfunction compared to single contrast MRI and/or ultrasound, and hence could inform improved evaluation of pregnancy complications.
Introduction
The placenta provides the vital link between the woman and fetus during pregnancy. T2* relaxometry[1,2] and diffusion MRI[3–6] are emerging as highly promising methods for investigating this unique organ. T2* is related to oxygenation levels, and diffusion MRI gives information on tissue microstructure and microcirculation. Here we present a combined diffusion-relaxometry MRI acquisition and analysis pipeline. This allows for simultaneous measurement of, and exploration of the coupling between, these two distinct measurements in a sub 10-minute scan time.Methods
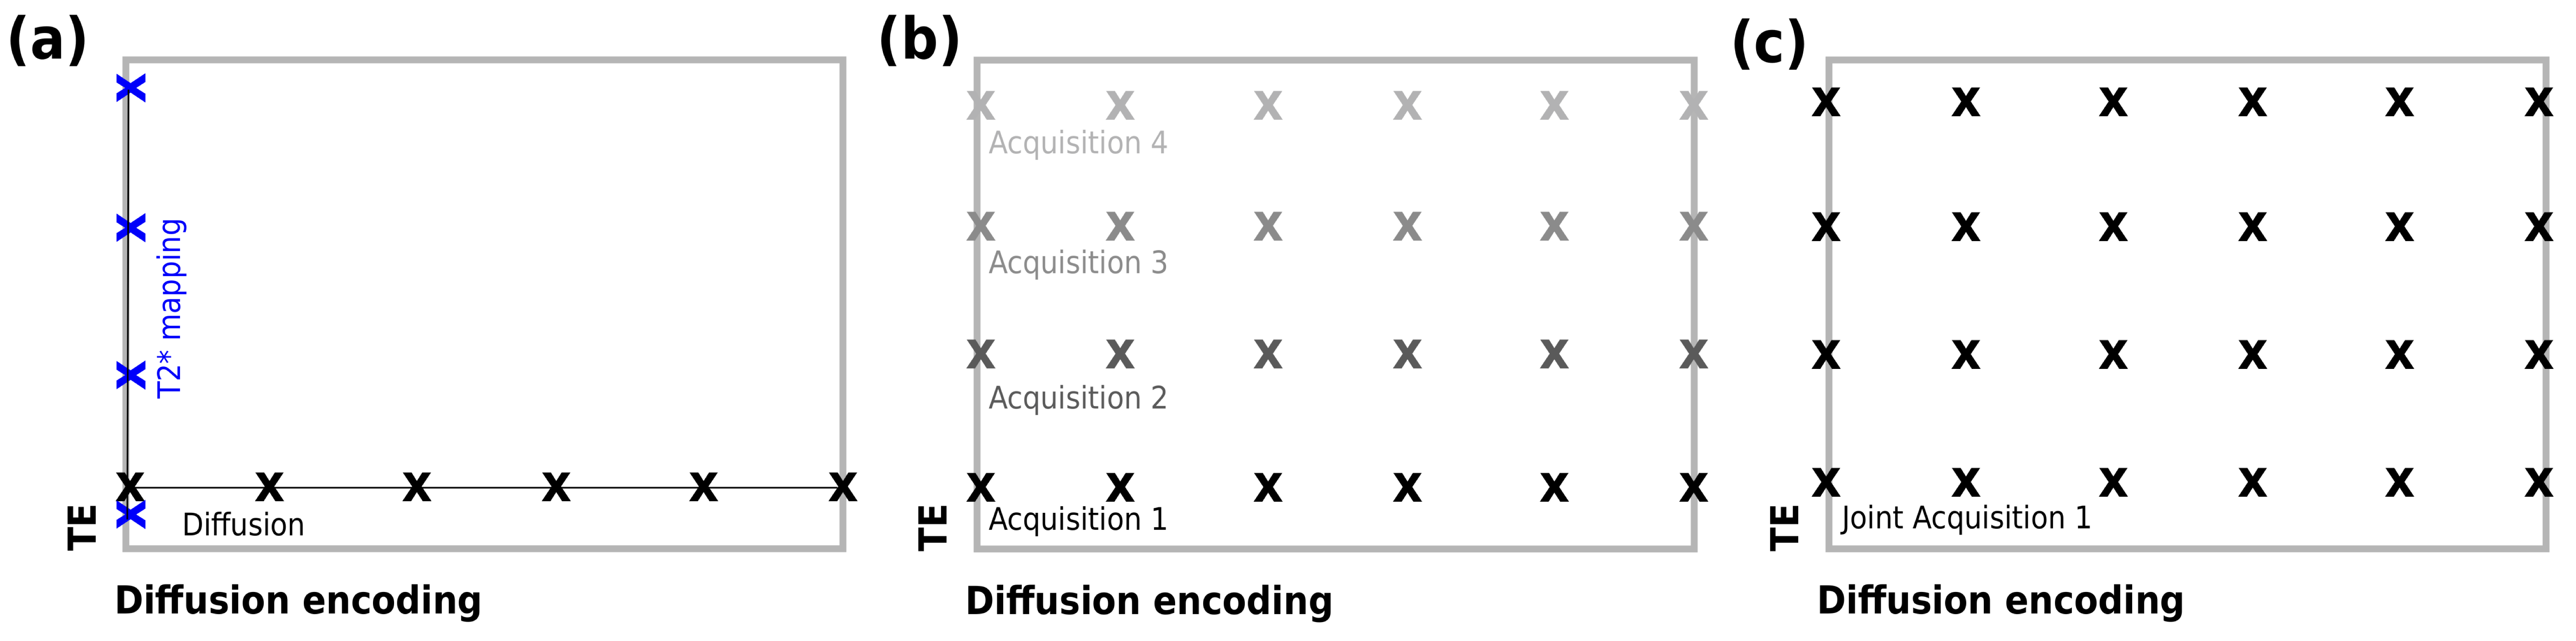
We utilise a novel MRI acquisition strategy, termed ZEBRA[7], in order to sample multiple echo times (TEs) and diffusion encodings within a single repetition time (TR). ZEBRA combines a diffusion prepared spin echo sequence with subsequent gradient echoes, enabling comprehensive sampling of the joint TE-diffusion encoding space (Figure 1). This in turn allows fast simultaneous estimation of T2* and diffusivity, and disentangling of inherent correlations between these two MR contrasts.
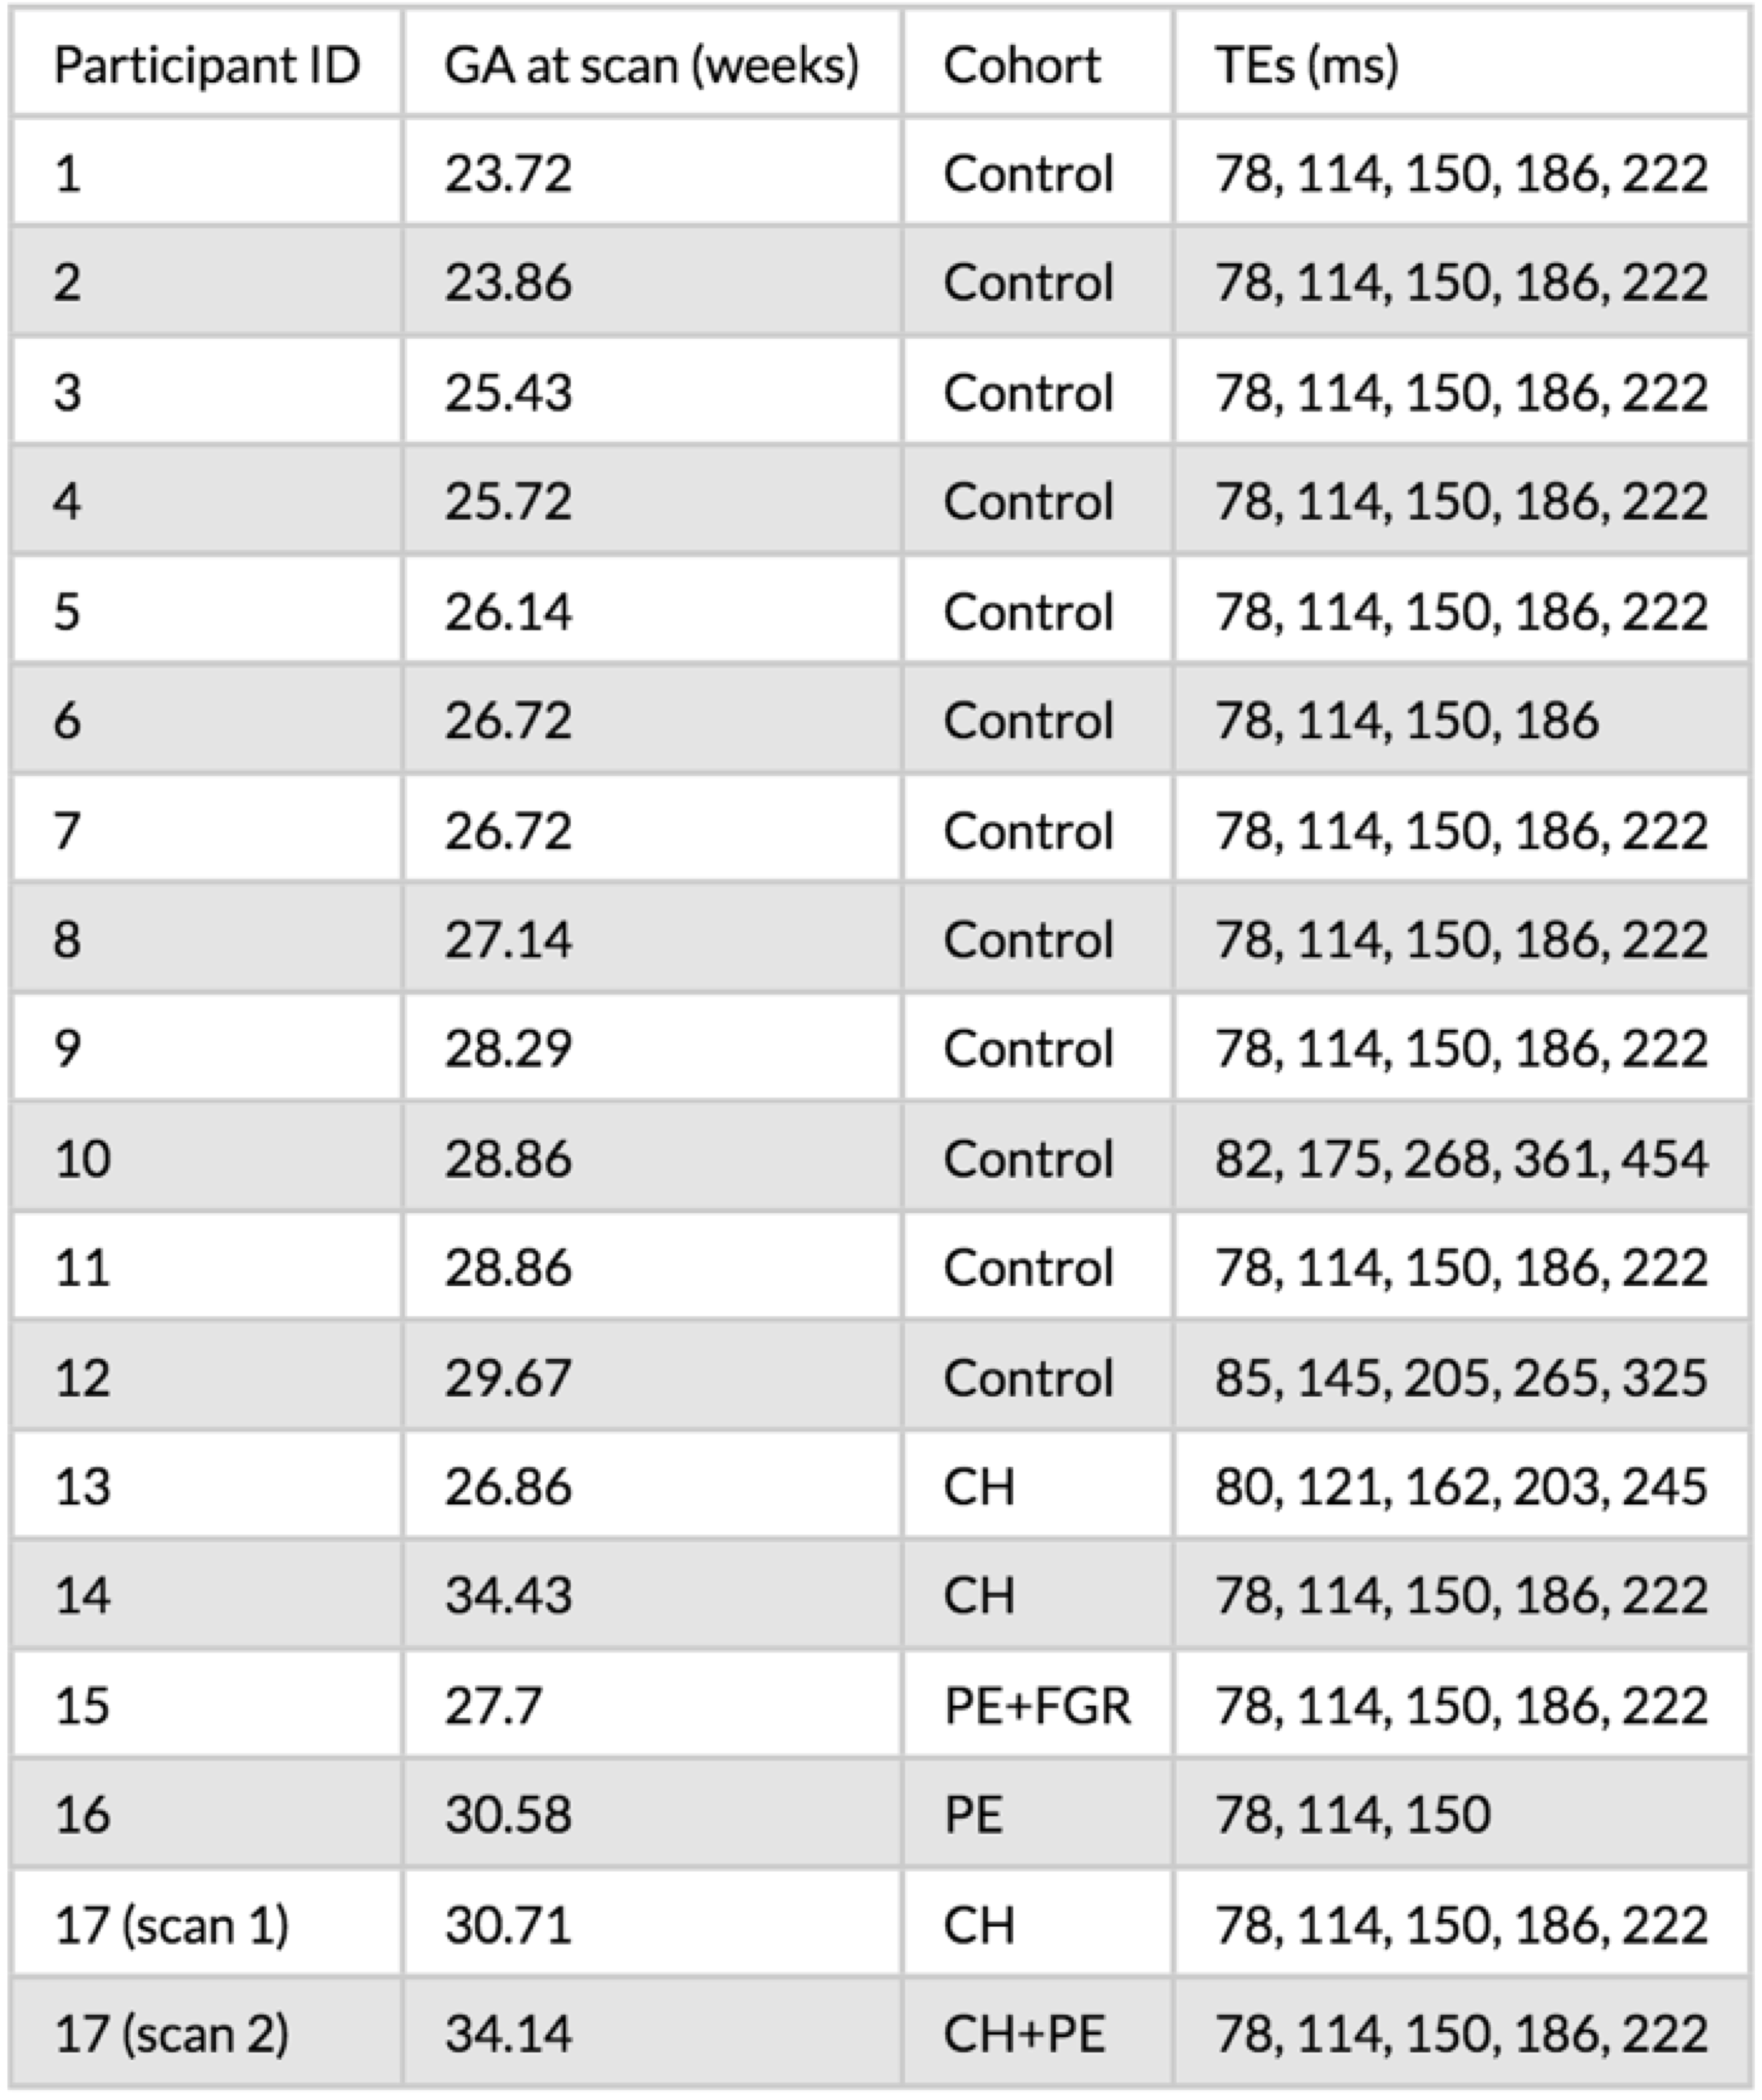
Following written informed consent, 17 pregnant women were imaged. The participants were grouped by clinical status (healthy control, chronic hypertensive [CH], pre-eclampsia [PE], fetal growth restriction [FGR]) as shown in Table 2. One CH participant was scanned twice (four weeks apart) and was diagnosed with superimposed PE before the second scan.
The number and timing of gradient echoes varied across scans (Table 2) with most scans having five TEs. The diffusion encodings were designed specifically for the placenta as previously reported[8,9]. Further parameters were FOV = 300x320x84 mm, TR = 7s, SENSE = 2.5, halfscan = 0.6, resolution = 3 mm3, acquisition time: approximately 8 minutes 30 seconds. One participant was scanned at higher resolution: 2 mm3. Regions of interest (ROIs) containing the whole placenta and adjacent uterine wall section were manually defined on the first b=0 image with the lowest TE.
We analysed the data using a continuum model (e.g. [10,11]), which considers that spins have a spectrum of relaxivity (or diffusivity) values all contributing to the MRI signal. The signal is
$$S(T_E,b) = S_0 \int \int p(T_2^*,ADC) e^{-TE/T_2^*} e^{-b ADC} \;dT_2^* dADC$$
where $$$T_E$$$ is the field echo time measured from the spin echo, $$$b$$$ is the b-value, $$$ADC$$$ is the apparent diffusion coefficient, $$$S_0$$$ is the signal at the spin-echo time with zero diffusion weighting, and $$$p(T_2^*, ADC)$$$ is the joint T2*-ADC spectrum. We estimated the T2*-ADC spectra - both voxelwise and using ROI averaged signal – by performing a 2D inverse Laplace transform using the MERA toolbox[12]. Separate peaks in these spectra potentially correspond to distinct tissue compartments or microenvironments.
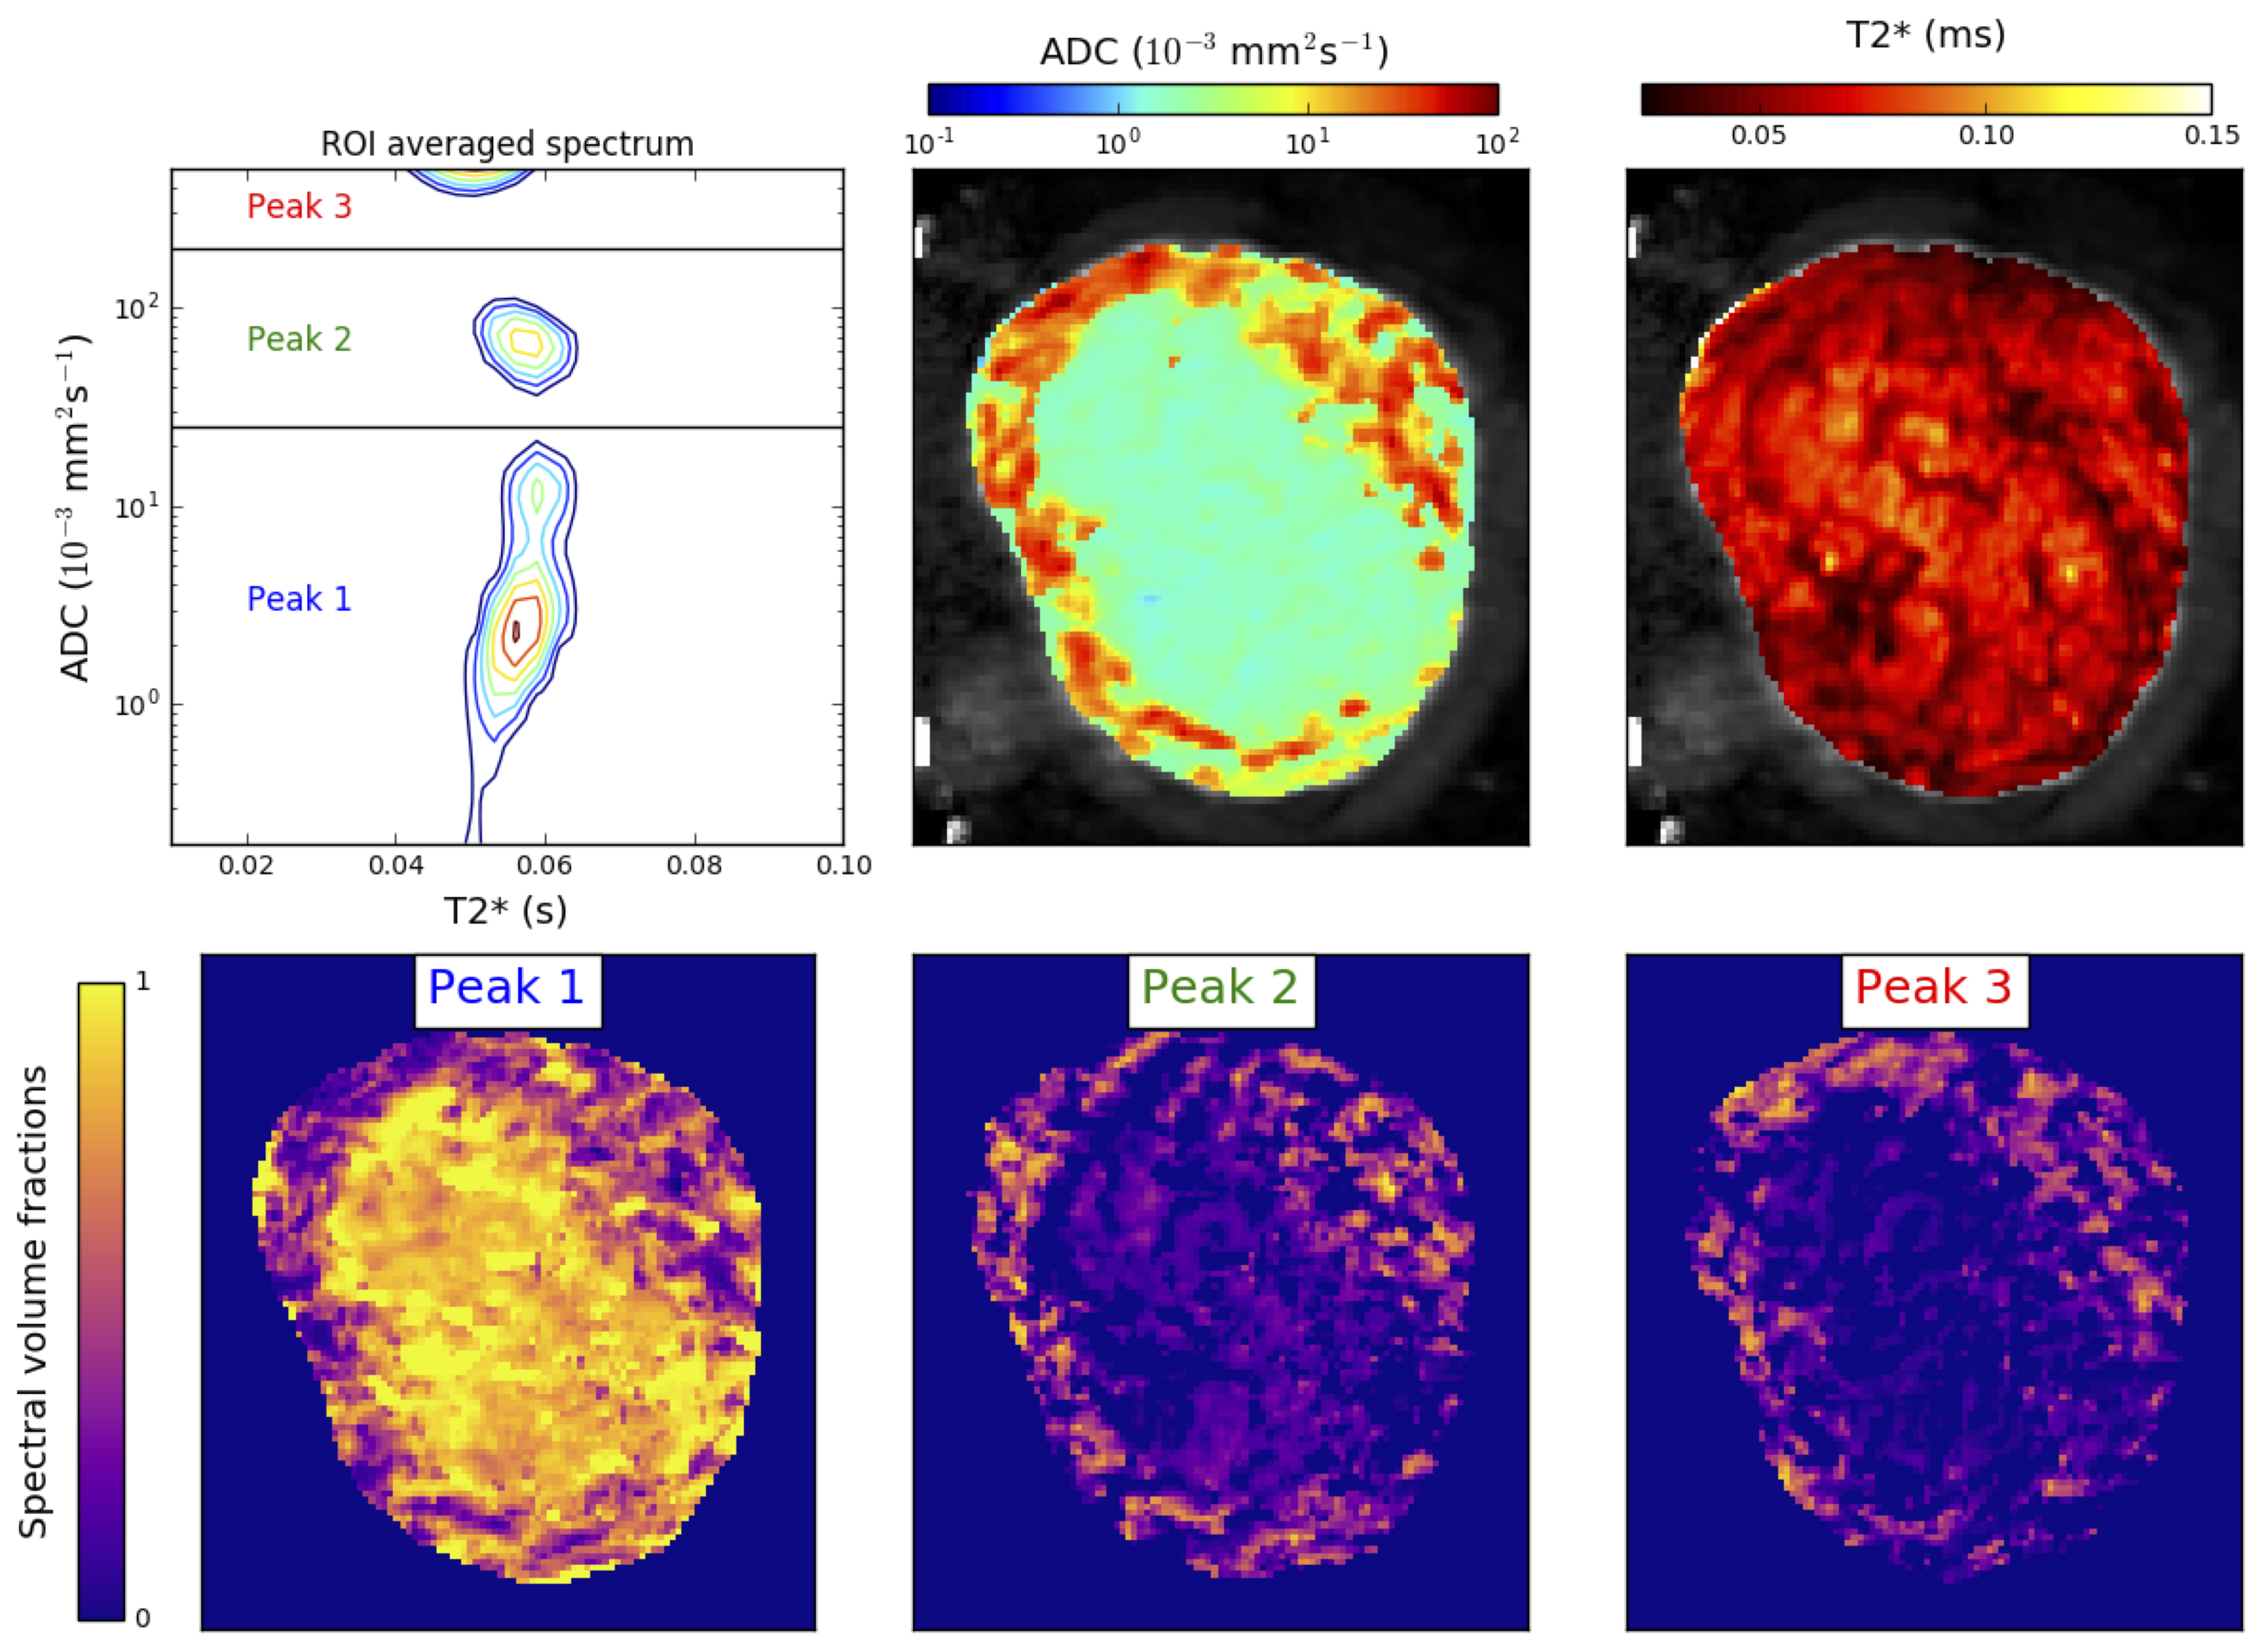
We quantified spatial variation in spectra similarly to references [10,11] by calculating the weight of voxelwise spectra in common peak areas identified in ROI-averaged spectra, hence producing apparent spectral volume fraction maps.
Results
Figure 3 shows the full analysis pipeline output for a single participant. We observe three peaks clearly separated by ADC value, but with similar T2* values. ADC and T2* maps show distinctive spatial patterns, with the ADC much higher in the uterine wall than the placenta. The bottom row of Figure 3 shows that the spectral domain with the lowest ADC (i.e. peak 1) is associated with areas within the placenta, and the two domains (peaks 2 and 3) with higher ADC are more prominent in the uterine wall.
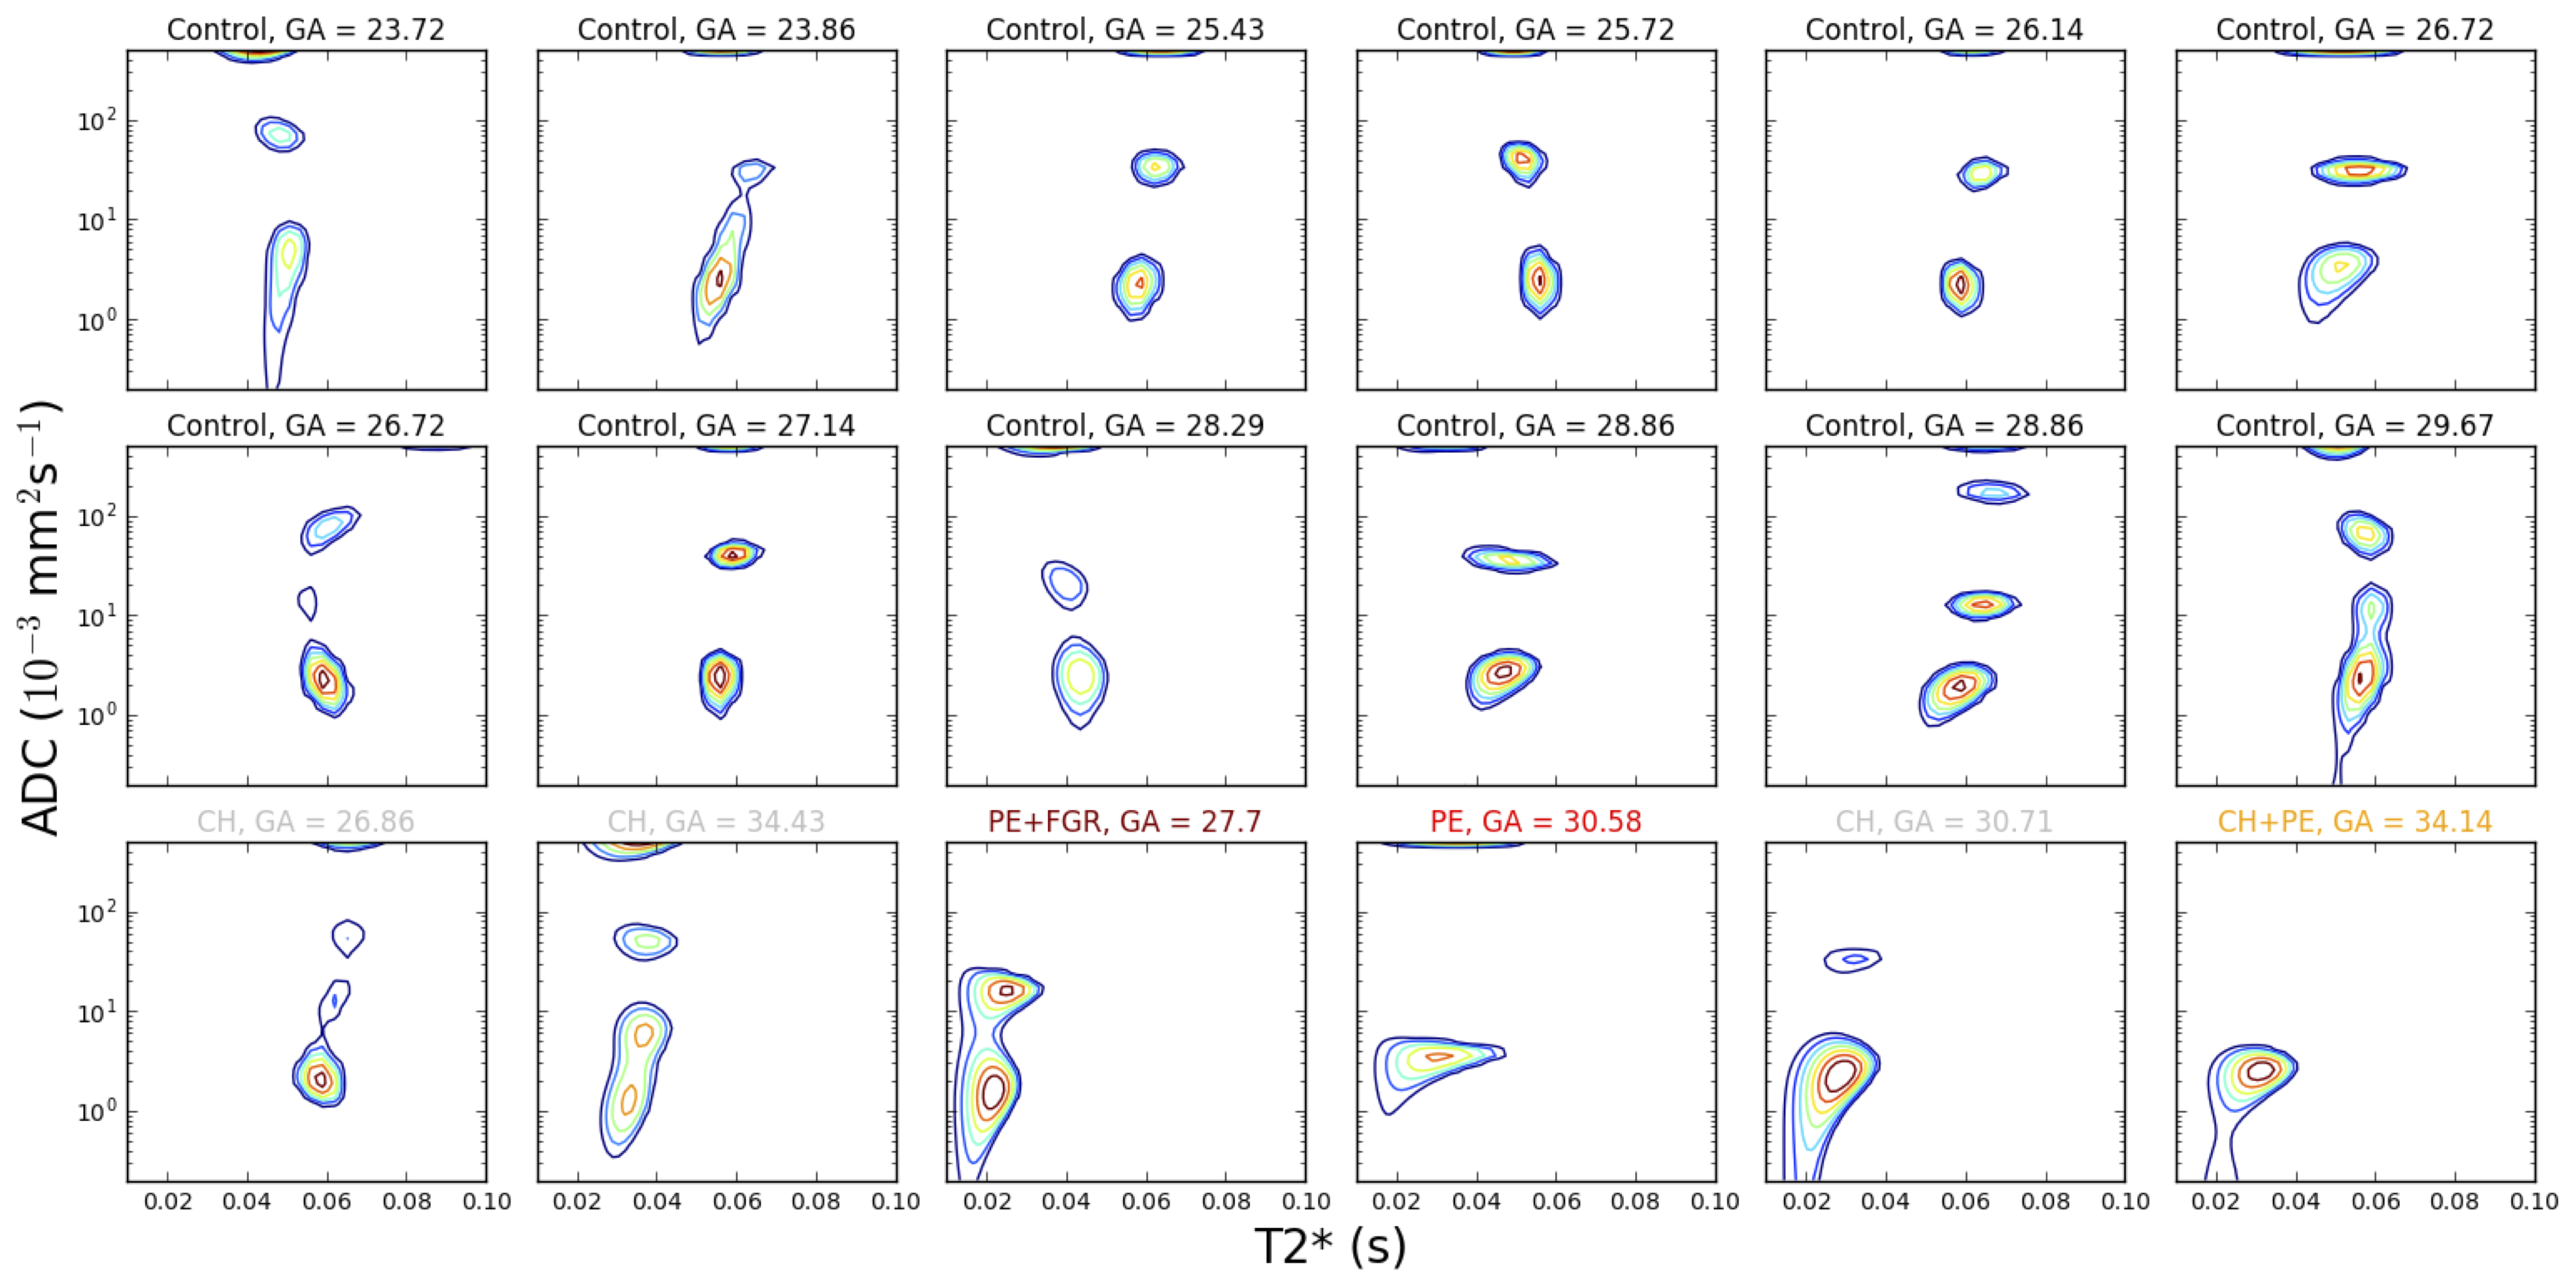
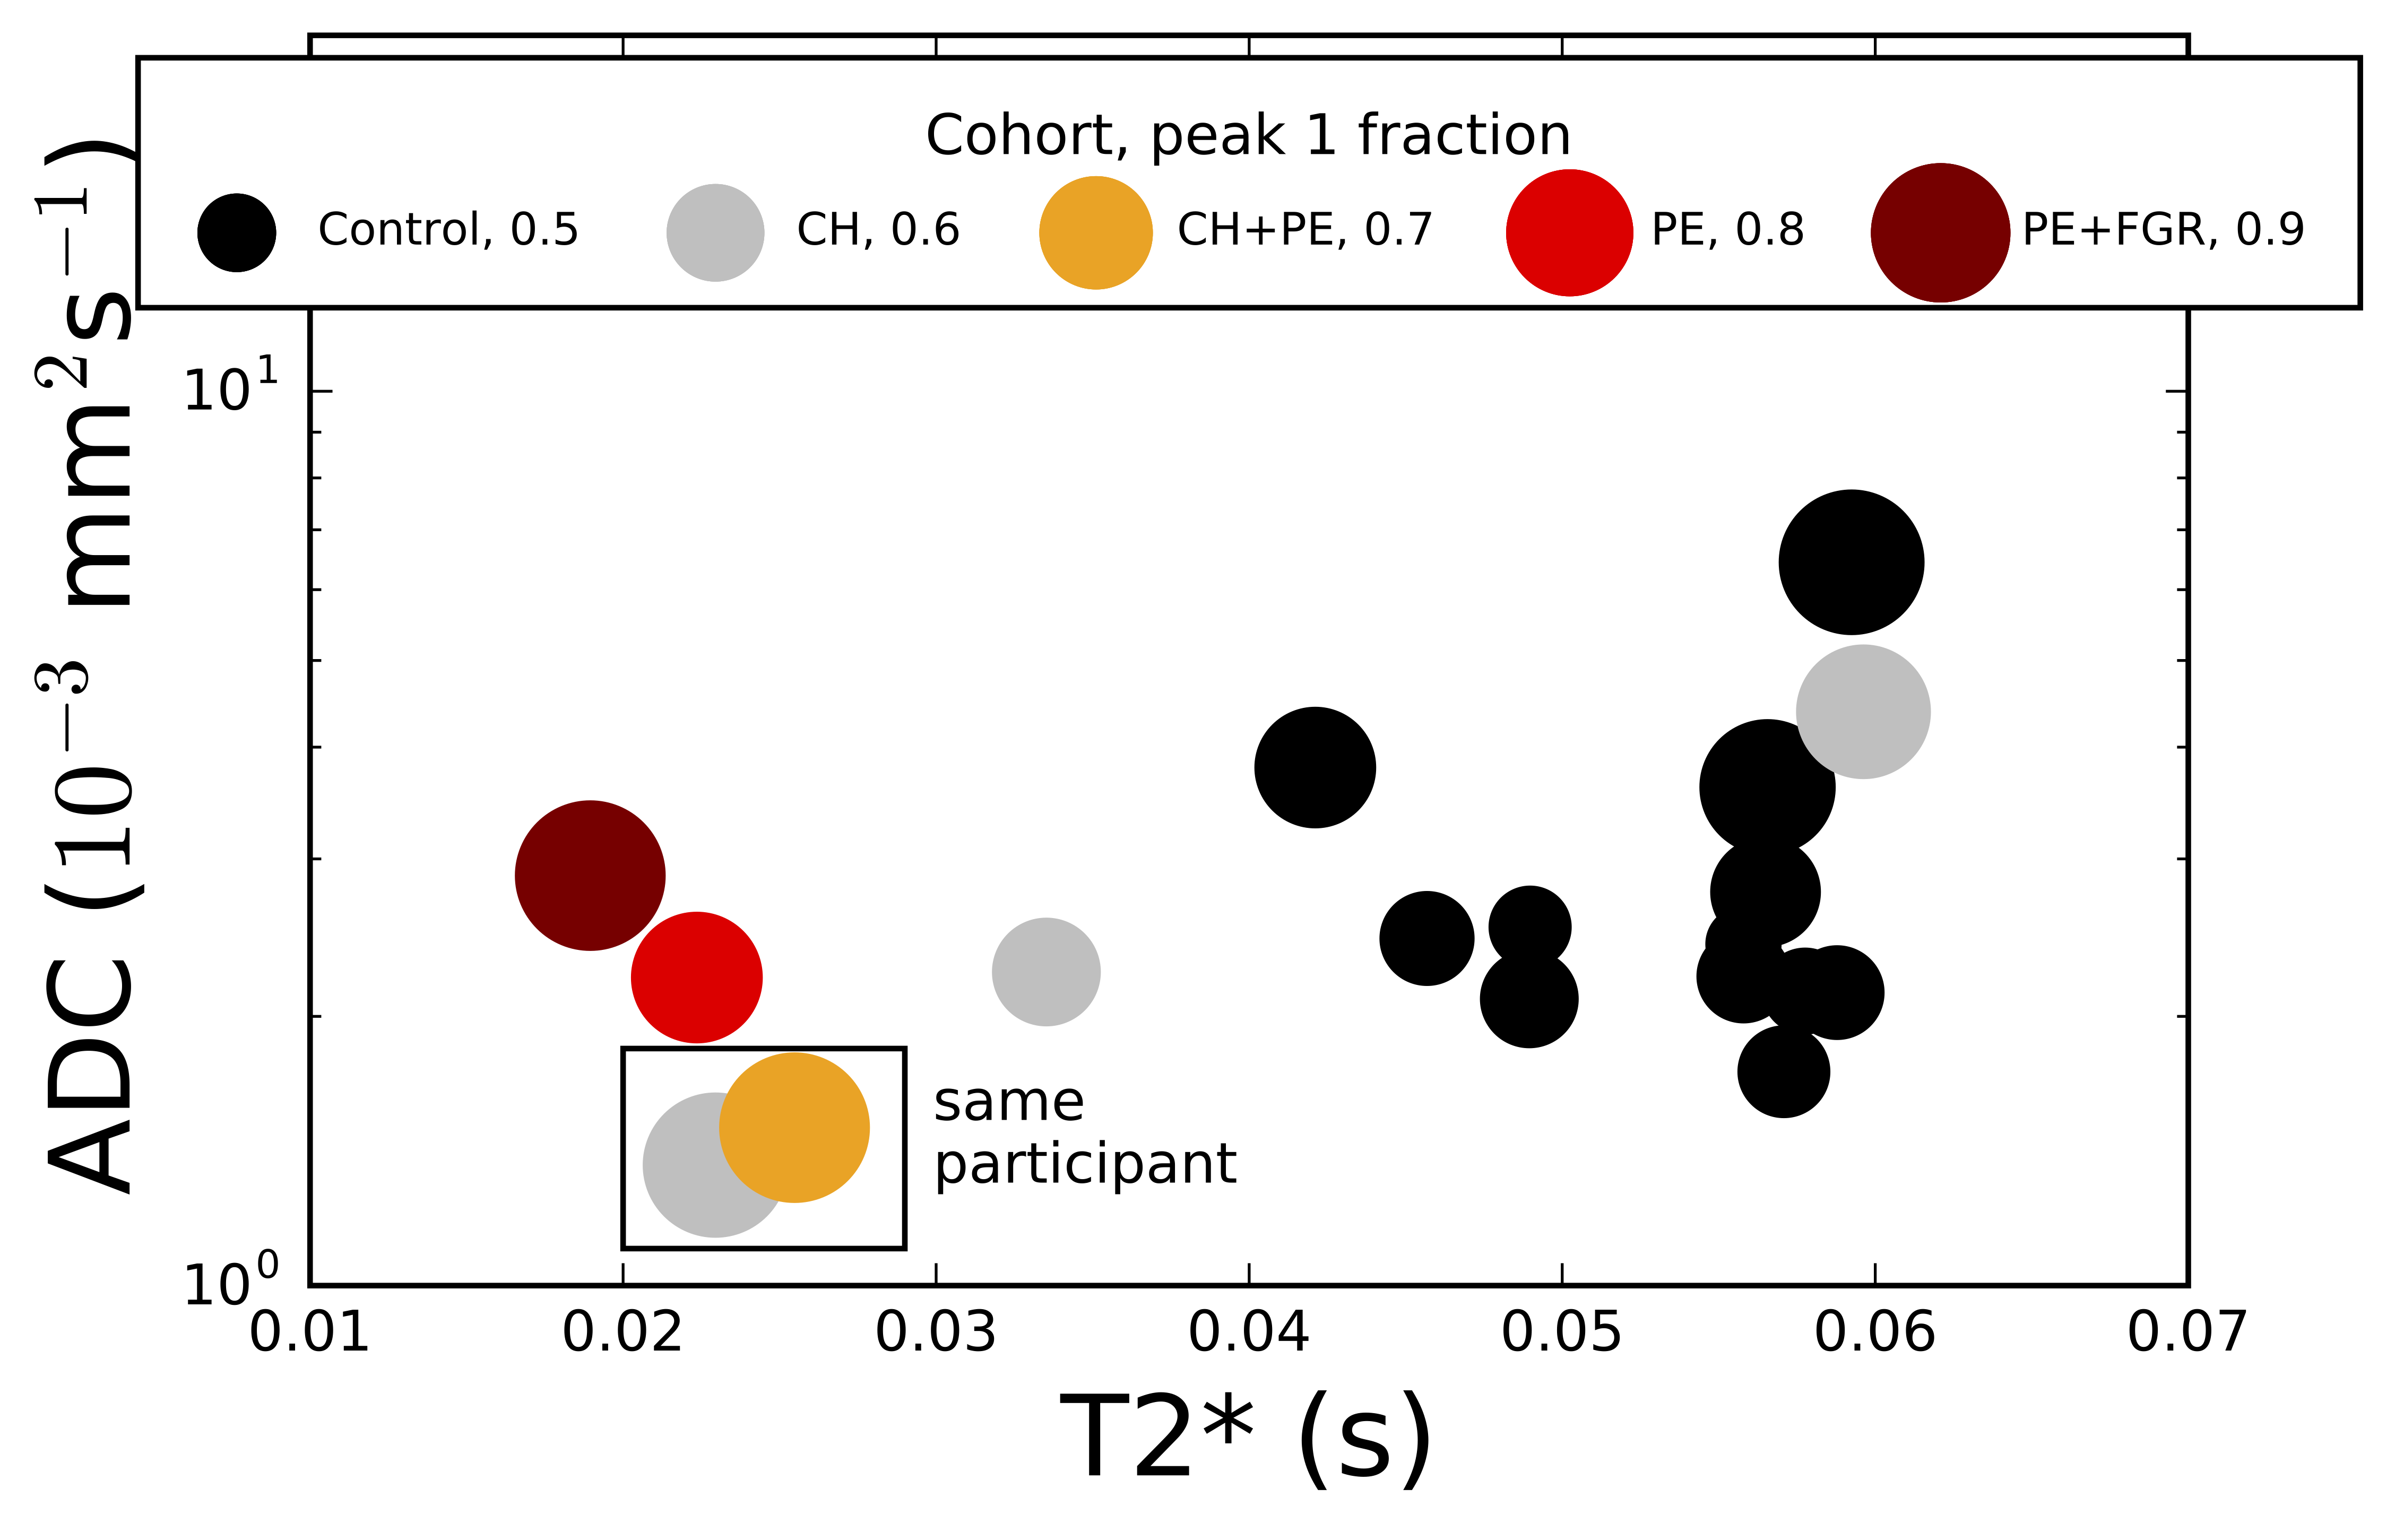
Figure 4 displays the ROI-averaged T2*-ADC spectra for all participants. There are three trends in the spectra which appear to discriminate between controls and placentas from women with pregnancy complications (PE, PE+FGR, PE+CH):
1. The disappearance of one (or both) of the middle and higher peaks.
2. Lower T2* in the lowest peak.
3. Lower ADC in the lowest peak.
Figure 5 presents the observed spectral changes in a single plot, showing separation between control participants and those with pregnancy complications, although we emphasise the small number of data points.
Discussion
This separation suggests that estimating the T2*-ADC spectrum is a promising method for evaluation of placentally-mediated pregnancy complications. The next step is to scan more participants to fully assess the discriminative power of the technique. We emphasise that the clinical potential of the technique is independent of biological interpretation. Nonetheless, we note that the appearance of three peaks clearly separated by ADC in all but one control placenta is consistent with each peak corresponding to a distinct tissue microenvironment. We speculatively assign compartments as follows: highest ADC - perfusing fetal blood; lowest ADC - water in tissue; intermediate ADC – transitioning fluid. The disappearance of the middle peak in PE cases could therefore reflect reduced maternal-fetal fluid exchange.Conclusion
The presented method for placental T2*-ADC spectrum estimation shows promise for quantitative assessment of pregnancy complications, and furthermore is immediately applicable to the study of other organs.Acknowledgements
We thank the midwives, obstetricians and radiographers who played a key role in obtaining the data sets. We would also like to thank all participating mothers. This work was supported by the following funders: National Institutes of Health (NIH) Human Placenta Project, Grant/Award Number: 1U01HD087202-01; Wellcome Trust (Sir Henry Wellcome Fellowship), Grant/Award Number: 201374/Z/16/Z; EPSRC, Grant/Award Numbers: N018702, M020533, EP/N018702/1; National Institute for Health Research (NIHR) Professorship (Chappell), Grant/Award Number: RP-2014-05-019; Tommy’s Charity and Holbeck Charitable Trust.References
1. Huen I, Morris DM, Wright C, Parker GJM, Sibley CP, Johnstone ED, et al. R1 and R2* changes in the human placenta in response to maternal oxygen challenge. Magn Reson Med. 2013;70: 1427–1433. doi:10.1002/mrm.24581
2. Sinding M, Peters DA, Poulsen SS, Frøkjær JB, Christiansen OB, Petersen A, et al. Placental baseline conditions modulate the hyperoxic BOLD-MRI response. Placenta. W.B. Saunders; 2018;61: 17–23. doi:10.1016/J.PLACENTA.2017.11.002
3. Moore RJ, Strachan BK, Tyler DJ, Duncan KR, Baker PN, Worthington BS, et al. In utero Perfusing Fraction Maps in Normal and Growth Restricted Pregnancy Measured Using IVIM Echo-Planar MRI. Placenta. 2000;21: 726–732. doi:10.1053/plac.2000.0567
4. Derwig I, Lythgoe DJ, Barker GJ, Poon L, Gowland P, Yeung R, et al. Association of placental perfusion, as assessed by magnetic resonance imaging and uterine artery Doppler ultrasound, and its relationship to pregnancy outcome. Placenta. Elsevier Ltd; 2013;34: 885–891. doi:10.1016/j.placenta.2013.07.006
5. Sohlberg S, Mulic-Lutvica A, Lindgren P, Ortiz-Nieto F, Wikström AK, Wikström J. Placental perfusion in normal pregnancy and early and late preeclampsia: A magnetic resonance imaging study. Placenta. Elsevier Ltd; 2014;35: 202–206. doi:10.1016/j.placenta.2014.01.008
6. Slator PJ, Hutter J, McCabe L, Gomes ADS, Price AN, Panagiotaki E, et al. Placenta microstructure and microcirculation imaging with diffusion MRI. Magn Reson Med. 2018;80: 756–766. doi:10.1002/mrm.27036
7. Hutter J, Slator PJ, Christiaens DC, Teixeira RPA, Roberts T, Jackson L, et al. Integrated and efficient diffusion-relaxometry using ZEBRA. Sci Rep. Springer US; 2018; 1–13. doi:10.1038/s41598-018-33463-2
8. Slator PJ, Hutter J, Ianuş A, Panagiotaki E, Rutherford M, Hajnal J V., et al. A framework for calculating time-efficient diffusion MRI protocols for anisotropic IVIM and an application in the placenta. 2018 MICCAI Workshop on Computational Diffusion MRI (CDMRI’18). 2018.
9. Hutter J, Slator P, Jackson L, Ho A, Dos Santos Gomes A, Price A, et al. Exploring placental function over gestation using multi-modal functional MRI. Proceedings of the Joint Annual Meeting ISMRM-ESMRMB 2018. 2018.
10. Kim D, Doyle EK, Wisnowski JL, Kim JH, Haldar JP. Diffusion-relaxation correlation spectroscopic imaging: A multidimensional approach for probing microstructure. Magn Reson Med. 2017;78: 2236–2249. doi:10.1002/mrm.26629
11. Benjamini D, Basser PJ. Magnetic resonance microdynamic imaging reveals distinct tissue microenvironments. Neuroimage. Elsevier Inc.; 2017; doi:10.1016/j.neuroimage.2017.09.033 12. Does MD. MERA Toolbox, Version 2 [Internet]. Available: https://github.com/markdoes/MERA
Figures