0064
Temporal Diffusion Ratio (TDR): A Diffusion MRI technique to map the fraction and spatial distribution of large axons in the living human brain1NatBrainLab, King's College London, London, United Kingdom, 2Department of Physics and Geology, University of Perugia, Perugia, United Kingdom, 3CUBRIC, Cardiff University, Cardiff, United Kingdom
Synopsis
This work presents a new approach to mapping the fraction and spatial distribution of large axons (d>3μm) across white matter (WM) in the living human brain. By collecting high b-value (b=8000 s/mm2) diffusion MRI data at two diffusion times on a Connectome scanner, we were able to generate a new contrast specific to the characteristic signal decay of large axons at different diffusion times. Using this approach, we were able to identify and discriminate consistently some of the major WM pathways expected to carry the largest axons within the human brain. WM characterisation using TDR can offer important and practical clinical applications.
Introduction
Recent studies have shown that a power-law scaling of the diffusion MR signal emerges at b-values higher than 7000 s/mm2 in white matter regions1-2. This finding directly implies that the diffusion signal at very high b-values can be assumed to originate entirely from intra-axonal contributions fully described by the "stick" model (i.e., diffusion within an infinitely narrow cylinder) and, at the same time, any extra-axonal signal contribution can be considered completely suppressed.
However, deviation from the stick model has been observed for axons with diameters larger than ~2 μm when using high performance diffusion gradient systems3,4. These results suggest that the diffusion signal can become sensitive to large axonal diameters representing the right tail of the axonal diameter distribution. Histological studies of the human brain show that the vast majority of axons are below 1um in diameter5,6. Nevertheless, numerical simulations based on realistic axonal diameter distributions have also shown that even a relatively small fraction of large axons (e.g. less than 1% of axons > 3μm) can still contribute substantially to the total intra-axonal space (e.g. 20-30% or more)7 and the overall diffusion signal4.
In this work we have focused our attention on quantifying the fraction of the diffusion signal originating from large axons. More precisely, we tried to quantify the signal contribution coming only from the right tail of the axonal diameter distribution where the stick model assumption is no longer valid. Using HARDI acquisitions collected at the same high b-value but at two different diffusion times, we calculate a novel Temporal Diffusion Ratio (TDR) in a similar fashion to the commonly used Magnetisation Transfer ratio (MTR)8. Here, we report results from in vivo data acquired in healthy subjects using the Connectom scanner at CUBRIC, Cardiff University, UK.
Methods
As in MTR imaging, the TDR index can be expressed as:
TDR = (ALong-Dt - AShort-Dt) / ALong-Dt
where ALong-Dt and AShort-Dt are respectively the long- and short-diffusion time HARDI signals normalised to their corresponding non-diffusion weighted signal and spherical-averaged to remove directional dependence. Diffusion MRI brain data from 4 healthy volunteers were acquired on a Siemens 3T Connectom scanner using an HARDI protocol with TE=80ms, TR=3900ms, MB=2, isotropic voxel size of 2.5mm, 60 diffusion directions and 4 interleaved b0s. Acquisition parameters were chosen to maintain a constant b-value of 8000 s/mm2 with G=162.9mT/m, δ=9ms, Δ=55ms for the Long-Diffusion time, and G=276.89mT/m, δ=9ms, Δ=21ms for the Short-Diffusion time experiment. To maximise SNR and account for susceptibility distortions, each scan was repeated 4 times with alternating EPI-PE directions.Processing: The acquired data were de-noised9 and corrected for Gibbs ringing10, motion, susceptibility, eddy-current distortions11, b0-drifts12 and rigidly aligned between the two diffusion times. To minimise noise amplification and any remaining registration error, before computing the final TDR maps, each ALong-Dt and AShort-Dt volume was smoothed with a 2mm kernel.
Results
Figure 1 shows the simulated signal decays for the two diffusion times and for increasing axonal radii. Both diffusion models show that signal profiles for axon diameters > 2.5/3μm clearly diverge for the two diffusion times producing a contrast for large axons.
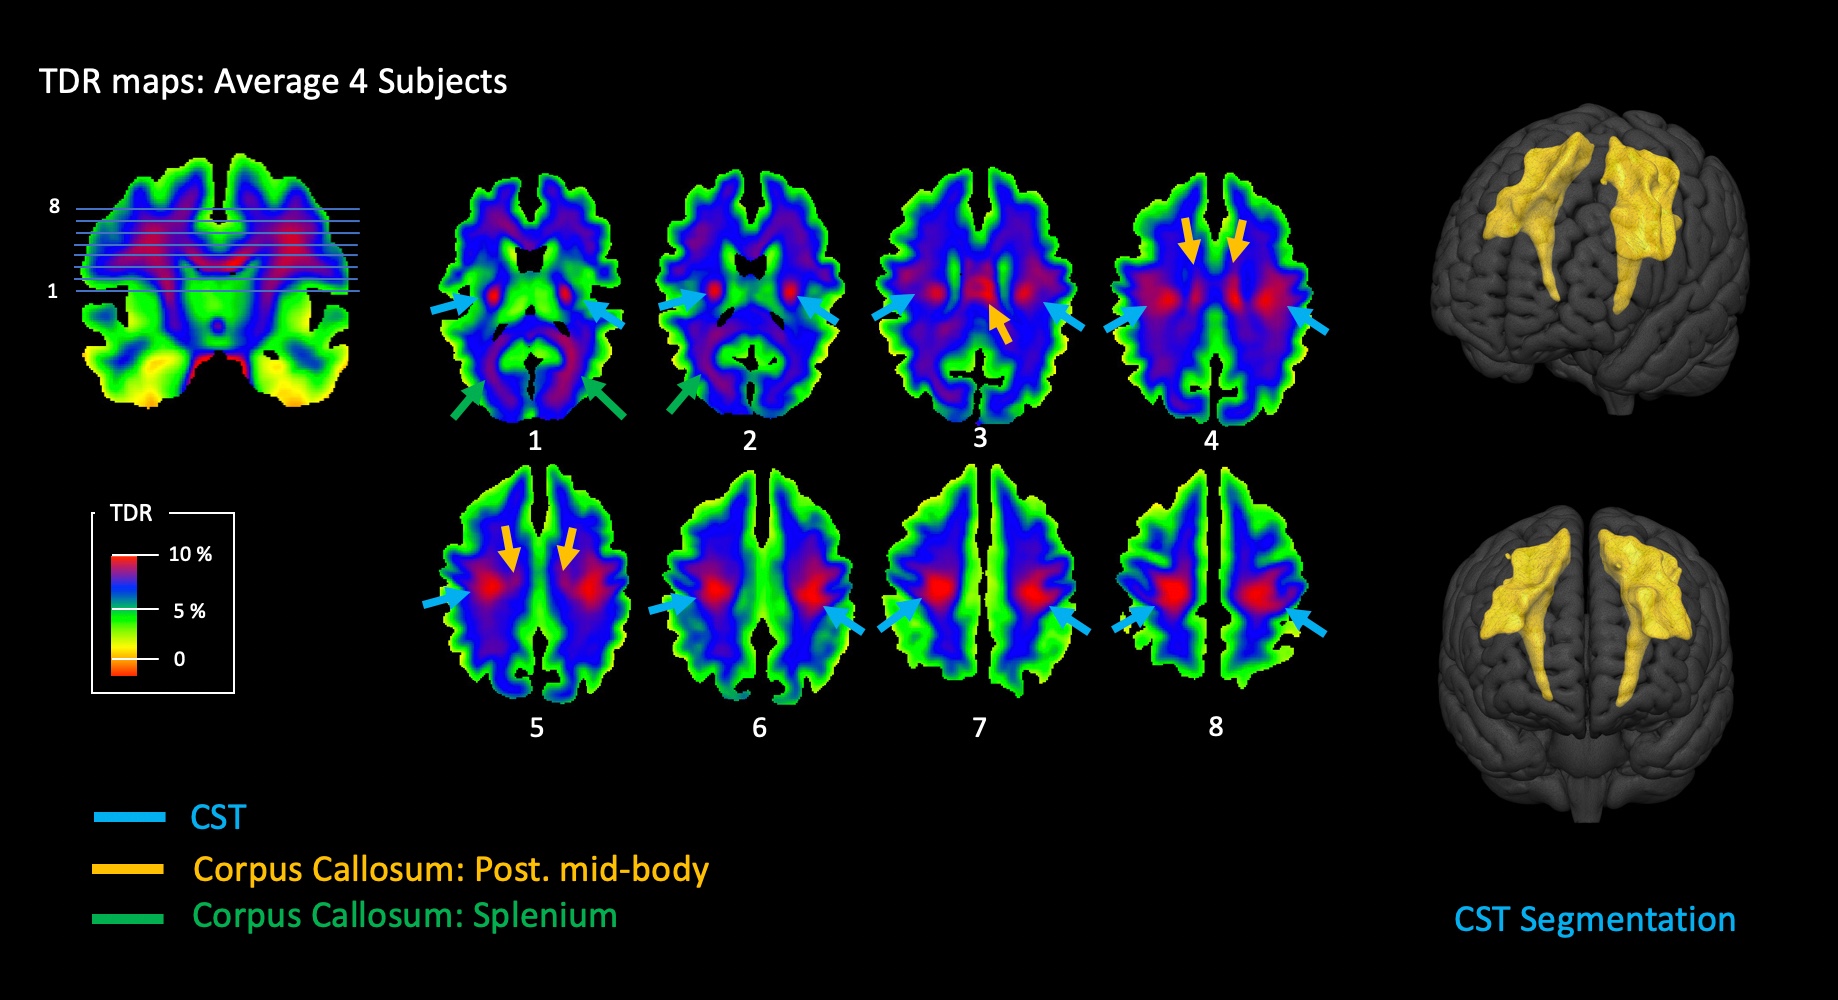
Figure 2 and 3 shows TDR maps in a single healthy human brain and in an average of 4 brains. As expected, the cortico-spinal tract (CST) which carries the pyramidal tracts15 shows the highest fraction of large axons. The full anatomical profile of the CST, including the lateral fanning to the ventral "mouth" region can be visualised without using any directional information from the diffusion signal. Similarly, the posterior mid-body of the corpus callosum (CC) shows a relatively higher fraction of large axons that consistently propagate from the mid-sagittal plane to the corresponding motor cortex, bi-laterally. To a lesser degree, portions of the splenium reaching visual cortex also show increased TDR contrast. Results were reproducible across all subjects. A semi-automatic 3D segmentation of the whole CST based on TDR thresholding is shown is figure 3, on the right.
Discussion and Conclusions
TDR maps provide a simple and effective way to map the spatial distribution and relative signal fraction of large axons in the living human brain. This approach could provide a new imaging contrast with important clinical and neuroscience applications. For instance, neurosurgical planning involving the CST may benefit from TDR maps to overcome most of the existing limitation of tractography. TDR maps may also serve as a new biomarker of development, degeneration and plasticity, specifically targeting the largest and fastest axons in the human brain. Future works will extend the TDR framework from a single- to a multiple-fibre approach, integrating with spherical deconvolution and tract-specific metrics.Acknowledgements
FDA, RD, MC are supported by the Sackler Institute for Translational Neurodevelopment, King's College London. MC, AB, DKJ are supported by the Wellcome Trust. The data were acquired at the UK National Facility for In Vivo MR Imaging of Human Tissue Microstructure funded by the EPSRC (grant EP/M029778/1).
References
1 Veraart, J., Fieremans, E., Novikov, D.S., On the scaling behavior of water diffusion in human brain white matter, NeuroImage, in press (2018) doi: https://doi.org/10.1016/ j.neuroimage.2018.09.075.
2 C. D. Kroenke, J. J. Ackerman, and D. A. Yablonskiy, “On the nature of the NAA diffusion attenuated MR signal in the central nervous system,” Magnetic resonance in medicine 52, 1052–1059 (2004).
3 Jones, D. K., Alexander, D. C., Bowtell, R., Cercignani, M., Dell’Acqua, F., McHugh, D. J., Miller, K.L., Palombo, M., Parker, G.J.M., Rudrapatna, U.S. C.M.W.Tax, (2018). Microstructural imaging of the human brain with a ‘super-scanner’: 10 key advantages of ultra-strong gradients for diffusion MRI. NeuroImage, 182, 8–38.
4 Jelle Veraart, Els Fieremans, Umesh Rudrapatna, Derek K Jones, and Dmitry S Novikov Breaking the power law scaling of the dMRI signal on the Connectom scanner reveals its sensitivity to axon diameters, Proc. Intl. Soc. Mag. Reson. Med. 26 (2018) 0252
5 F. Aboitiz, A. B. Scheibel, R. S. Fisher, and E. Zaidel, “Fiber composition of the human corpus callosum,” Brain research 598, 143– 153 (1992).
6 R. Caminiti, H. Ghaziri, R. Galuske, P. R. Hof, and G. M. Innocenti, “Evolution amplified processing with temporally dispersed slow neuronal connectivity in primates,” Proceedings of the National Academy of Sciences 106, 19551–19556 (2009).
7 Andrea Chiappiniello, Valentina Reggioli, Roberto Tarducci, Marco Catani, Flavio Dell’Acqua. Axonal distributions: A simulation study to estimate Diffusion MRI signal contributions in white matter, Proc. Intl. Soc. Mag. Reson. Med. 26 (2018) 5250.
8 Henkelman, R. M., Stanisz, G. J., & Graham, S. J. (2001). Magnetization transfer in MRI: A review. NMR in Biomedicine, 14(2), 57–64.
9 J. Veraart, D.S. Novikov, D. Christiaens, B. Ades-Aron, J. Sijbers, and E. Fieremans, Denoising of diffusion MRI using random matrix theory. NeuroImage, 142, 394-406 (2016).
10 E. Kellner, B. Dhital, V. G. Kiselev, and M. Reisert, “Gibbs-ringing artifact removal based on local subvoxel-shifts,” Magnetic resonance in medicine 76, 1574–1581 (2016).
11 J. L. Andersson and S. N. Sotiropoulos, “An integrated approach to correction for off- resonance effects and subject movement in diffusion MR imaging,” Neuroimage 125, 1063–1078 (2016).
12 Vos, S. B., Tax, C. M. W., Luijten, P. R., Ourselin, S., Leemans, A., & Froeling, M. (2017). The importance of correcting for signal drift in diffusion MRI. Magnetic Resonance in Medicine, 77(1), 285–299.
13 P. van Gelderen, D. DesPres, P. van Zijl, and C. Moonen, “Evaluation of restricted diffusion in cylinders. phosphocreatine in rabbit leg muscle,” Journal of Magnetic Resonance, Series B 103, 255–260 (1994).
14 Grebenkov D (2007): Multiple correlation function approach: Rigorous results for simple geometries. Diff Fundam 5:1–34.
15 Hall, Arthur C. Guyton, John E. (2005). Textbook of medical physiology (11th ed.). Philadelphia: W.B. Saunders. pp. 687–690
Figures
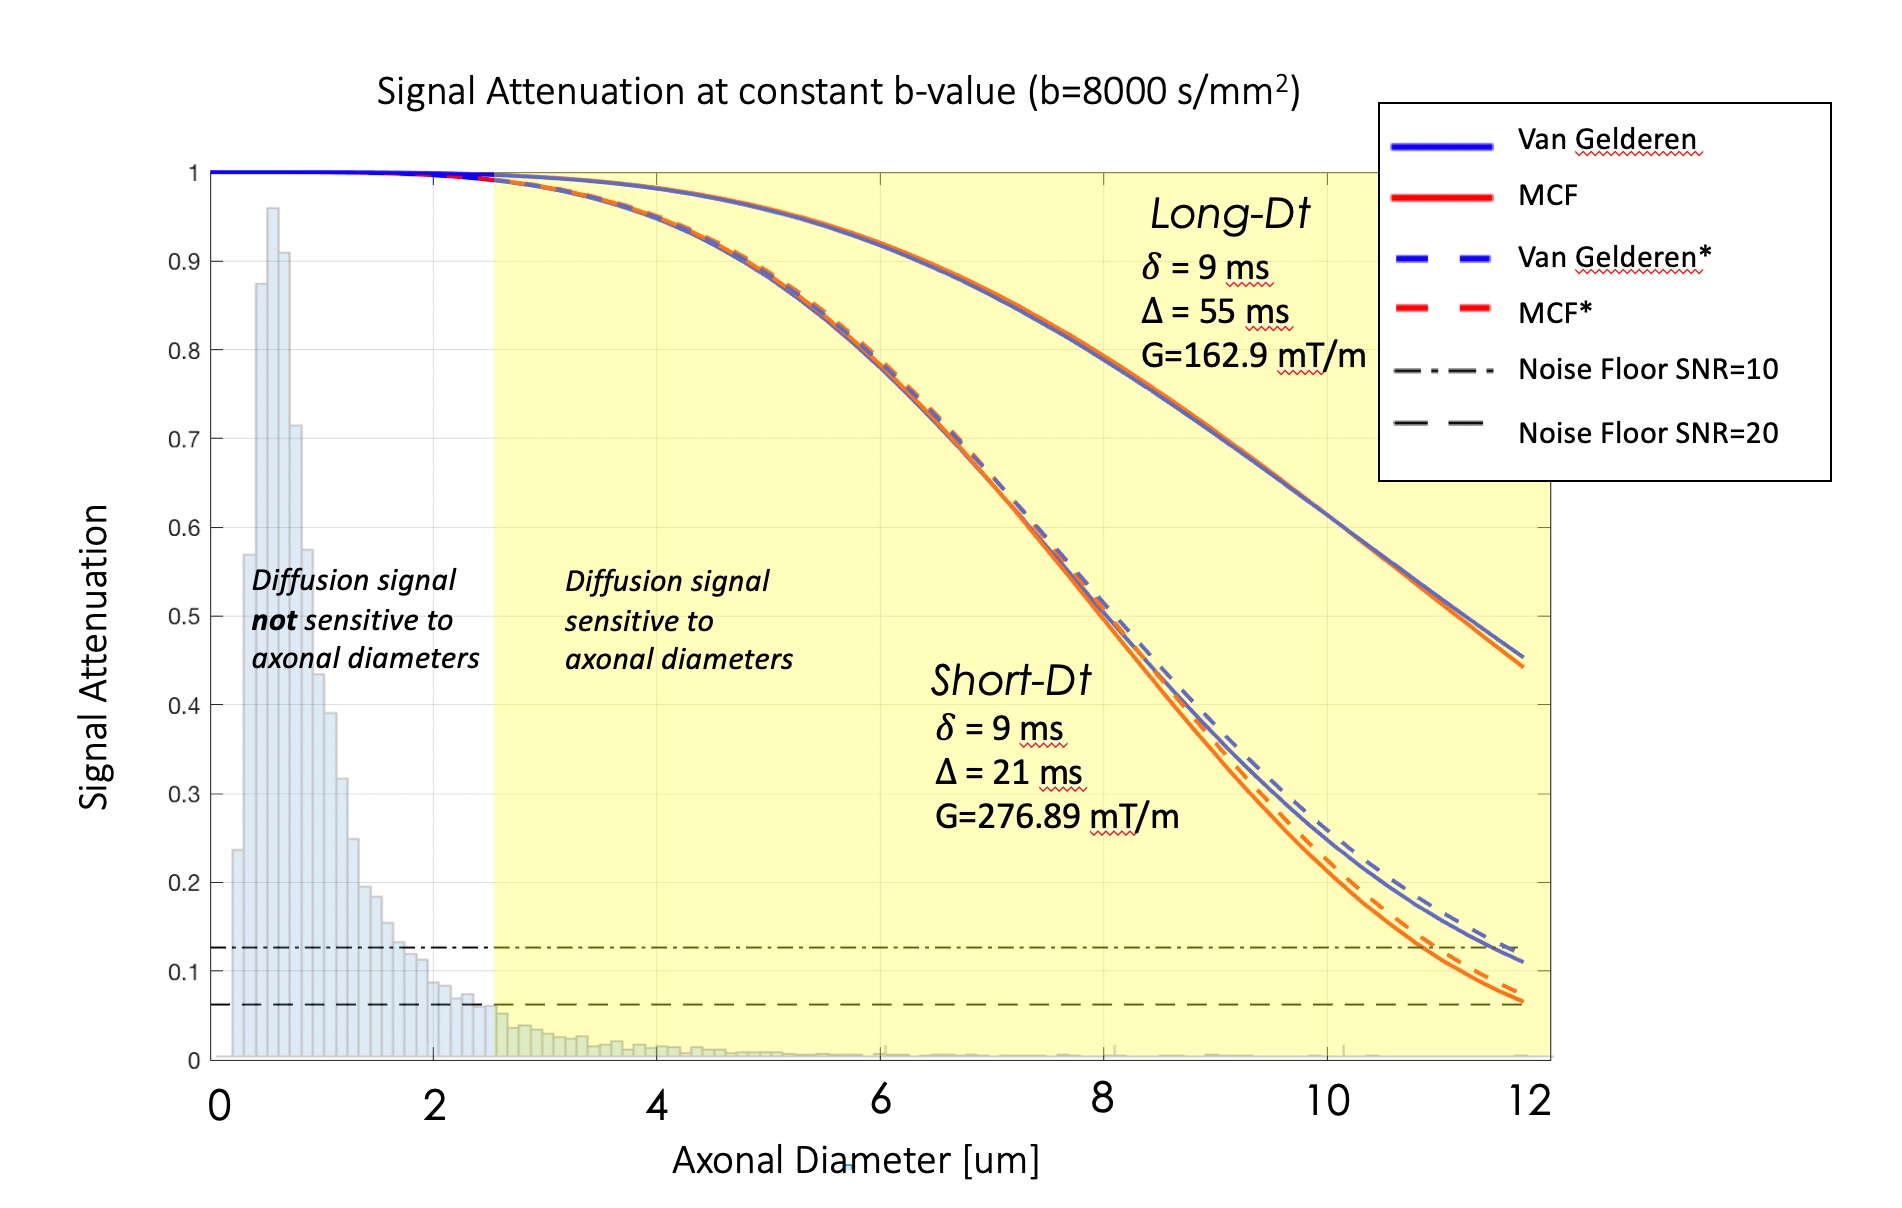
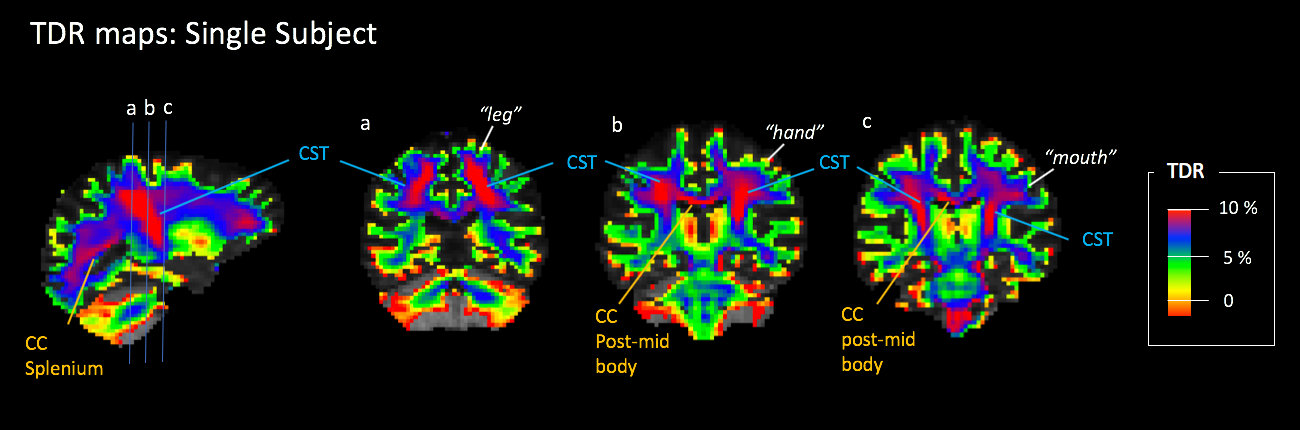
Figure 2 shows the TDR map on a single representative subject. In these maps the main anatomy of the CST, the posterior mid-body and splenium is visible and the corresponding pathways can be identified and followed at the single-subject level. In line with the previous literature5,6,15 these tracts exhibit the largest fraction of axons with a diameter greater than 3μm.