0062
Tangential and radial diffusion in human primary somatosensory and motor cortex: evidence from in-vivo line-scan acquisitions at 7T with 250–500 micron radial resolution1Harvard Medical School, Boston, MA, United States, 2Department of Radiology, Boston Children's Hospital, Boston, MA, United States, 3Department of Radiology, Brigham and Women's Hospital, Boston, MA, United States, 4Department of Radiology, Sahlgrenska Academy, Gothenburg University, Gothenburg, Sweden, 5Athinoula A. Martinos Center for Biomedical Imaging, Department of Radiology, Massachusetts General Hospital, Charlestown, MA, United States, 6Harvard-MIT Division of Health Sciences and Technology, Massachusetts Institute of Technology, Cambridge, MA, United States
Synopsis
Eight healthy volunteers were scanned at 7T using a line-scan diffusion sequence with each line prescribed perpendicularly to primary somatosensory (S1) and motor (M1) cortex, and with 250–500 micron resolution along the line. We observed tangential diffusion in S1 and radial diffusion in M1, consistent with prior reports, but with the high radial resolution used here enabling us to identify the deep layers of S1—where high diffusion anisotropy was seen—as the source of the tangential diffusion, with low anisotropy in the upper layers. In M1, radial diffusion with moderate anisotropy was seen at nearly all cortical depths.
Purpose
Cortical gray matter exhibits far greater structural variation radially (i.e., perpendicular to the cortical sheet) than tangentially[1,2]. This suggests a strategy of choosing small voxel sizes in the radial direction in order to interrogate this structure, with larger voxel sizes in the tangential directions chosen to provide adequate signal-to-noise ratio[3–5]. The goal of this study was to measure cortical diffusion in vivo at 7T using the line-scan technique[6–8] to obtain radial voxel sizes down to 0.25 mm, resulting in spatial resolution that is hard to achieve with standard single-shot EPI acquisitions, in order to probe cortical laminar architecture.Methods
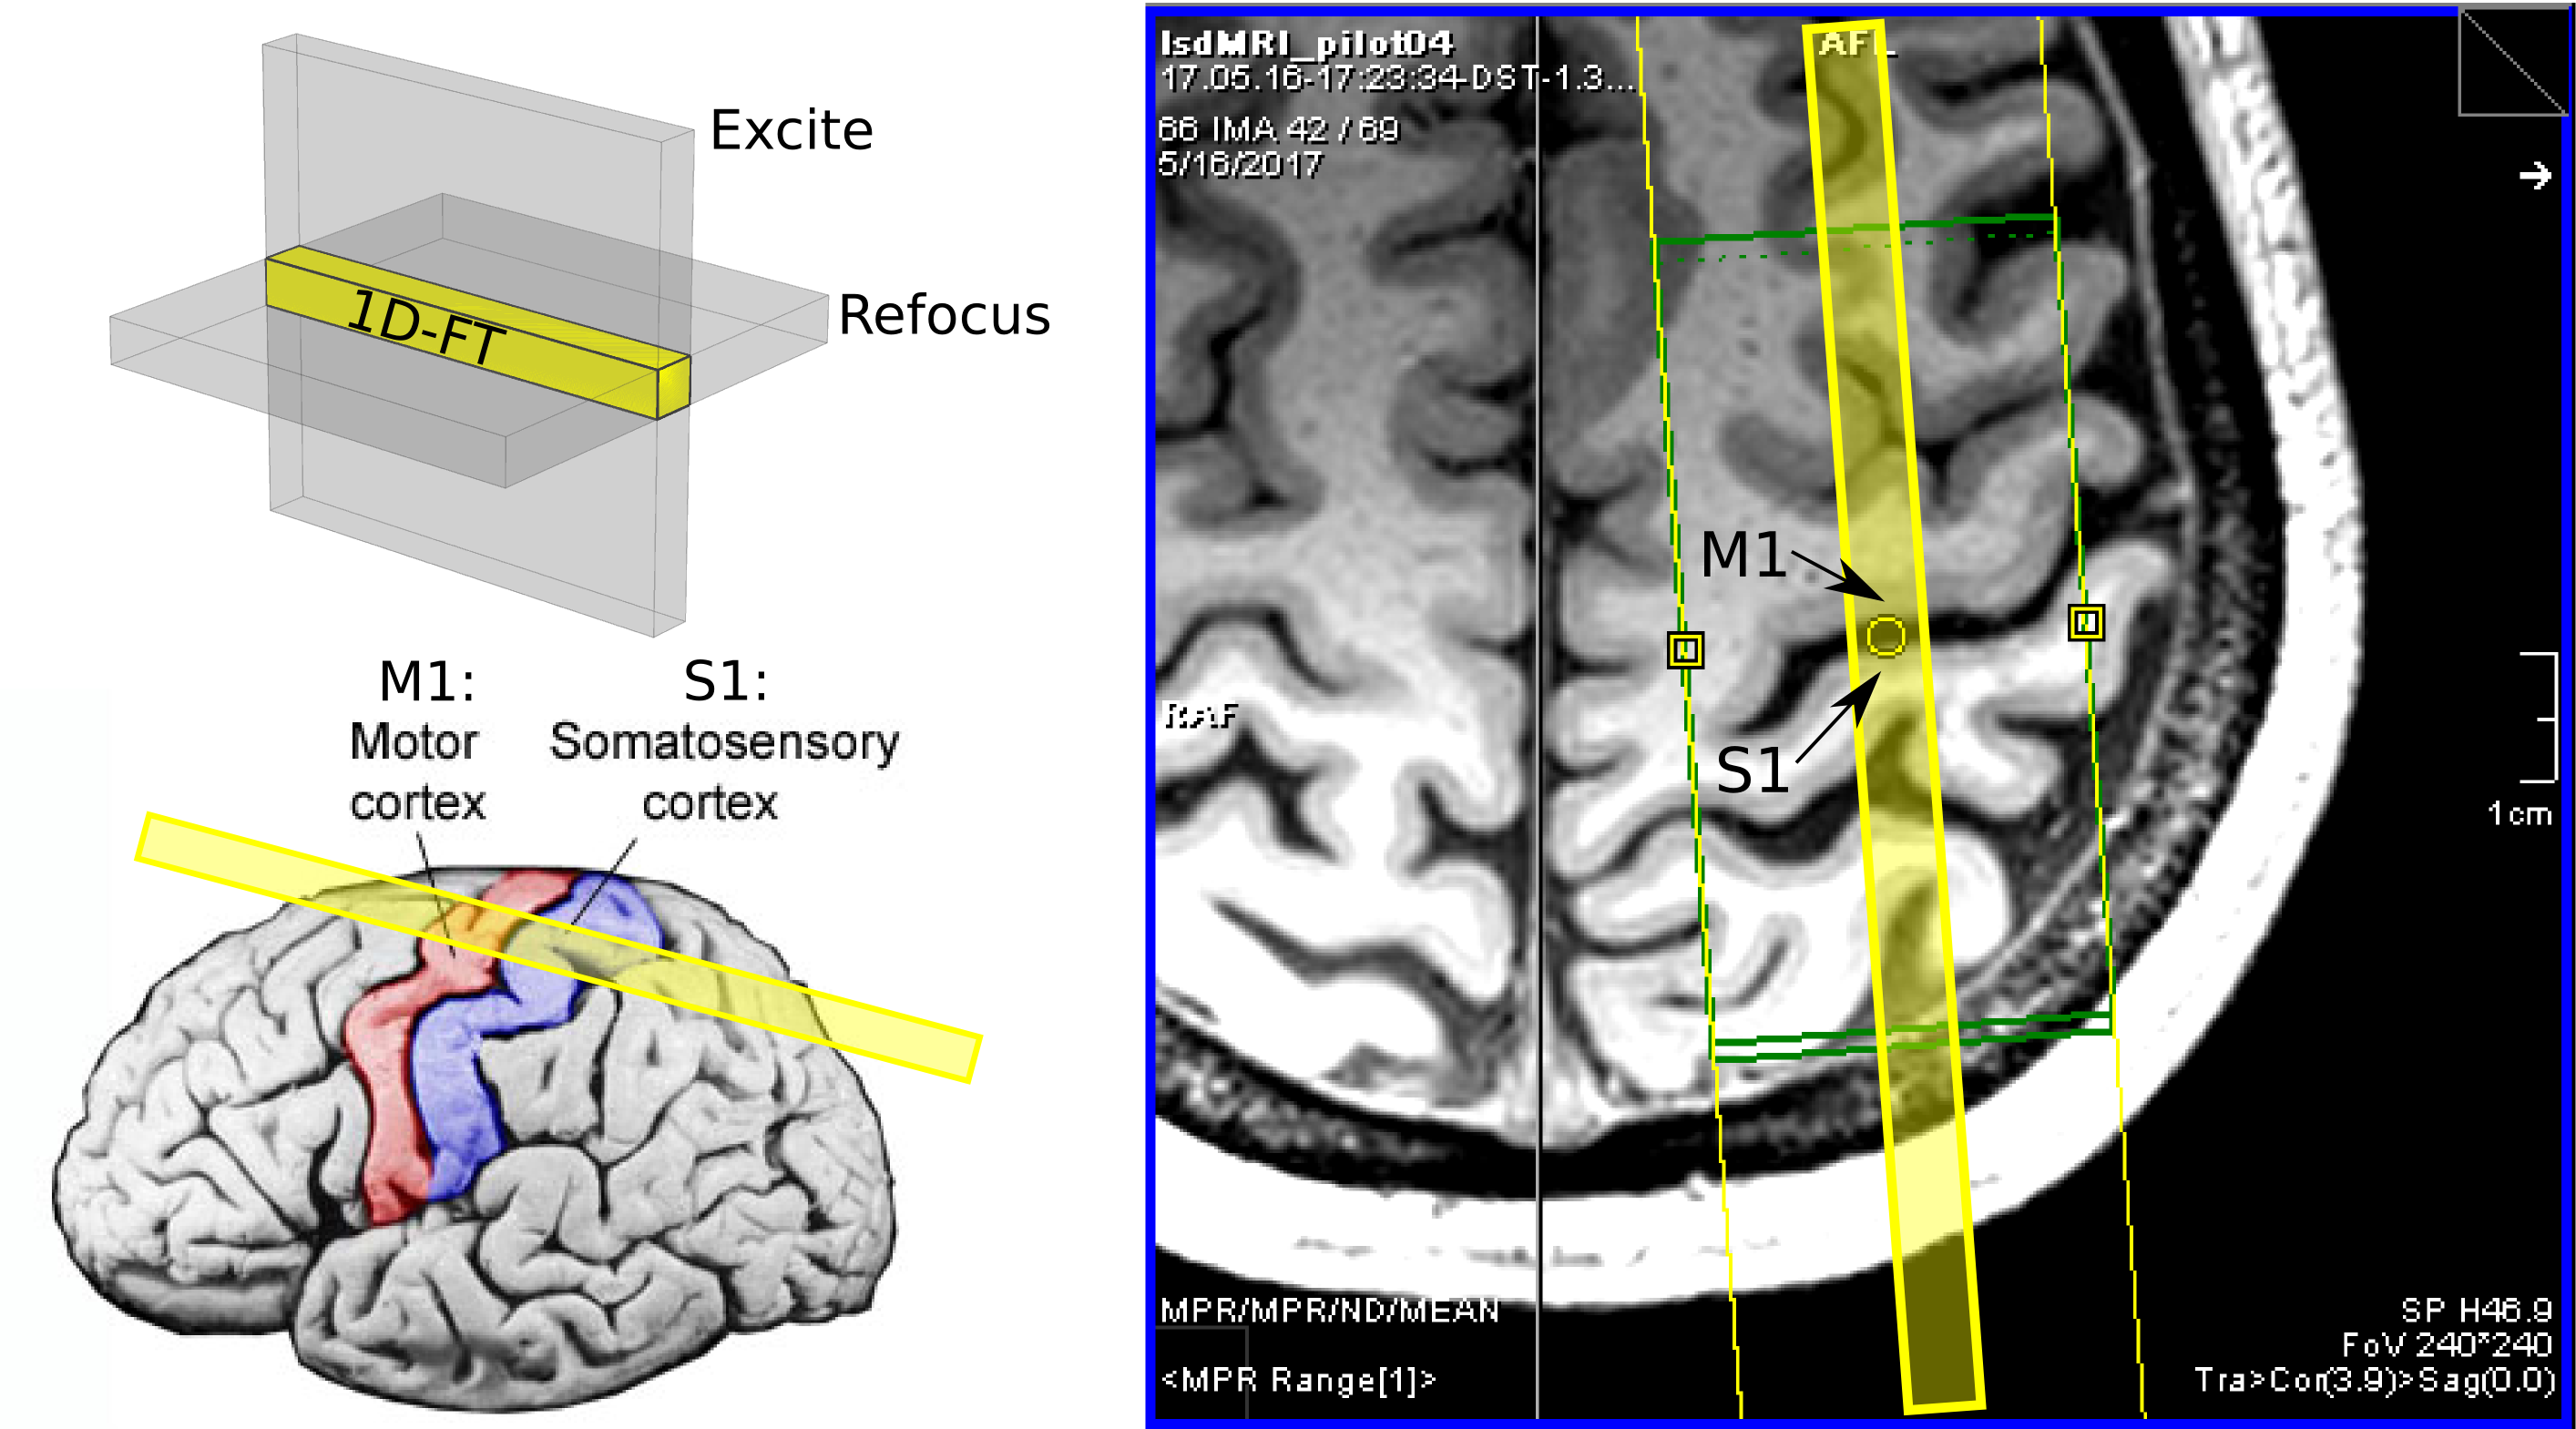
Eight healthy volunteers (6F/2M, ages: 22–30 years), having given informed consent, were scanned on a Siemens 7T whole-body scanner using a custom-built 31-channel head receive coil and birdcage transmit coil. On each volunteer, a 0.75×0.75×0.75 mm3 FOCI-ME-MPRAGE scan[9] was acquired and used as the anatomical localizer for subsequent line-scan diffusion acquisitions[7,8], with each line prescribed as perpendicularly as possible to primary somatosensory cortex S1 and primary motor cortex M1 (Fig. 1). The parameters common to all line-scan acquisitions were as follows: TR/TE = 2000/50 ms, BW ≈ 100 Hz/pixel and 19 b-values equally spaced from 100 to 1000 s/mm2. The voxel size along the line was either 250 or 500 μm, with a 256 mm readout field-of-view and nominal line thickness of 3 mm. Three variants of the line-scan acquisitions were employed: (i) “3dir-250μm” (volunteers 1–7), with three diffusion directions, one in the radial direction (i.e., parallel to the line) and two tangential directions perpendicular to the line and to each other, at 250-μm radial resolution (four repetitions, TA = ~8 minutes), (ii) “13dir-500μm” (volunteers 4–6), with an additional ten diffusion directions approximately uniformly distributed on the unit hemisphere, at 500-μm radial resolution (one repetition, TA = ~9 minutes) and (iii) “13dir-250μm” (volunteers 3, 6 and 8), with the thirteen directions as above, but at 250-μm radial resolution (three repetitions, TA = ~27 minutes).
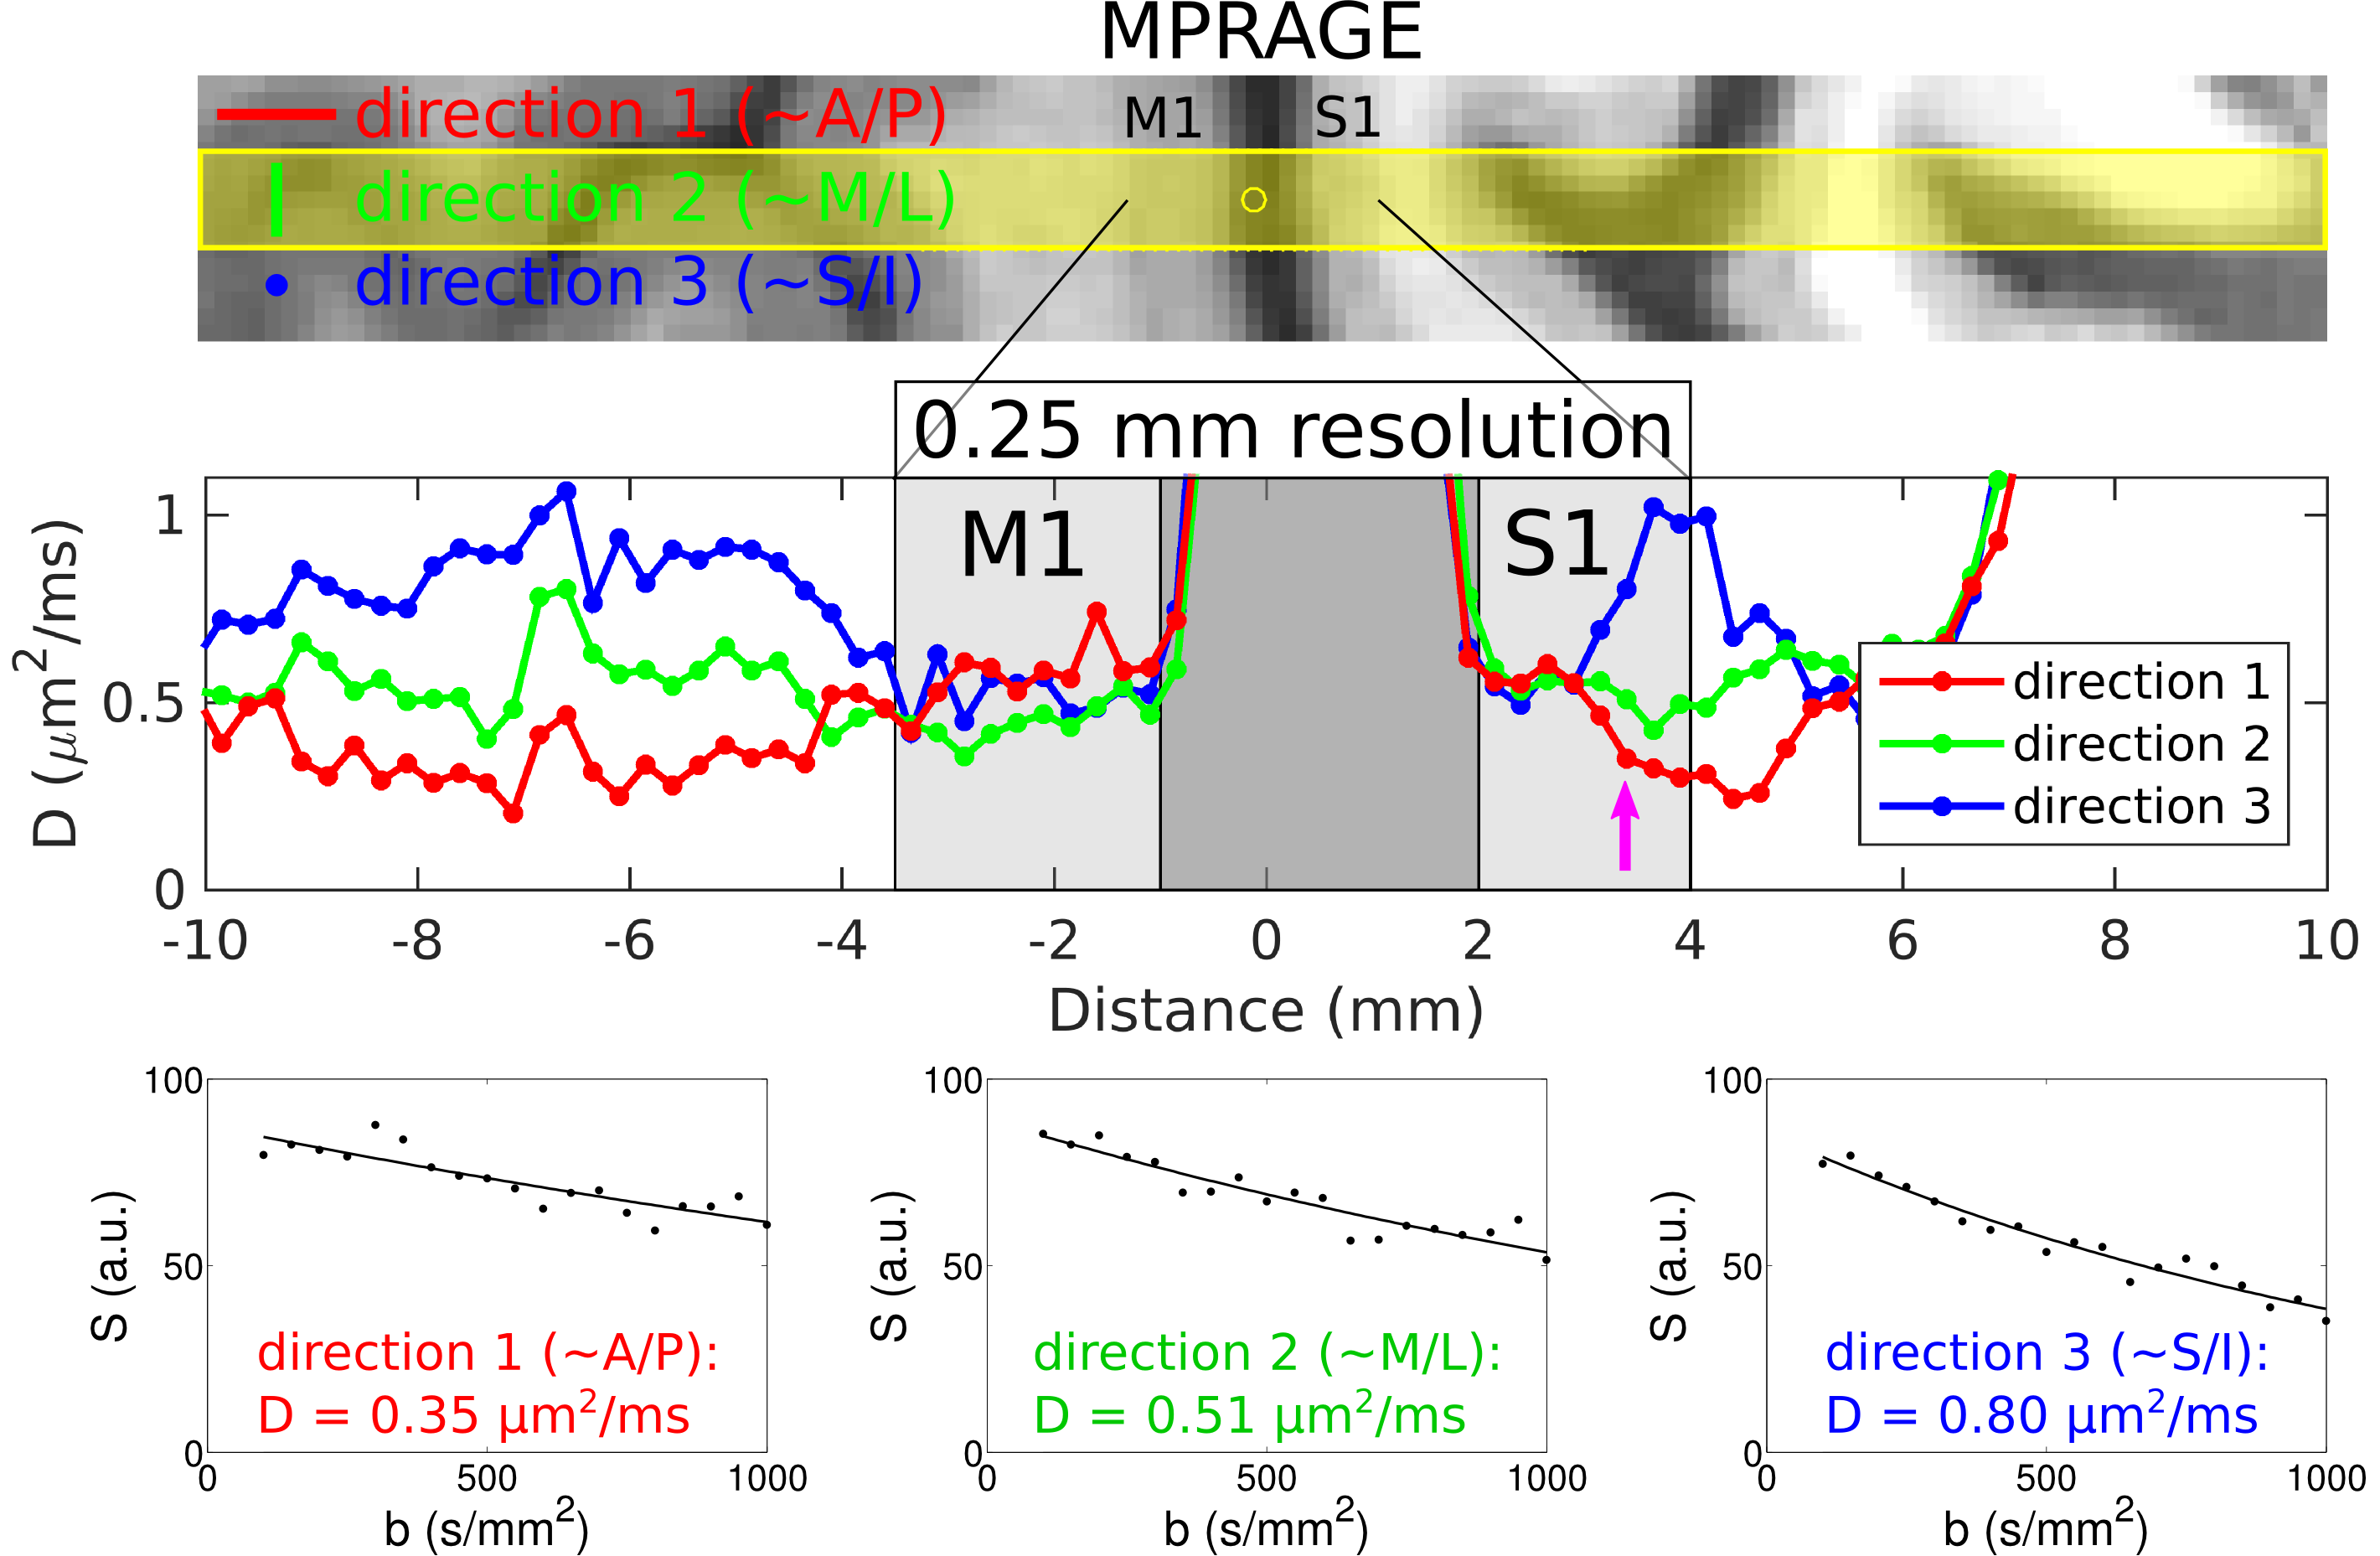
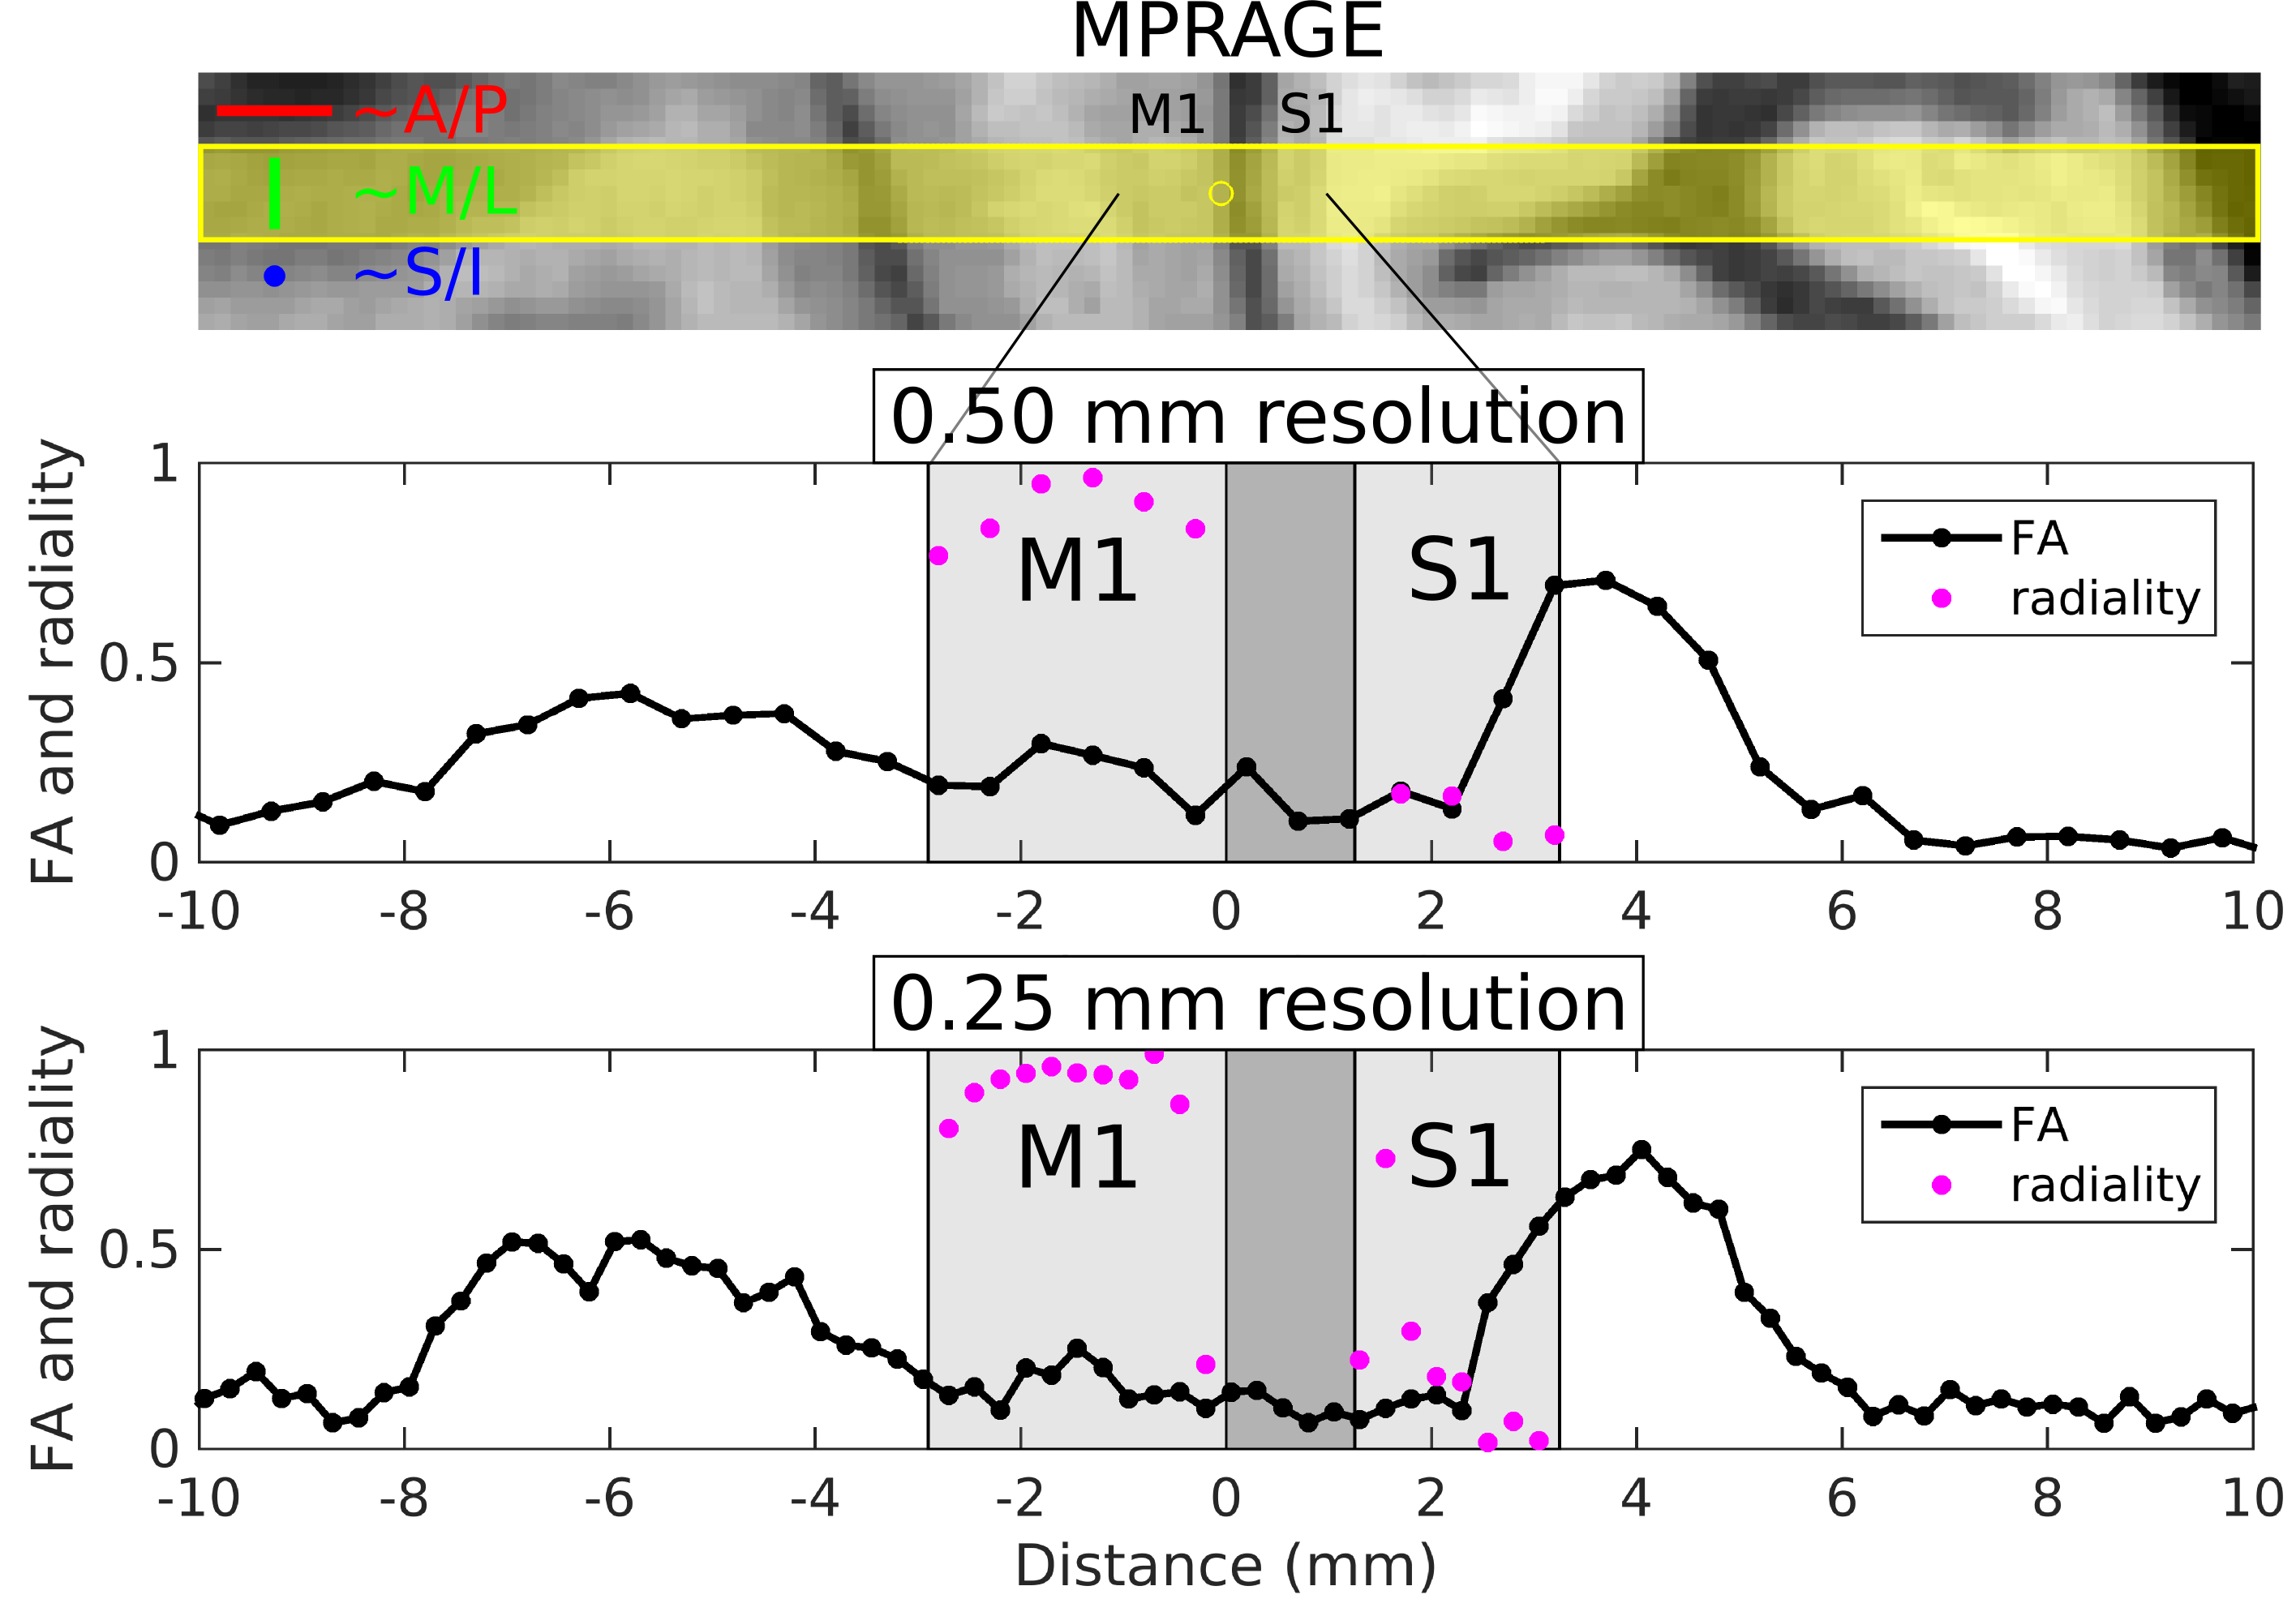
For signal reconstruction, phase-corrected complex-valued signals were averaged across repetitions prior to root-sum-of-squares coil combination[5]. For the 3dir-250μm data, the monoexponential model was then fitted per-voxel and per-direction to the resulting signal versus b-value, yielding an apparent diffusion coefficient for each direction. For the 13dir-500μm and 13dir-250μm data, per-voxel fits to the (single) tensor model were performed. Fractional anisotropy[10] (FA) and “radiality” measures were then derived, where radiality is defined as the cosine of the angle between the diffusion tensor primary eigenvector and the cortical surface normal, defined only for voxels with FA≥0.05[11,12].
Results
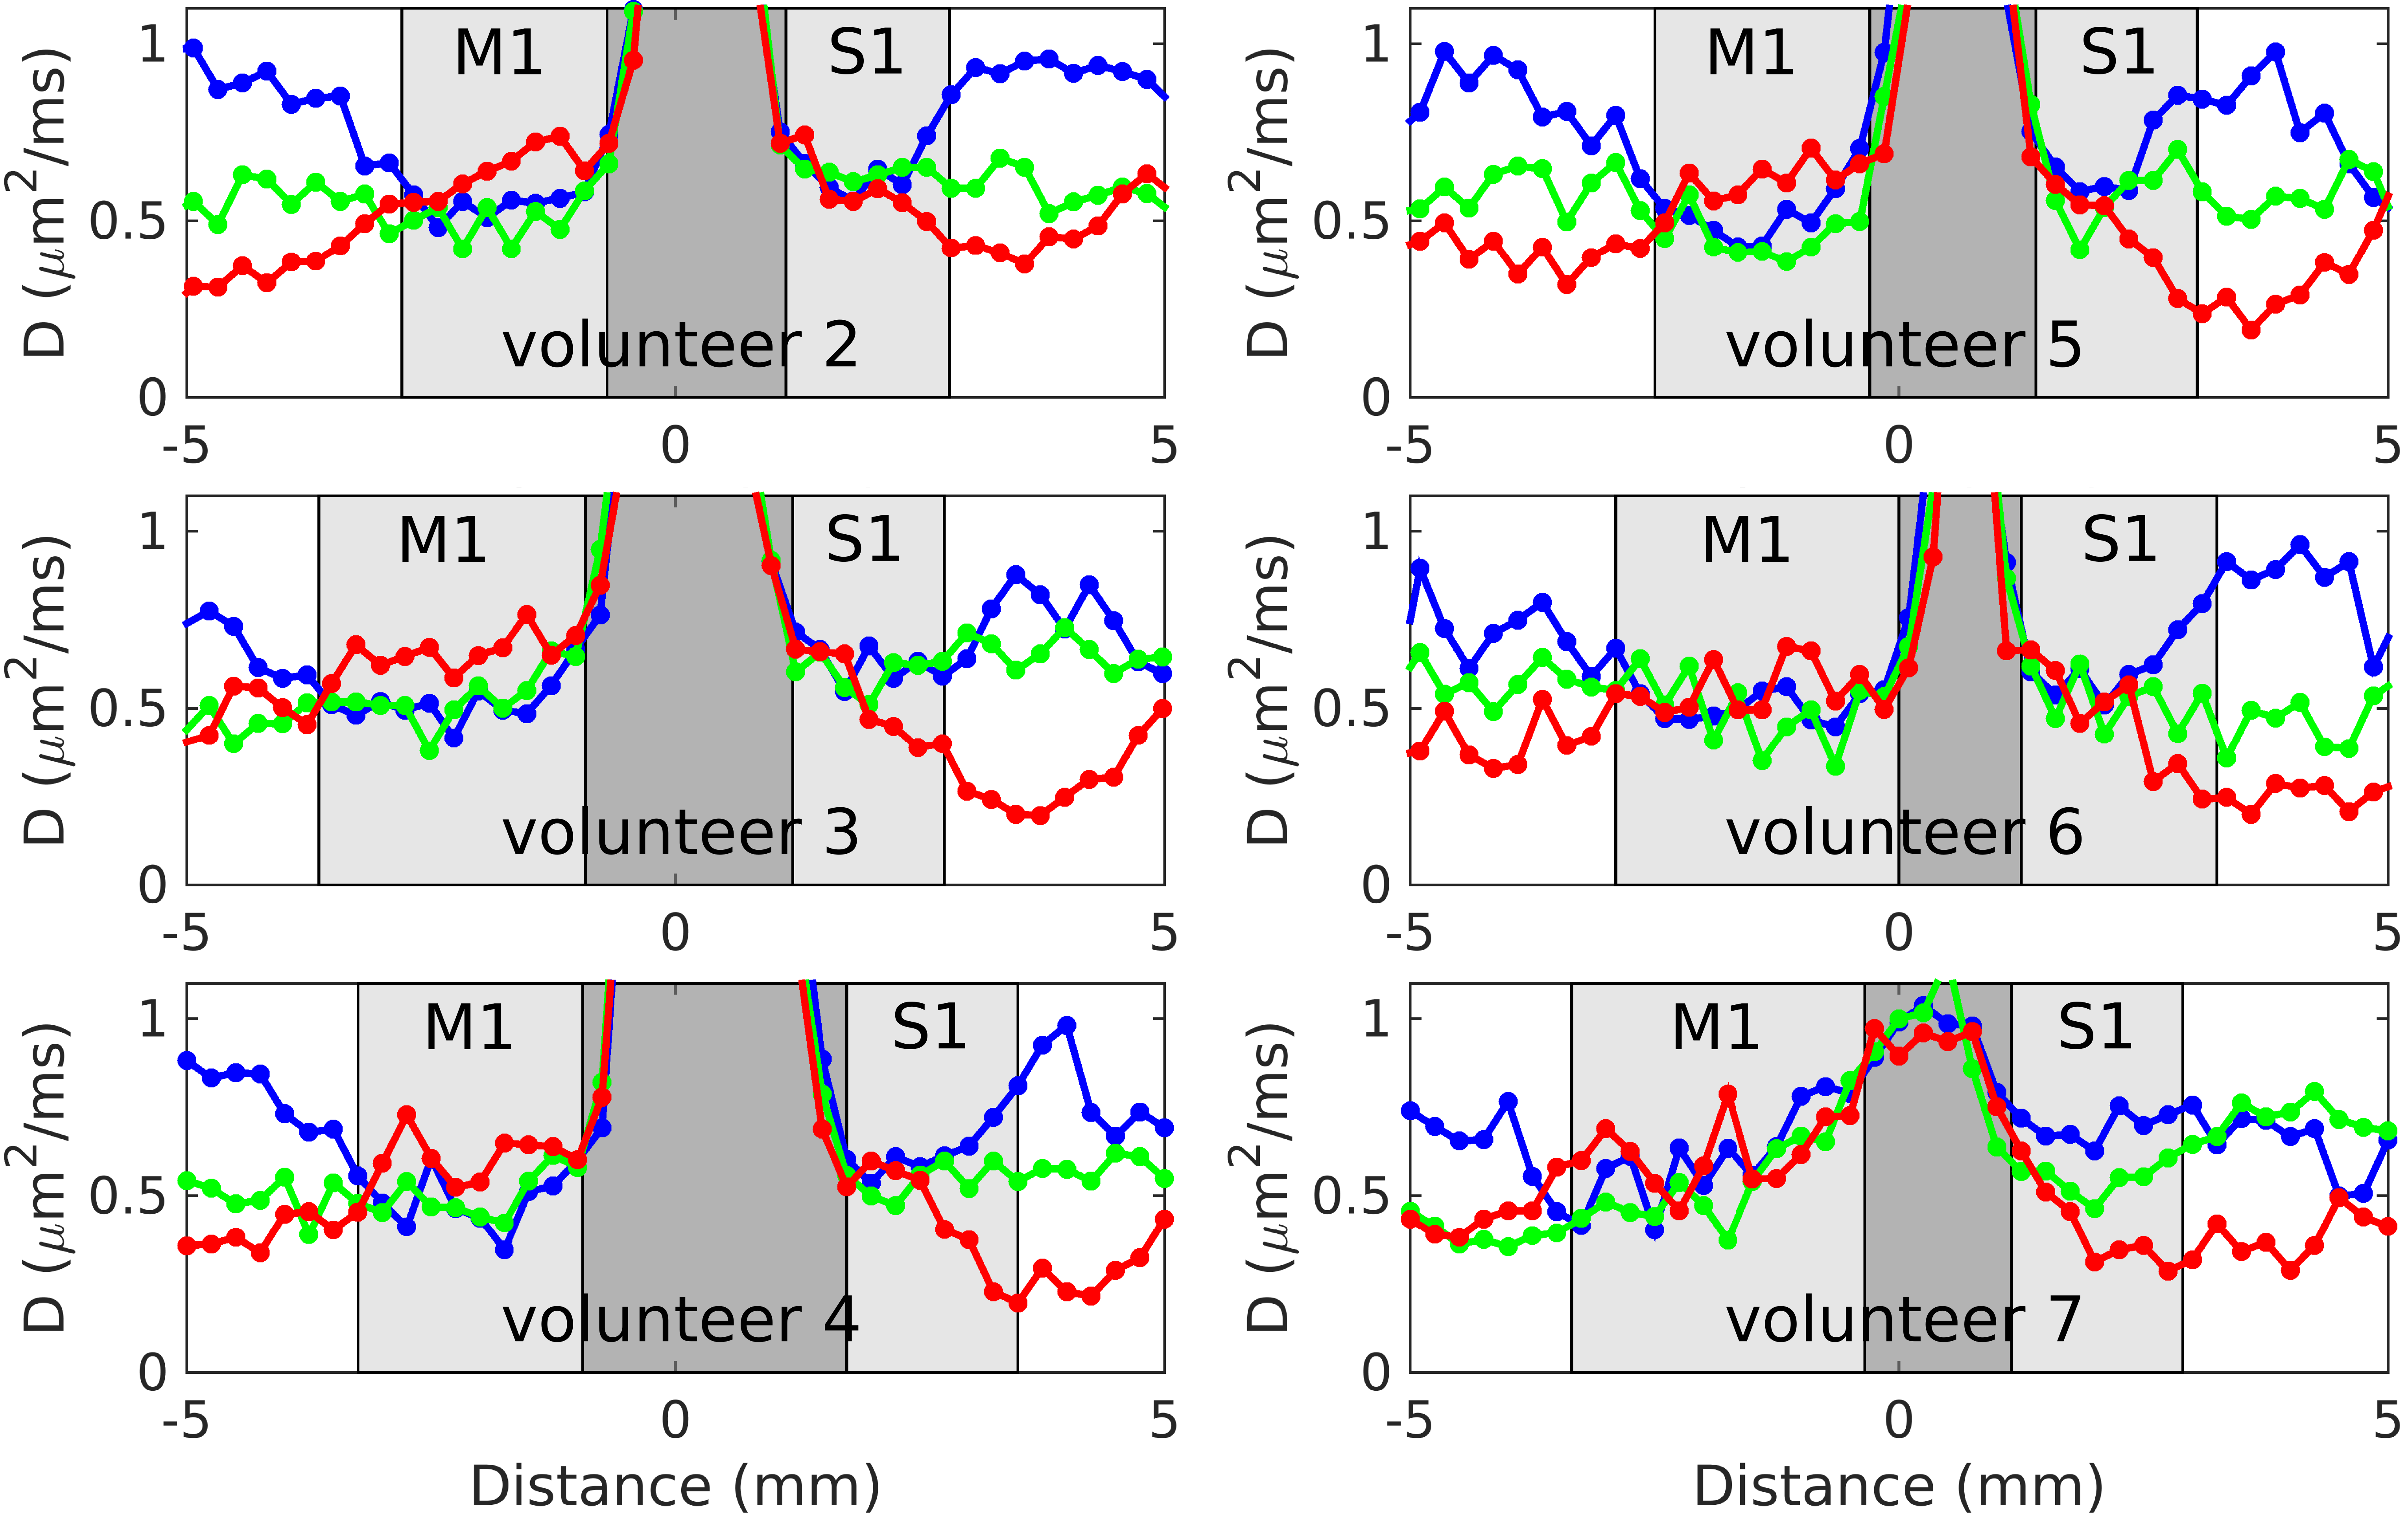
Fig. 2 shows 3dir-250μm results from volunteer 1. In the deeper layers of S1, diffusion coefficients in the radial direction (red) appear to be substantially lower than in the tangential directions (green and blue). In upper S1, the diffusion coefficients for the three directions appear to be very similar, suggesting little diffusion anisotropy there. This pattern in S1 can be seen consistently across volunteers (Fig. 3). In M1, higher diffusion coefficients in the radial versus the tangential directions can readily be seen in many, but not all, volunteers.
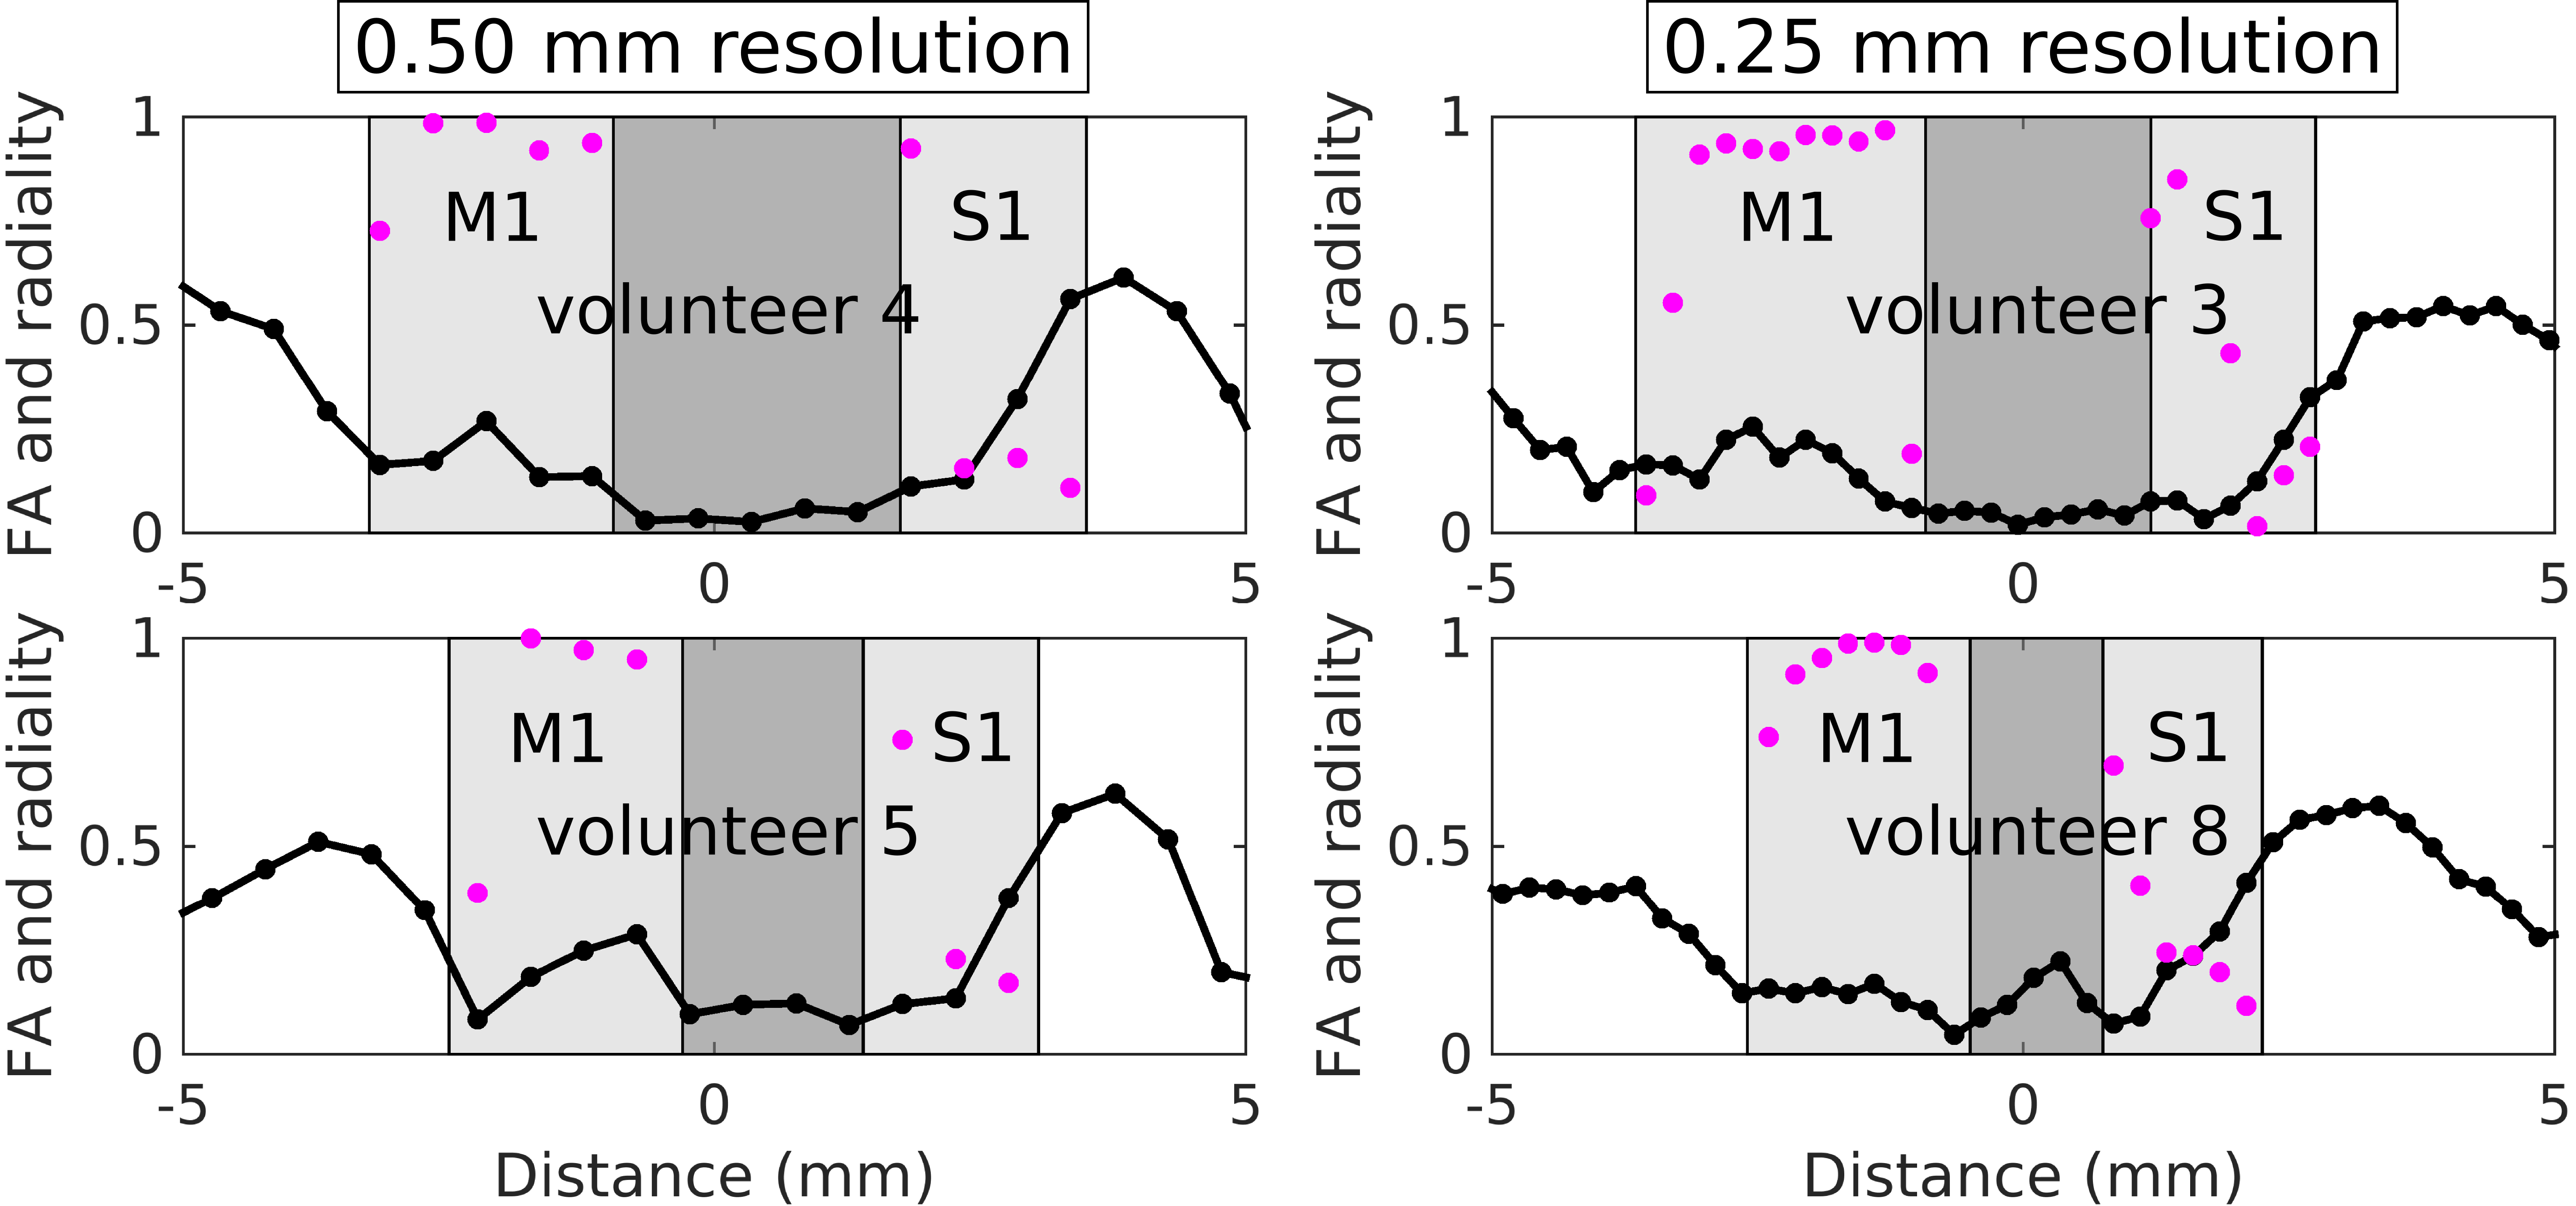
Fig. 4 shows 13dir-500μm and 13dir-250μm results from volunteer 6 and Fig. 5 shows corresponding results from volunteers 3, 4, 5 and 8. In deep S1, high FA and low radiality values are seen, indicating predominantly tangential diffusion, whereas low FA values are seen in upper S1. In M1, moderate FA and high radiality values are seen at most cortical depths. Although the pattern described above can be appreciated at both in-line resolutions, the 13dir-250μm data allow observation of a greater number of samples within cortex—especially important for S1, which is one of the thinnest cortical areas.
Discussion
Our results support prior reports of primarily radial diffusion in M1 and primarily tangential diffusion in S1 using 1–1.5 mm isotropic voxels[11,12], but with greatly reduced concern of partial-volume effects due to our radial resolution of 250–500 μm and with the finer-scale detail now available indicating that the tangential diffusion in S1 originates mainly from the deeper cortical layers. These findings also agree remarkably well with the known myeloarchitecture of S1, where dense bands of tangential myelinated fibers have been reported in layers 5 and 6, as well as that of M1, where radial myelinated fibers appear prominently in most cortical layers[2]. In conclusion, this work demonstrates the feasibility of making in-vivo diffusion measurements at several cortical depths, without combining data across individuals or across different locations on the cortical sheet, thus providing an unprecedented window into the microstructure of cerebral cortex.Acknowledgements
The authors would like to thank Nina Fultz and Ned Ohringer for their assistance with volunteer recruitment and data acquisition, and Jeff Neil, Itamar Ronen and Bob Turner for their helpful feedback. This work was supported by the BWH-MGH 7T Pilot Study Grant, NIH grants P41-EB015896, R01-EB019437, R01-MH111419, R01-EB010195 and R01-CA154834, the Athinoula A. Martinos Center for Biomedical Imaging, and the Radiology Departments at BCH, BWH and MGH, and made possible by the resources provided by NIH Shared Instrumentation Grant S10-RR019371.References
[1] Hubel DH. Eye, Brain, and Vision. Scientific American Library 1988.
[2] Vogt C, Vogt O. Allgemeinere ergebnisse unserer hirnforschung. J Physiol Neurol (Leipz.) 1919;25:279–462.
[3] Yu X, Qian C, Chen DY, Dodd SJ, Koretsky AP. Deciphering laminar-specific neural inputs with line-scanning fMRI. Nat Methods 2014;11:55–58.
[4] Kashyap S, Ivanov D, Sengupta S, Poser BA, Uludağ K. True laminar resolution fMRI of the human visual cortex at 7T. Proc Intl Soc Mag Reson Med 2018;26:394.
[5] Balasubramanian M, Mulkern RV, Neil JJ, Maier SE, Polimeni JR. In-vivo line-scan diffusion MR at 250 micron inline resolution within human cerebral cortex at 7T. Proc Intl Soc Mag Reson Med 2018;26:1618.
[6] Mansfield P, Maudsley AA. Line scan proton spin imaging in biological structures by NMR. Phys Med Biol 1976;21:847–852.
[7] Chenevert TL, Pipe JG, Williams DM, Brunberg JA. Quantitative measurement of tissue perfusion and diffusion in vivo. Magn Reson Med 1991;17:197–212.
[8] Gudbjartsson H, Maier SE, Mulkern RV, Mórocz IA, Patz S, Jolesz FA. Line scan diffusion imaging. Magn Reson Med 1996;36:509–519.
[9] Zaretskaya N, Fischl B, Reuter M, Renvall V, Polimeni JR. Advantages of cortical surface reconstruction using submillimeter 7 T MEMPRAGE. Neuroimage 2018; 165:11-26.
[10] Basser PJ, Pierpaoli C. Microstructural and physiological features of tissues elucidated by quantitative-diffusion-tensor MRI. J Magn Reson B 1996;111:209–219.
[11] Anwander A, Pampel A, Knösche TR. In vivo measurement of cortical anisotropy by diffusion-weighted imaging correlates with cortex type. Proc Intl Soc Mag Reson Med 2010;18:109.
[12] McNab JA, Polimeni JR, Wang R, Augustinack JC, Fujimoto K, Stevens A, Triantafyllou C, Janssens T, Farivar R, Folkerth RD, Vanduffel W, Wald LL. Surface based analysis of diffusion orientation for identifying architectonic domains in the in vivo human cortex. Neuroimage 2013;69:87–100.
Figures