0060
COMPARISON OF DIFFERENT TENSOR ENCODING COMBINATIONS IN MICROSTRUCTURAL PARAMETER ESTIMATION1Cardiff University Brain Research Imaging Center (CUBRIC), School of Psychology, Cardiff University, Cardiff, United Kingdom, 2School of Psychology, Faculty of Health Sciences, Australian Catholic University, Melbourne, Victoria, 3065, Australia
Synopsis
Diffusion-weighted imaging provides information to study the brain microstructure. Several studies in the literature have shown that there is degeneracy in the estimated parameters for a commonly used microstructural model. B-tensor encoding is one of the strategies that has been proposed to solve the degeneracy. The combination of linear-spherical tensor encoding (LTE+STE) and linear-planar (LTE+PTE) have been utilized in previous works. In this paper, we compare different combinations of b-tensor encoding, (LTE+STE), linear-planar (LTE+PTE), planar-spherical (PTE+STE) and linear-planar-spherical (LTE+PTE+STE). We also compare the results of fit using a nonlinear least square algorithm and microstructure imaging of crossing (MIX) method. The results show that the combination of tensor encodings with MIX fitting algorithm leads to lower bias and higher precision in the parameter estimates than single tensor encoding.
Introduction
Diffusion MRI (dMRI) is sensitive to the displacement of water molecules on the scale of the micrometer, and has, therefore, become one of the important tools for investigating brain microstructure 1. Several models have been proposed that separate the tissue into intra and extra-neurite compartments 2-4. Even with a high number of measurements, the fitting process suffers from degeneracy5. There are several studies trying to solve the degeneracy problem by adding extra measurements such as diffusion time, echo time and diffusion encoding beyond standard Stejskal-Tanner encoding (or linear tensor encoding, LTE) 6-13. The literature has reported on improvements on some estimated parameters in the case of noise and a theoretical solution to the degeneracy in the noiseless case 10-13. Here we extend this by comparing multiple combinations beyond what was previously proposed. We performed extensive simulations to address degeneracy, bias, and precision in realistic noise scenarios for 4 different combinations of tensor encoding; STE+LTE, PTE+LTE, PTE+STE, and PTE+LTE+STE.
Methods
We use the standard model of white matter 14,15 with the modified extra axonal compartment and the fiber orientation distribution function (fODF) modeled with a Watson distribution. For a general B-matrix, the diffusion signal is:
$$ S(\mathbf{B})/S_0 = f\int_{\mathbb{S}^2} W(\mathbf{n}) e^{-\mathbf{B}: \mathbf{D_i}(\mathbf{n})} d\mathbf{n} + (1-f) \int_{\mathbb{S}^2} W(\mathbf{n}) e^{-\mathbf{B}:\mathbf{D_e}(\mathbf{n})} d\mathbf{n} \quad \quad \quad \quad \quad \quad \quad (1)$$
where $$$f$$$ is the intra-neurite water fraction, $$$\mathbf{D_i}(\mathbf{n})=D_a \mathbf{n}\mathbf{n}^T$$$ is the intra-neurite diffusivity, $$$\mathbf{D_e}(\mathbf{n})$$$ is the extra-neurite rank-2 diffusion tensor and the eigenvalues are given by the parallel and perpendicular diffusivities, $$$\mathbf{D_e}(\mathbf{n}) = (D_e ^{\mid\mid} - D_e ^\perp) \mathbf{n}\mathbf{n}^T + D_e ^\perp \mathbf{I}$$$. $$$W(\mathbf{n})$$$ is the Watson distribusion characterized by the mean orientation $$$\mu$$$ and the concentration parameter $$$\kappa$$$ around this orientation. The linear, planar and spherical tensors are defined as, $$$\mathbf{B_{lin}} = b\mathbf{g}\mathbf{g}^T$$$, $$$\mathbf{B_{pla}} = b(\mathbf{I}_3 − \mathbf{g} \mathbf{g}^T)/2$$$ and $$$\mathbf{B_{sph}} = b\mathbf{I}_3/3$$$ respectively, where $$$g$$$ is the diffusion gradient direction and the b-value $$$b$$$ is defined as the trace of the $$$\mathbf{B}$$$-matrix.
The fiber direction is estimated using nonlinear least square fitting of a single diffusion tensor. In order to find the other parameters of this model ($$$f$$$, $$$D_a$$$, $$$D_e ^{\mid\mid}$$$, $$$D_e^\perp$$$ and $$$ \kappa $$$), we use the microstructure imaging of crossing fibers (MIX) method 16. Synthetic dMRI signals were generated based on the model described in Equations (1), with ground truth parameter values defined by two sets of parameters. In set A, we fix all the parameters and create signal with SNR = 50 [$$$f$$$ = 0.38, $$$D_a$$$ = 0.5, $$$D_e^{\mid\mid}$$$ = 2.1, $$$D_e^\perp$$$ = 0.74 and $$$\kappa$$$ = 64]. Set B contains 84 different physically plausible combinations of the five parameters that are spaced in 9 points in the intervals: 0.25 < $$$f$$$ < 0.75, 0.6 < $$$D_a$$$ < 2.5 $$$\mu m^2/ms$$$, 0.6 < $$$D_e^{\mid\mid}$$$ < 2.5 $$$\mu m^2/ms$$$, 0.1 < $$$D_e^\perp$$$ < 2 $$$\mu m^2/ms$$$and $$$\kappa\in$$$ [1, 2, 3, 4, 5, 6, 9, 16, 64]. The simulated protocol consisted of one b = 0 and two shells (b = 1 and b = 2 $$$ms/\mu m^2$$$) of 30 directions each. In order to make the number of samples equal for the different encoding combinations, we repeated each direction in the combination of (STE+LTE+PTE) twice, three times for the combination of (STE+LTE), (LTE+PTE), (PTE+STE) and six times for STE, LTE and PTE. Therefore, the number of measurements is (30+30+1)$$$\times$$$2$$$\times$$$3 = 366.
Results and discussion
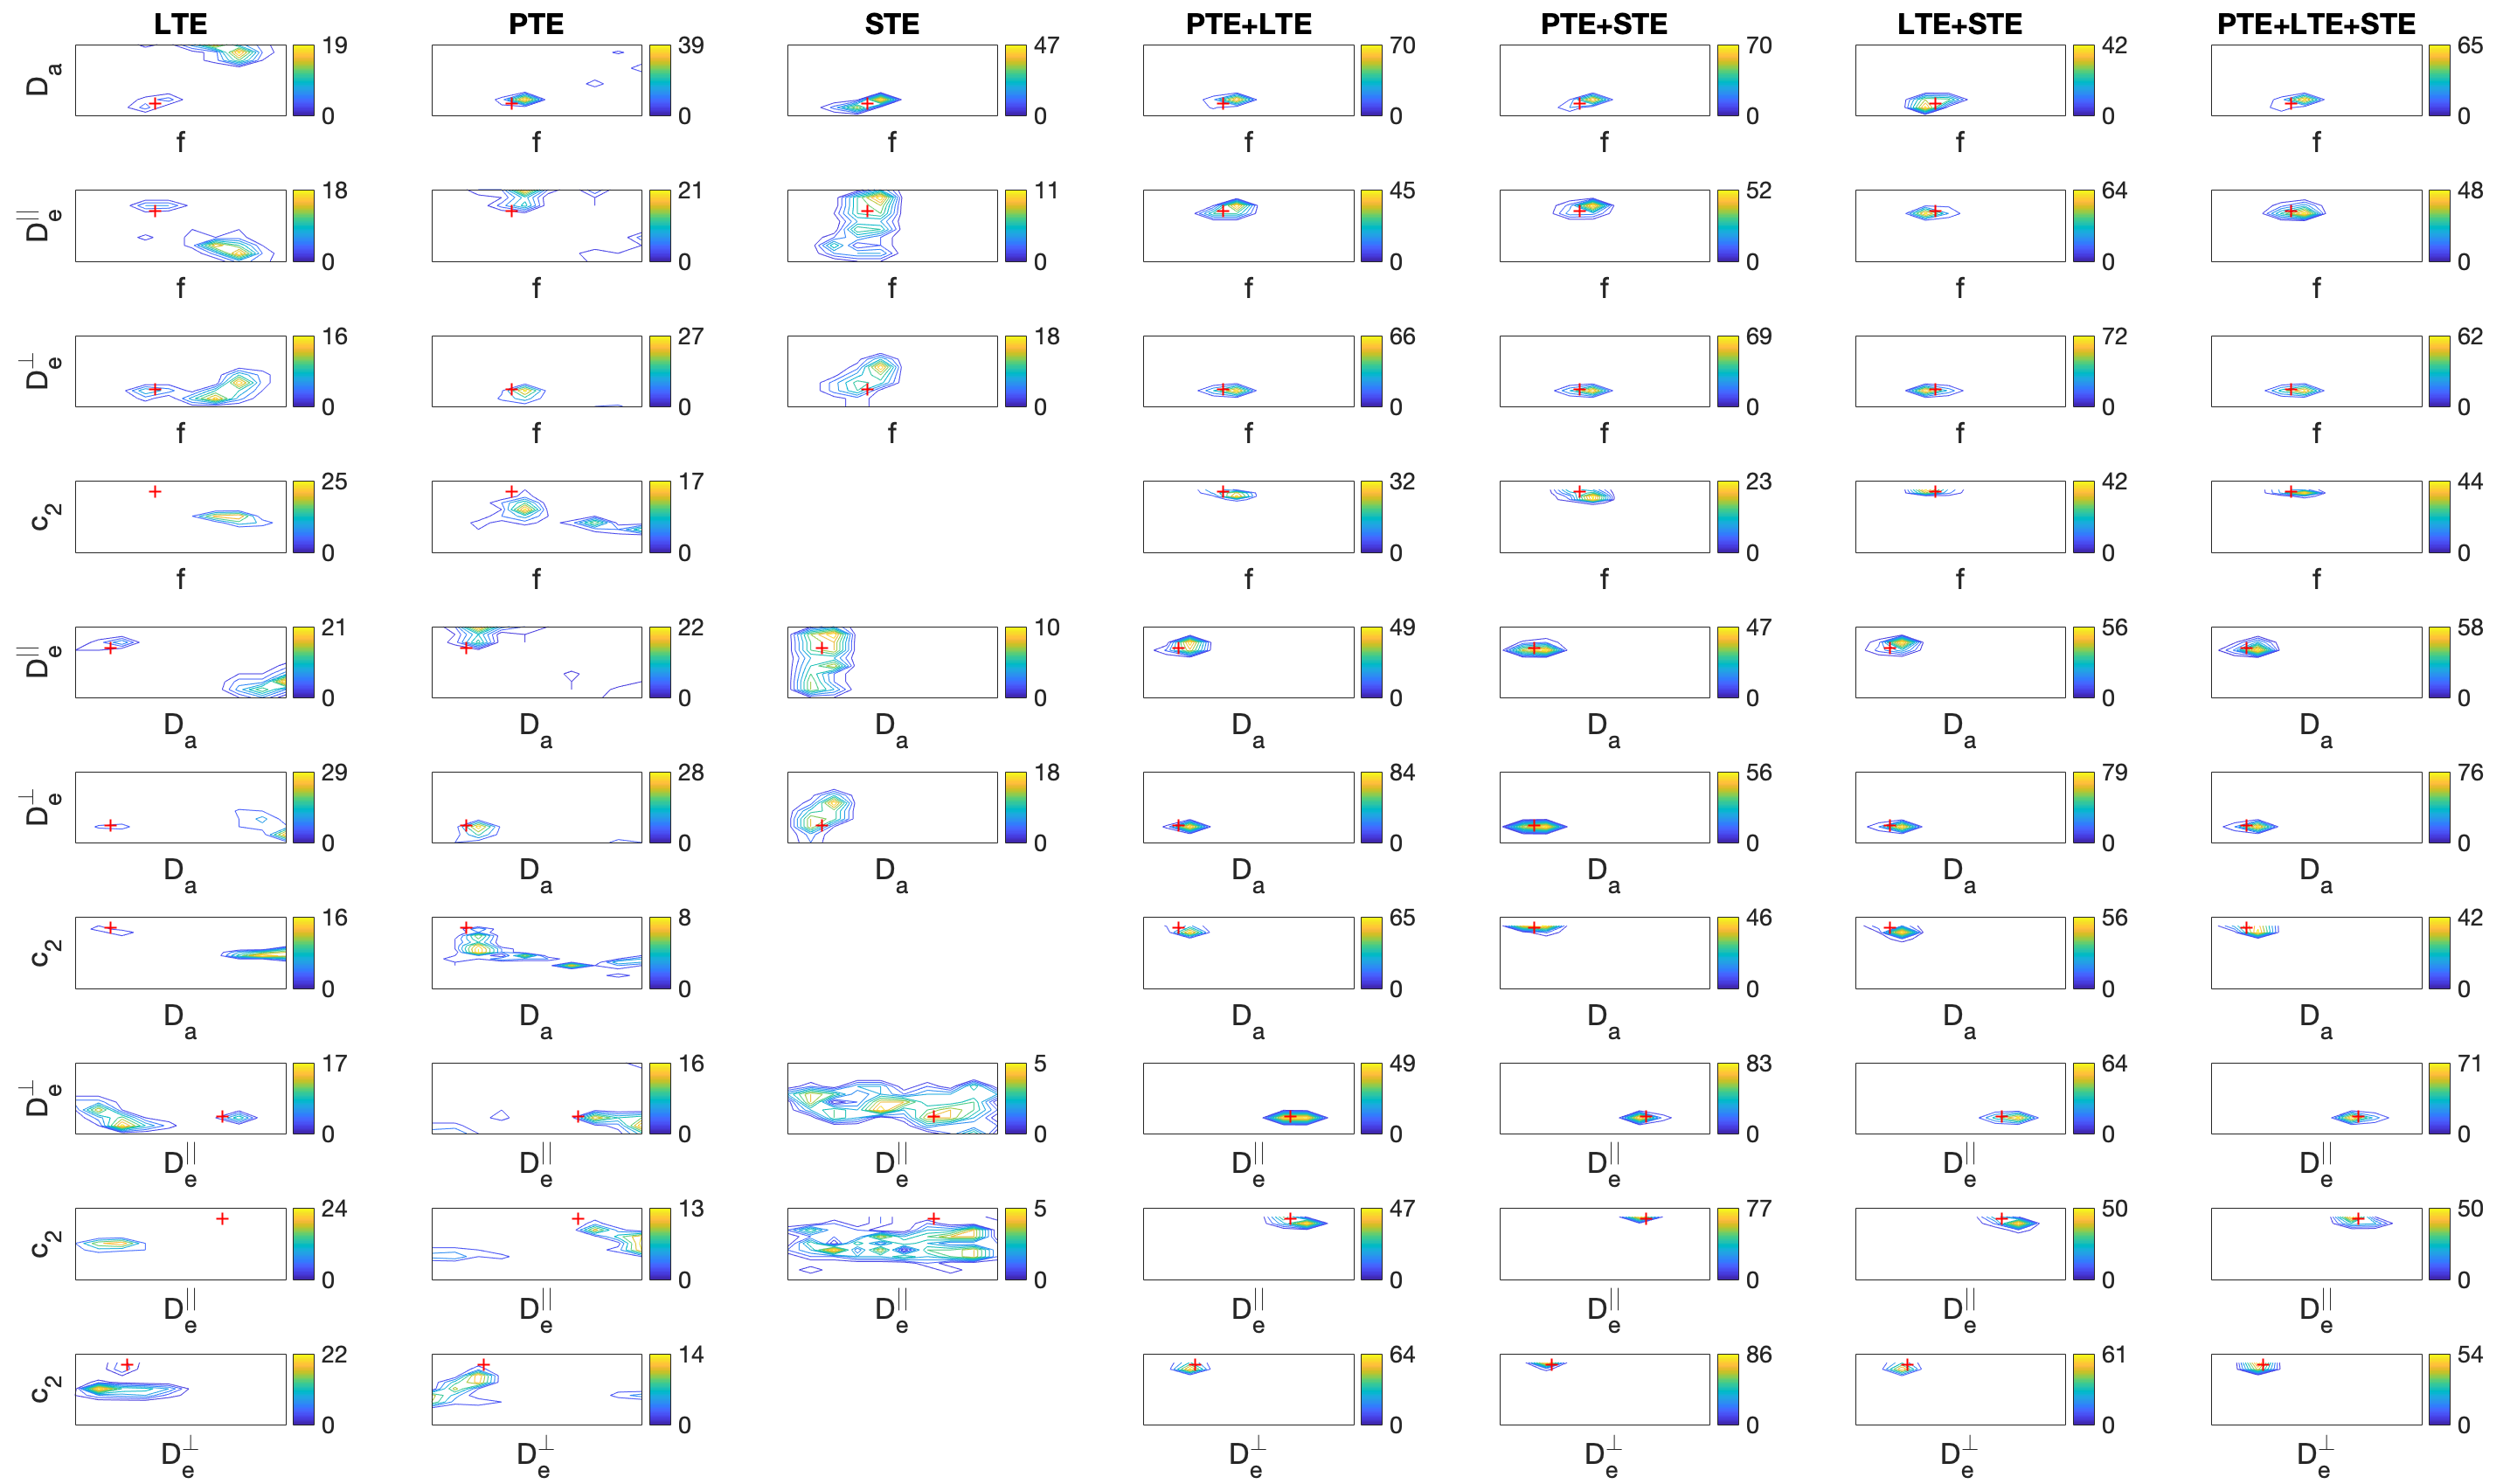
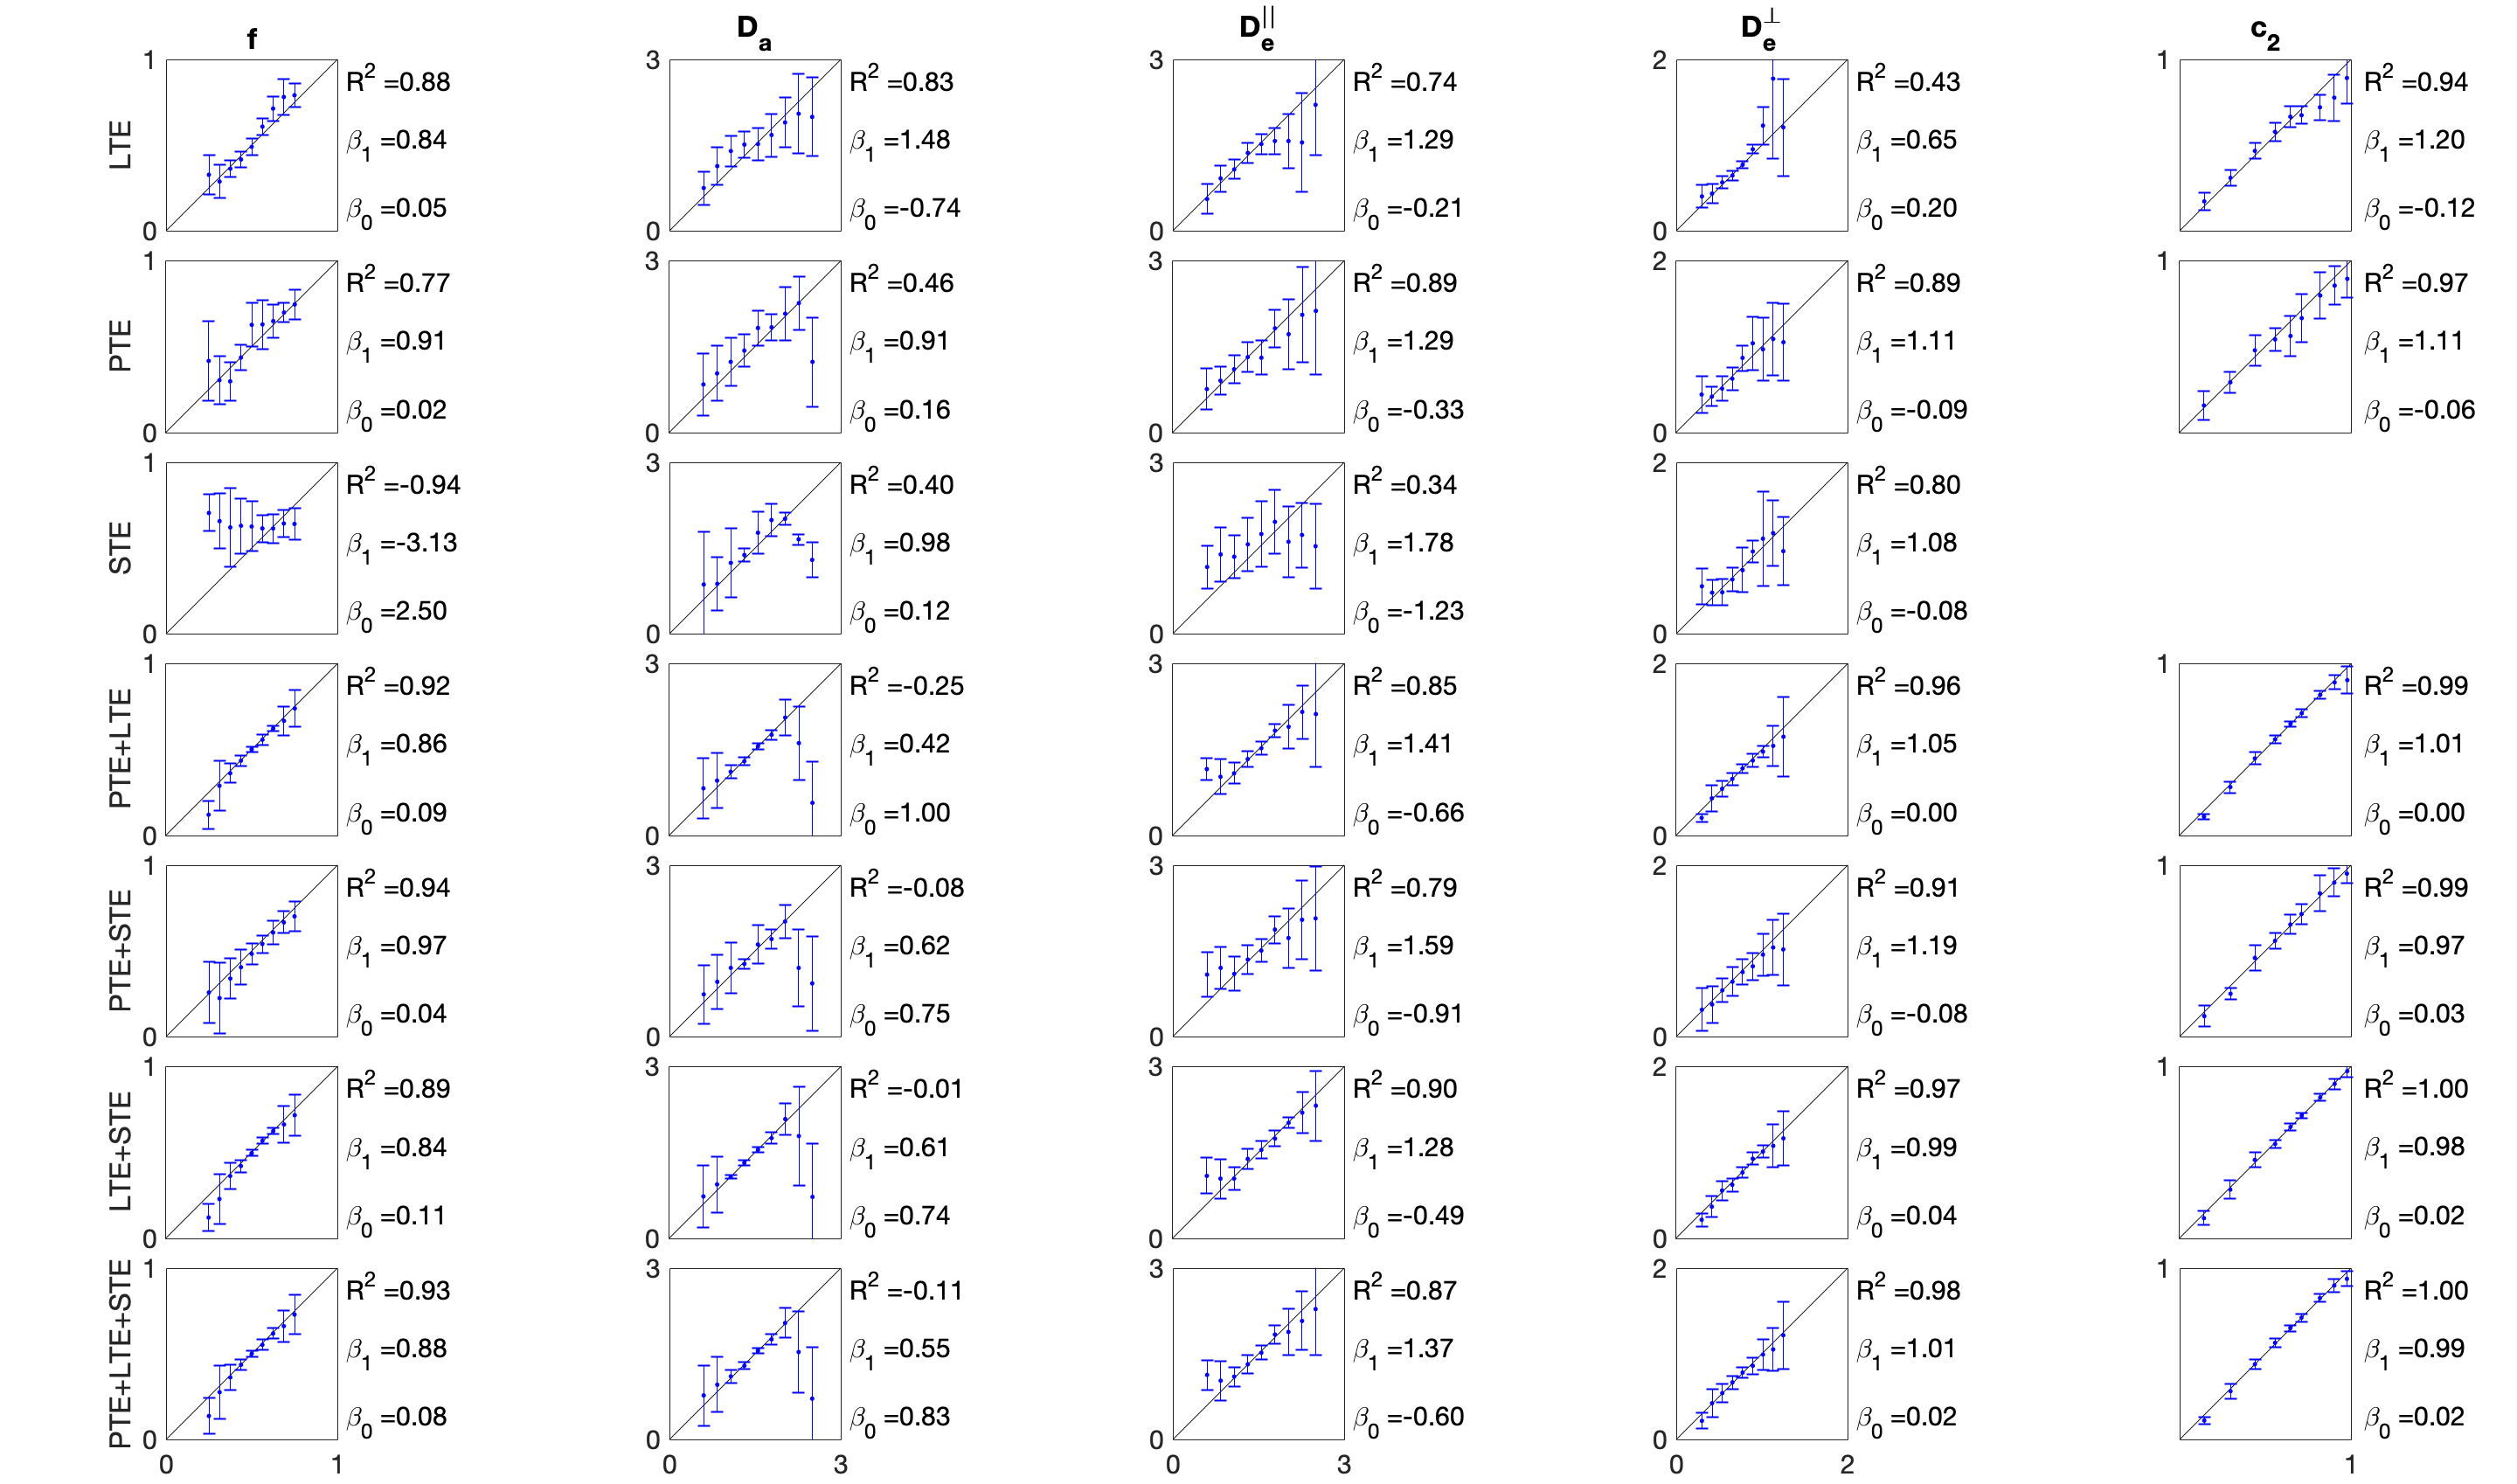
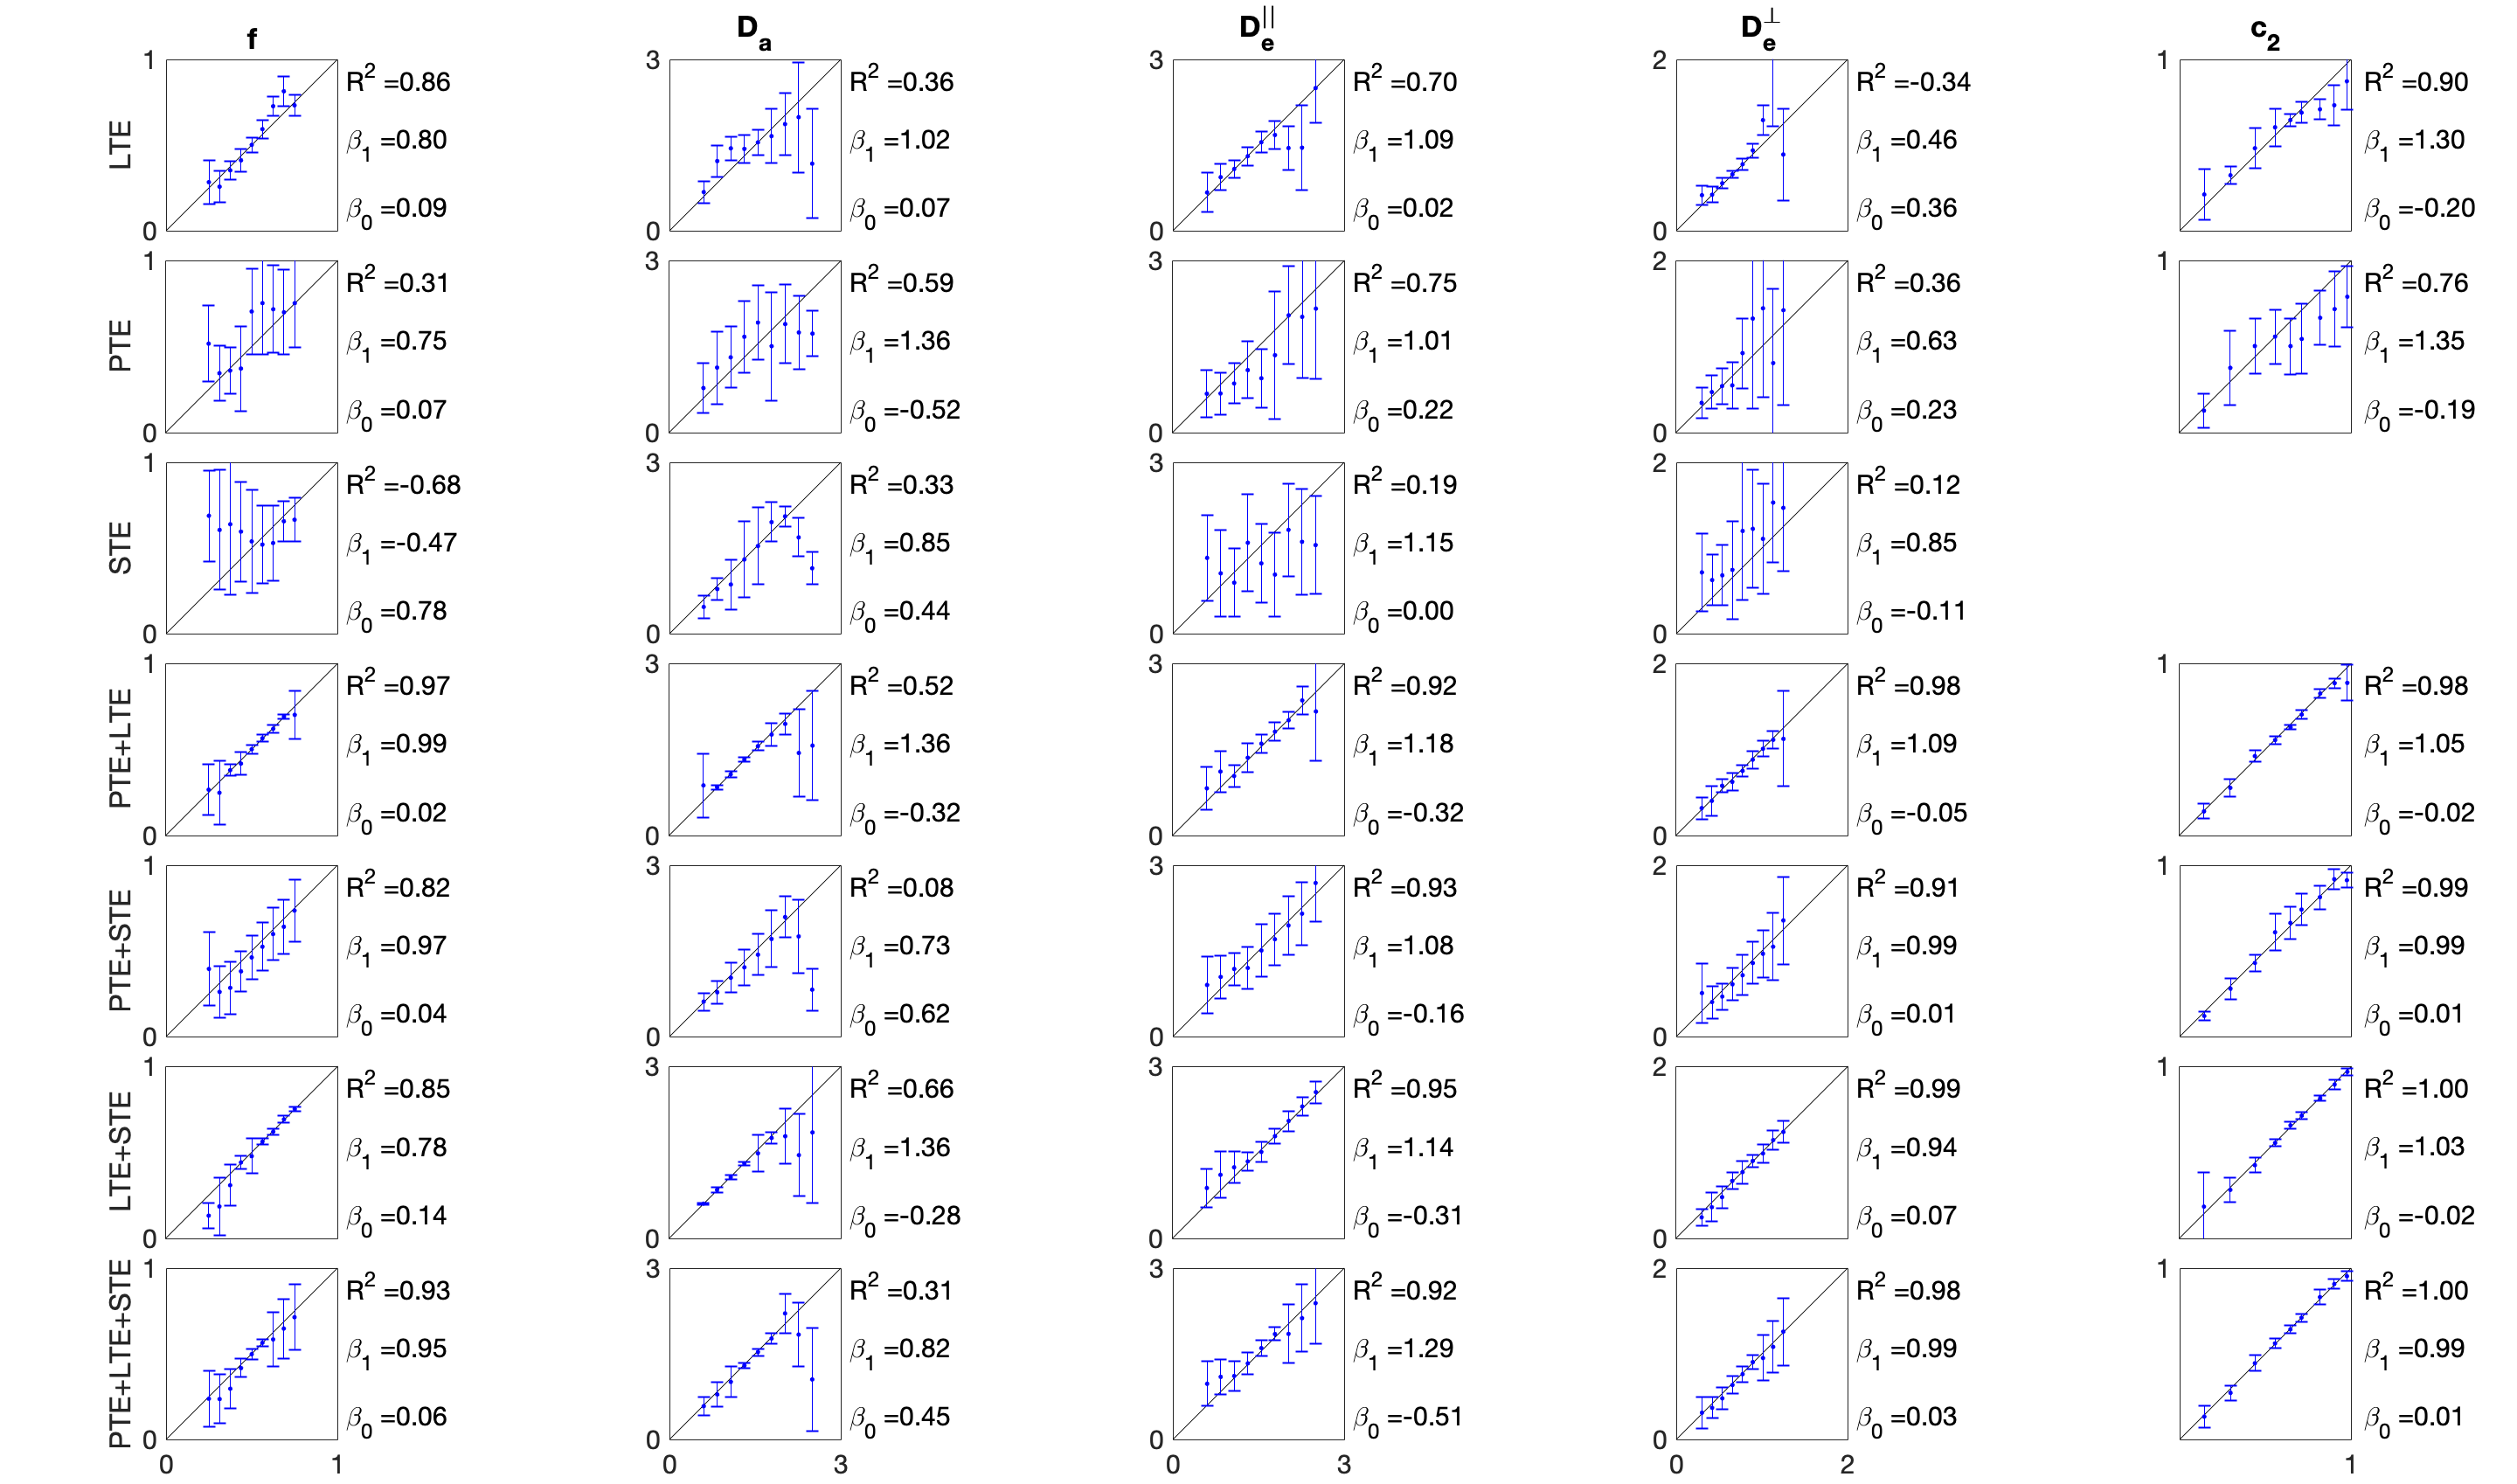
Fig. 1 and 2 show the histograms of the fit results of set A using a nonlinear least square (NLLS) algorithm with random initial values and MIX framework respectively. The contour plots of different combinations of the parameters of Fig. 2 are illustrated in Fig. 3. In agreement with previous literature, none of the single encodings can solve the problem of degeneracy. The combination of encodings shows that the fitting is stable in all cases. The mean and the standard deviation (std) of the estimated parameters reflect the degree of degeneracy, bias, and precision. We quantify the total performance by fitting a linear trend to the plot of estimated parameter vs ground truth ( $$$R^2$$$, slope, $$$\beta_1$$$, and intercept, $$$\beta_0$$$). In Fig. 4 and Fig. 5, (set B) the combination of tensor encodings leads to better results while MIX outperforms NLLS.
CONCLUSION
In this work, we studied the effect of combining different tensor encodings on estimating microstructural parameters from the diffusion signal. We showed that using one diffusion encoding leads to different sets of parameters that all fit the signal equally well. The simulation results show that the combination of tensor encodings results in a better estimation of the microstructural parameters compared to a single diffusion encoding.Acknowledgements
The authors would like to thank Bibek Dhital, PhD, for the fruitful discussion about the combination of PTE and LTE. CMWT is supported by a Rubicon grant (680-50-1527) from the Netherlands Organisation for Scientific Research (NWO) and MA, CMWT and DKJ were all supported by a Wellcome Trust grant (096646/Z/11/Z).
References
1. Basser PJ, Mattiello J, LeBihan D. MR diffusion tensor spectroscopy and imaging. Biophysical journal. 1994 Jan 1;66(1):259-67.
2. Stanisz GJ, Wright GA, Henkelman RM, Szafer A. An analytical model of restricted diffusion in bovine optic nerve. Magnetic Resonance in Medicine. 1997 Jan;37(1):103-11.
3. Zhang H, Schneider T, Wheeler-Kingshott CA, Alexander DC. NODDI: practical in vivo neurite orientation dispersion and density imaging of the human brain. Neuroimage. 2012 Jul 16;61(4):1000-16.
4. Assaf Y, Blumenfeld‐Katzir T, Yovel Y, Basser PJ. AxCaliber: a method for measuring axon diameter distribution from diffusion MRI. Magnetic Resonance in Medicine: An Official Journal of the International Society for Magnetic Resonance in Medicine. 2008 Jun;59(6):1347-54.
5. Jelescu IO, Veraart J, Fieremans E, Novikov DS. Degeneracy in model parameter estimation for multi‐compartmental diffusion in neuronal tissue. NMR in Biomedicine. 2016 Jan;29(1):33-47.
6. Jespersen SN, Olesen JL, Hansen B, Shemesh N. Diffusion time dependence of microstructural parameters in fixed spinal cord. Neuroimage. 2017 Aug 14.
7. Veraart J, Novikov DS, Fieremans E. TE dependent Diffusion Imaging (TEdDI) distinguishes between compartmental T2 relaxation times. Neuroimage. 2018 Nov 15;182:360-9.
8. Novikov DS, Veraart J, Jelescu IO, Fieremans E. Rotationally-invariant mapping of scalar and orientational metrics of neuronal microstructure with diffusion MRI. NeuroImage. 2018 Jul 1;174:518-38.
9. Westin CF, Szczepankiewicz F, Pasternak O, Özarslan E, Topgaard D, Knutsson H, Nilsson M. Measurement tensors in diffusion MRI: generalizing the concept of diffusion encoding. InInternational Conference on Medical Image Computing and Computer-Assisted Intervention 2014 Sep 14 (pp. 209-216). Springer, Cham.
10. Dhital B, Reisert M, Kellner E, Kiselev VG. Diffusion weighting with linear and planar encoding solves degeneracy in parameter estimation. Proceedings of the ISMRM, Paris. 2018.
11. Fieremans E, Veraart J, Ades-Aron B, Szczepankiewicz F, Nilsson M, Novikov DS. Effect of combining linear with spherical tensor encoding on estimating brain microstructural parameters. Proceedings of the ISMRM, Paris. 2018.
12. Reisert M, Kiselev VG, Dhital B. A Unique Analytical Solution of the White Matter Standard Model using Linear and Planar Encodings. arXiv preprint arXiv:1808.04389. 2018 Aug 13.
13. Coelho S, Pozo JM, Jespersen SN, Jones DK, Frangi AF. Double Diffusion Encoding Prevents Degeneracy in Parameter Estimation of Biophysical Models in Diffusion MRI. arXiv preprint arXiv:1809.05059. 2018 Sep 13.
14. Jespersen SN, Kroenke CD, Østergaard L, Ackerman JJ, Yablonskiy DA. Modeling dendrite density from magnetic resonance diffusion measurements. Neuroimage. 2007 Feb 15;34(4):1473-86.
15. Kroenke CD, Ackerman JJ, Yablonskiy DA. On the nature of the NAA diffusion attenuated MR signal in the central nervous system. Magnetic Resonance in Medicine: An Official Journal of the International Society for Magnetic Resonance in Medicine. 2004 Nov;52(5):1052-9.
16. Farooq H, Xu J, Nam JW, Keefe DF, Yacoub E, Georgiou T, Lenglet C. Microstructure imaging of crossing (MIX) white matter fibers from diffusion MRI. Scientific reports. 2016 Dec 16;6:38927.
Figures
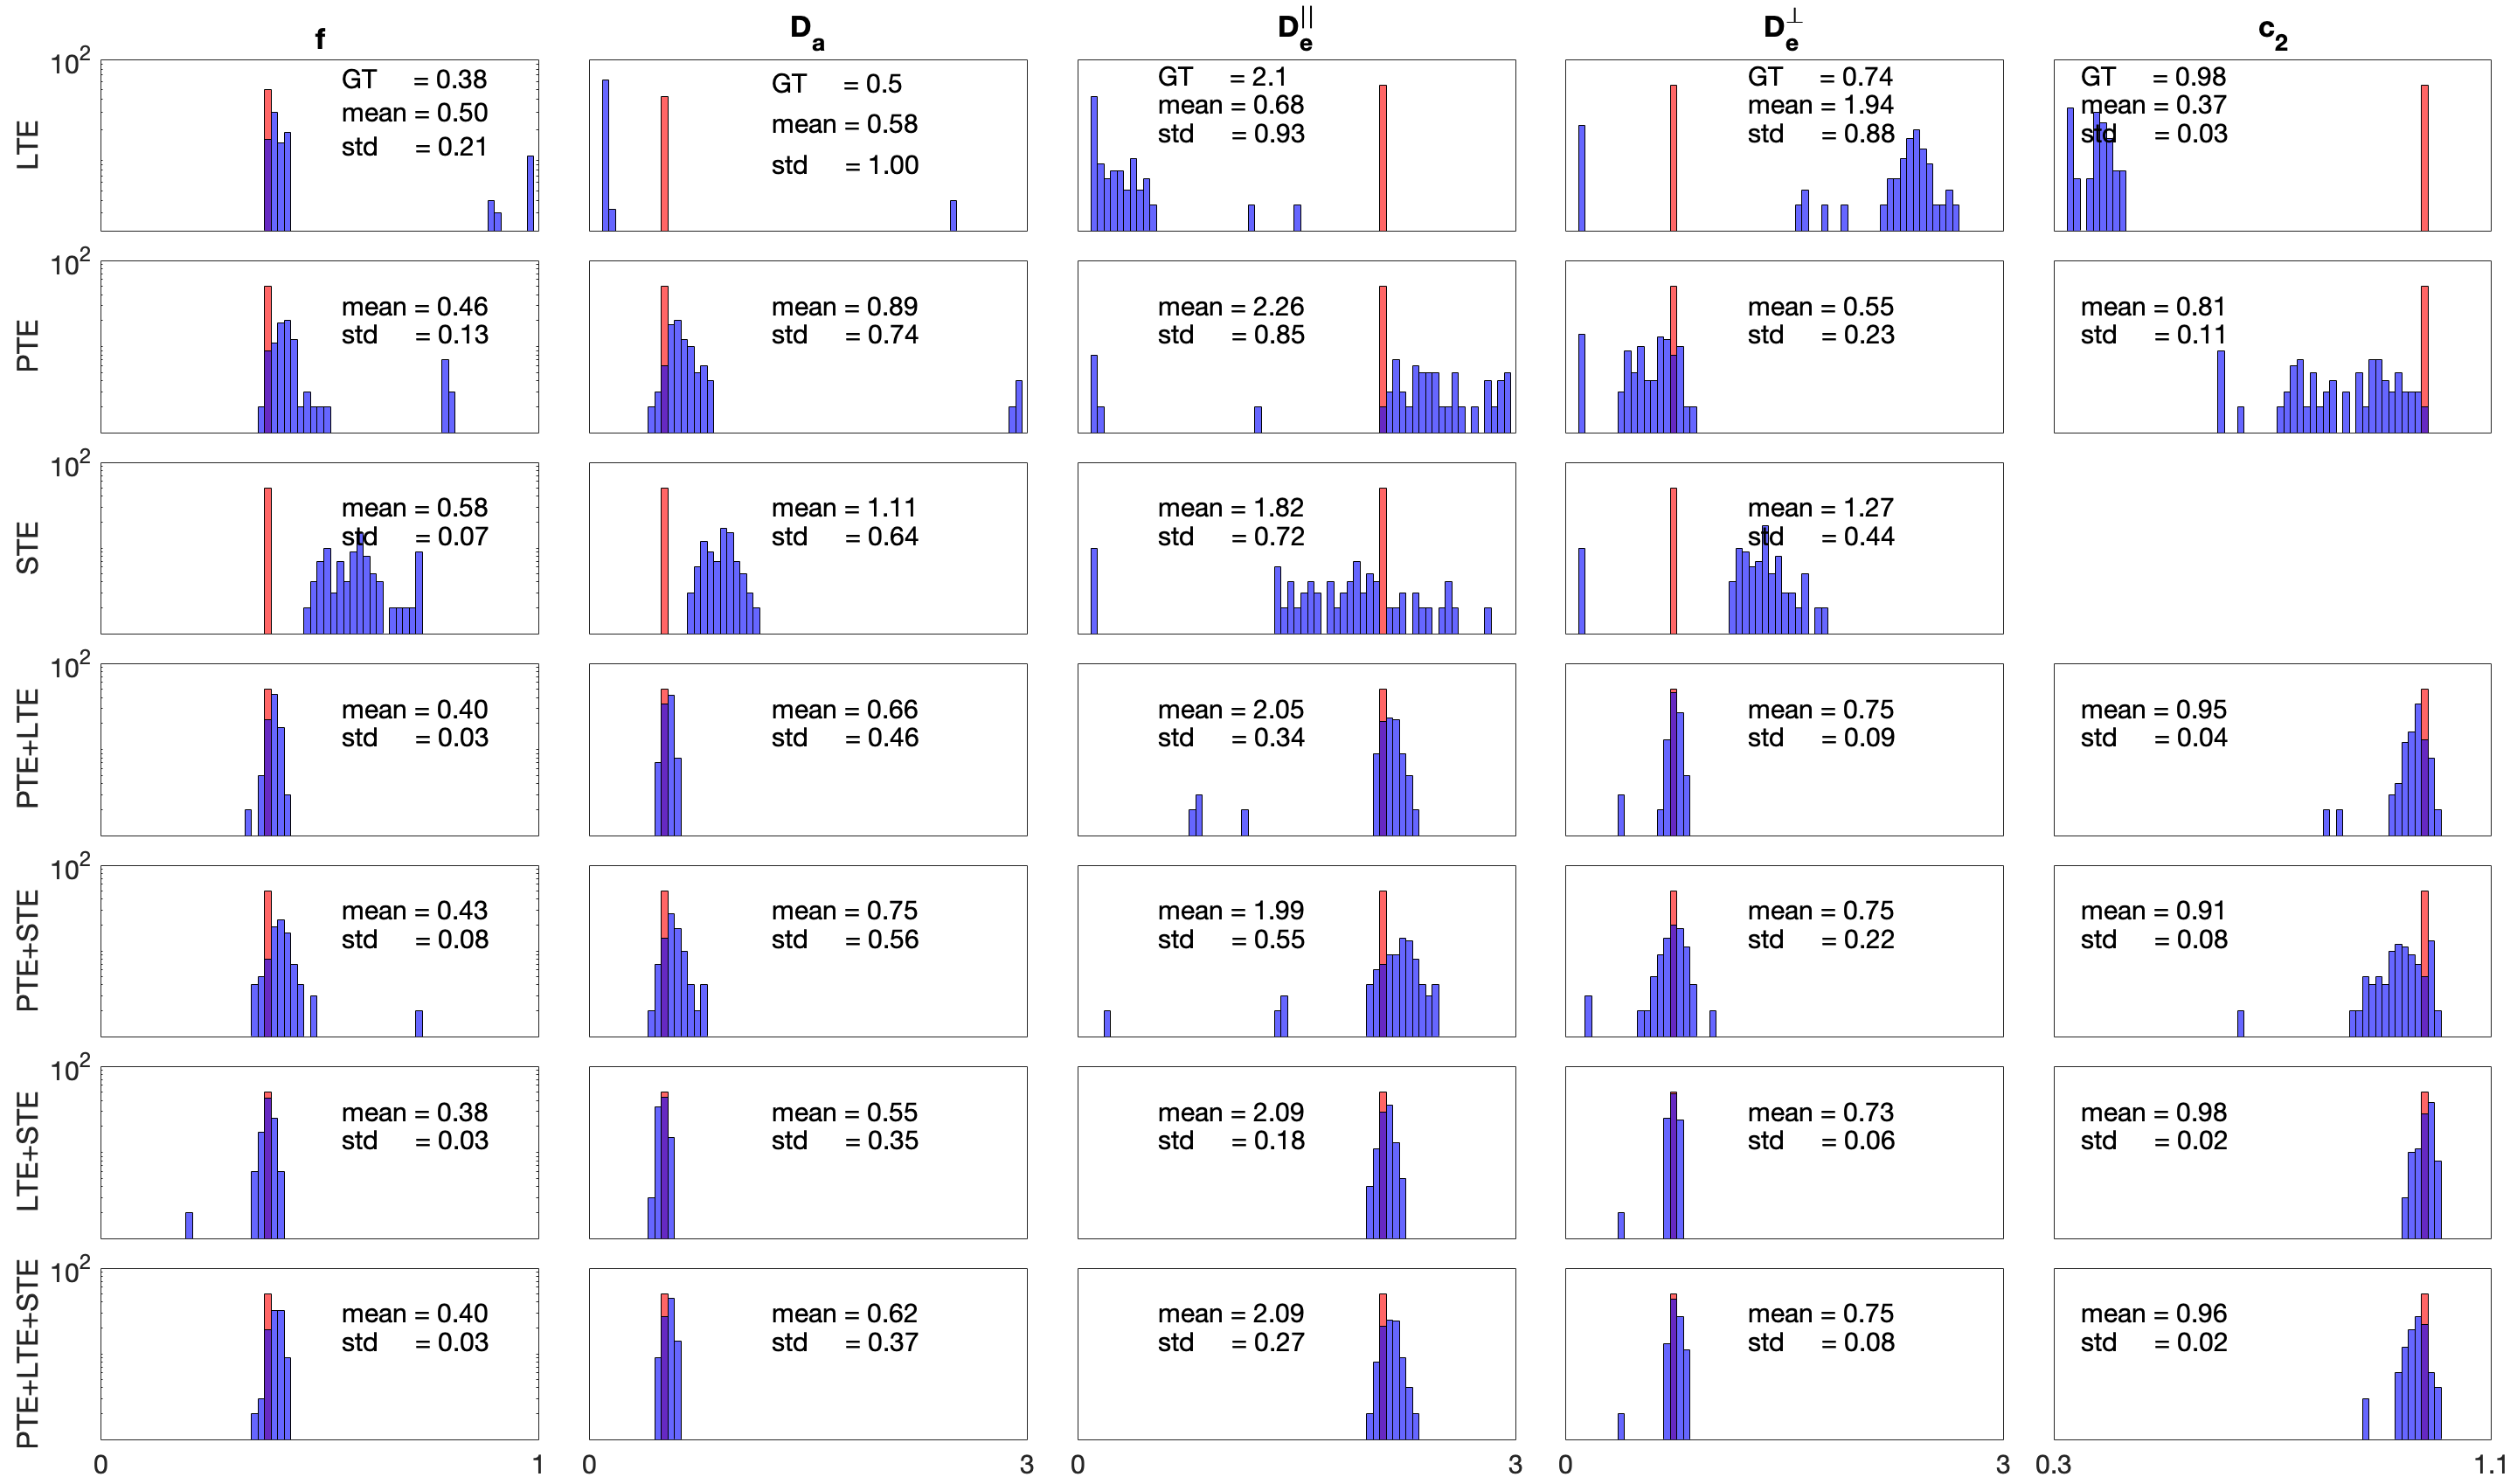
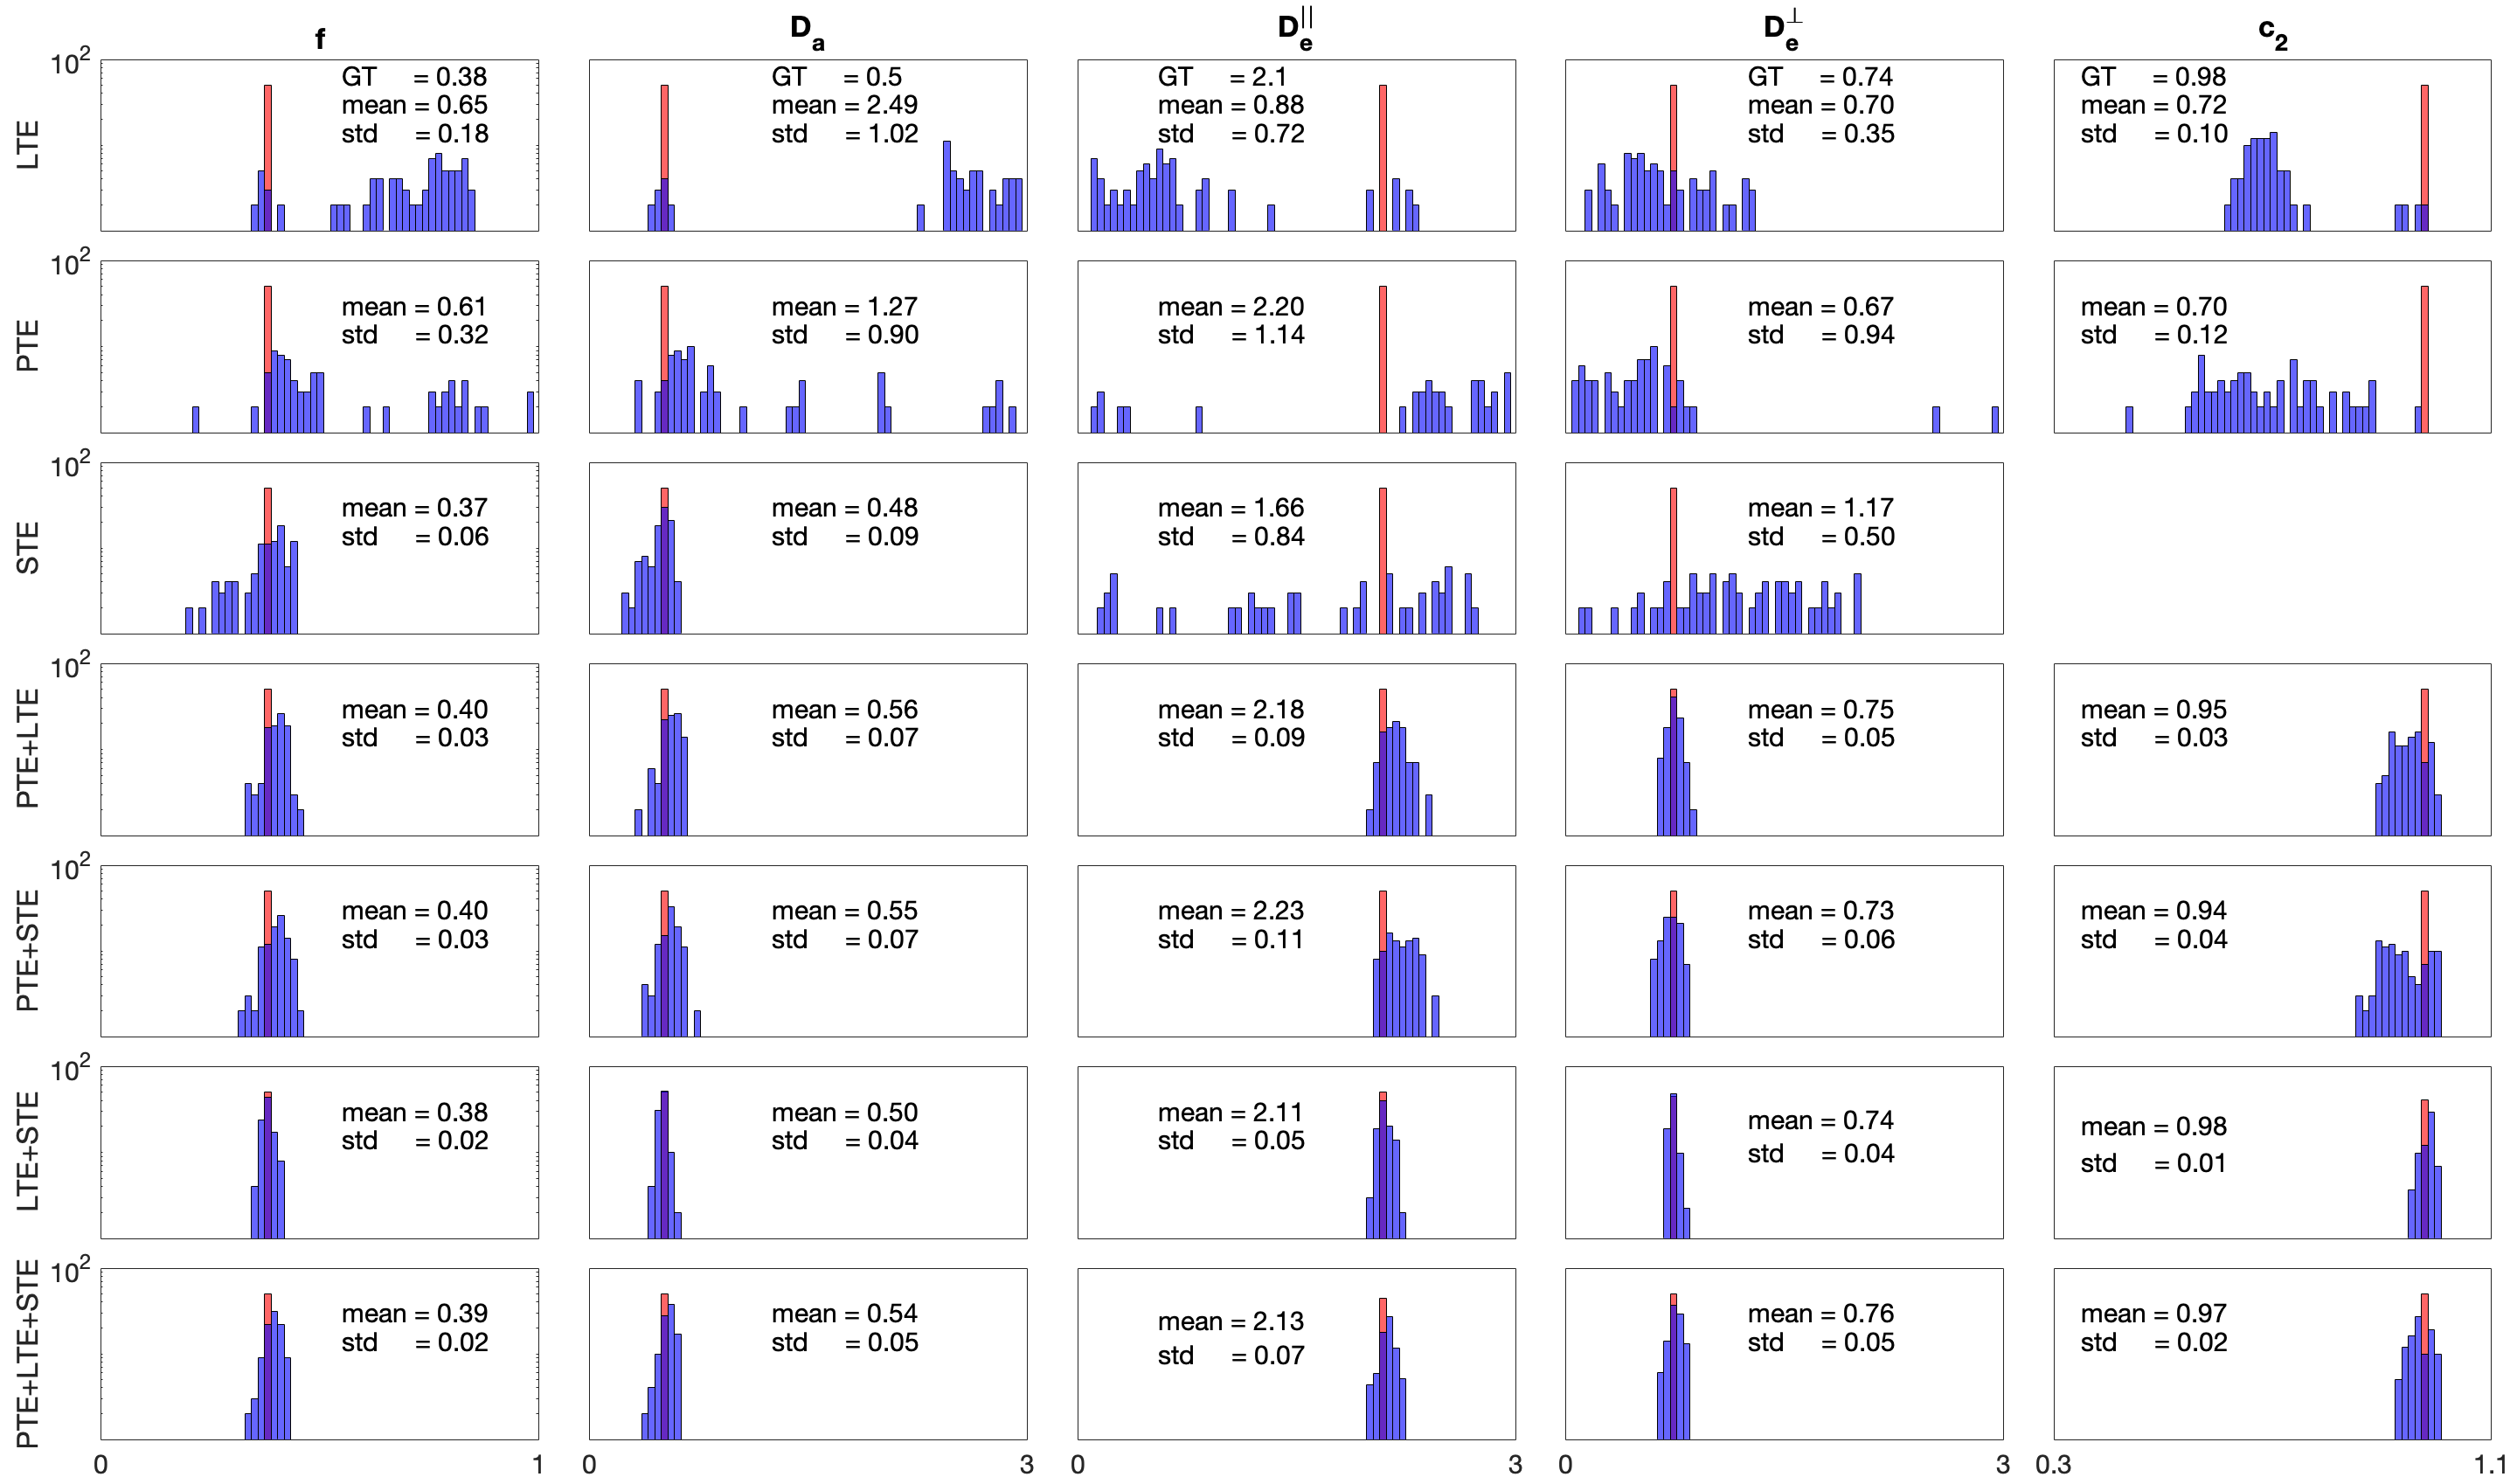
Fig. 2. Histograms of the MIX fit of set A. A single diffusion encoding leads to a spurious solution in addition to the true one while combining different tensor encodings removes the second cluster of solutions.