0059
In-vivo Neural Soma Imaging Using B-tensor Encoding and Deep Learning1Centre for Medical Image Computing, University College London, London, United Kingdom, 2Great Ormond Street Institute of Child Health, University College London, London, United Kingdom, 3Siemens Healthcare Ltd, Frimley, United Kingdom
Synopsis
Diffusion MRI is successfully used to map white matter in the brain. In this work we develop a new clinically viable technique with particular focus on grey matter microstructure. To capture the heterogeneous morphology of grey matter, it is imperative to disentangle cylindrical and spherical geometries commonly attributed to neurites and neural soma. We achieve this by leveraging the latest advances in B-tensor encoding and deep learning techniques and present microstructural feature maps of neurites and neural soma in-vivo in the human brain.
Introduction
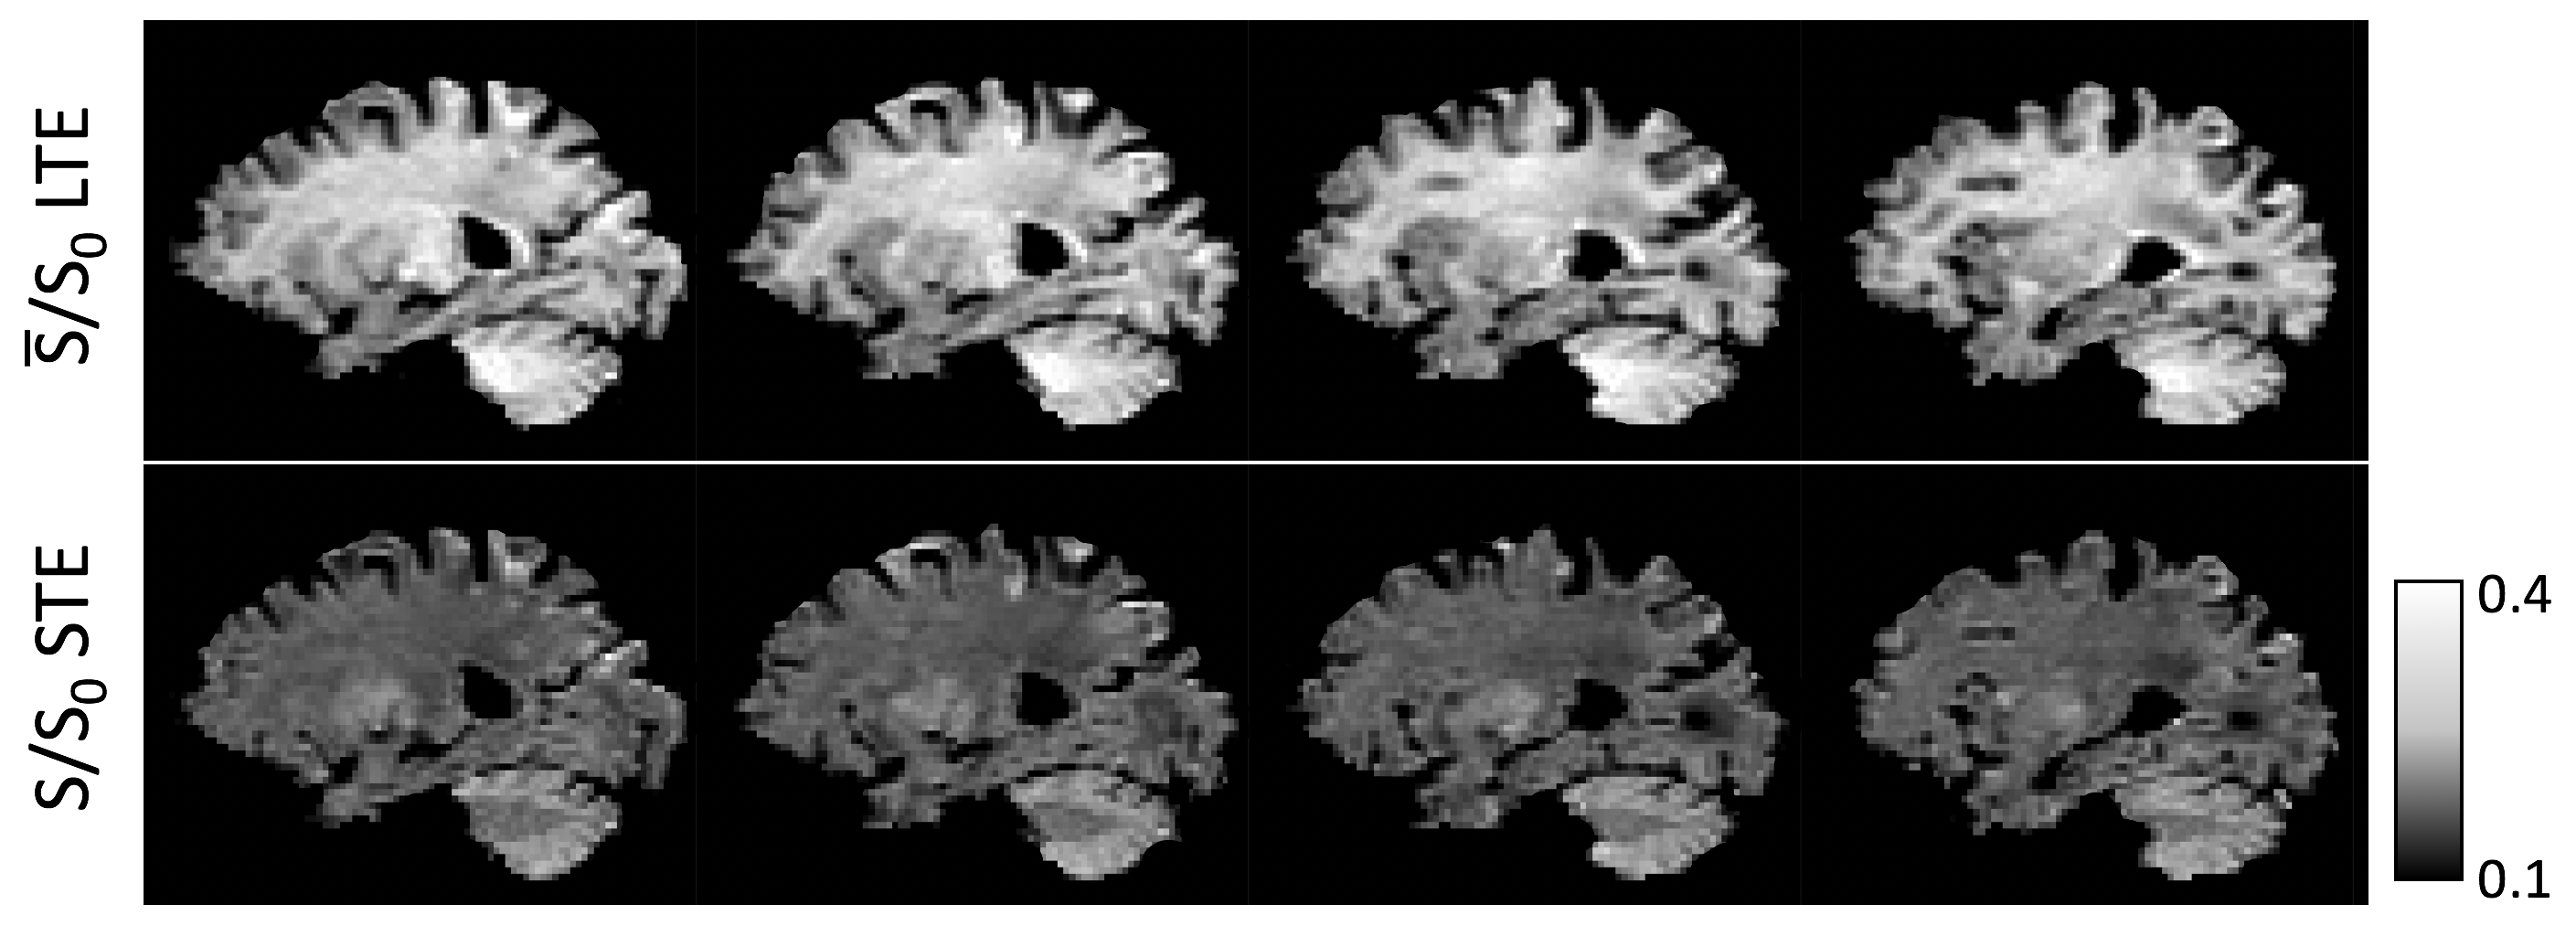
B-tensor encoding is a diffusion MRI technique that enables us to distinguish between different types of tissue heterogeneity such as microscopic shape anisotropy and compartment size1,2. To disentangle different signal contributors, measurements using different gradient waveforms are combined3,4. The key observation here is that the signal obtained from spherical (isotropic) tensor encoding (STE) and from the spherical mean of linear tensor encoding (LTE) give strikingly different contrast in the brain using otherwise identical measurement parameters. Figure 1 demonstrates this contrast inversion, whereby in LTE the signal is higher in white matter and lower in grey matter, whereas in STE the signal is higher in grey matter and lower in white matter.
Previous work suggests that STE is sensitive to spherical compartments of vanishing diffusivity5, and that the presence of cell bodies influences LTE simulations and measurements6,7. In this work, we combine STE and LTE diffusion acquisitions and exploit contrast inversion to map microstructural markers of neurites and neural soma in grey matter. We use a deep-learning neural network to estimate four independent tissue parameters: neurite volume fraction and diffusivity, and neural soma volume fraction and diffusivity.
Methods
Data acquisition
Healthy volunteers were scanned on a 3T Siemens Prisma scanner using a 64-channel head coil. Isotropic 2 mm voxels were acquired with TE=94 ms and TR=9.2 s for both waveforms. B-values of [0, 500, 1000, 1500, 2000] s/mm2 were measured for STE, and b-values of [0, 1000, 2000, 3500, 5000] s/mm2 were measured for LTE, as higher b-values are achievable in LTE within the same TE. STE was designed using Maxwell-compensated optimisation8,9 and LTE was made using symmetric trapezoidal pulses.
Neural soma model
To map neural soma, we use a microstructural model similar to Ref. 10 consisting of three compartments: cylinders representing neurites, spheres representing neural soma, and extracellular space. In LTE, the signal depends on the direction of diffusion gradients and the orientation of microcompartments. To factor out this effect, we take the spherical mean over gradient directions11,12. The resulting mean signal for a given b-value is $$\frac{\bar{S}_{LTE}(b)}{S_0} = v_{sph}\exp(-b\lambda_{sph})+v_{cyl}\frac{\sqrt{\pi} \text{erf}(\sqrt{b\lambda})}{2\sqrt{b\lambda}}+v_{ext}\exp(-b\lambda_\perp^{ext})\frac{\sqrt{\pi}\text{erf}\big(\sqrt{b(\lambda_\parallel^{ext}-\lambda_\perp^{ext})}\big)}{2\sqrt{b(\lambda_\parallel^{ext}-\lambda_\perp^{ext})}}$$where $$$v_x$$$ are the volume fractions satisfying $$$v_{cyl}+v_{sph}+v_{ext}=1$$$ and erf is the error function. $$$\lambda_{sph}$$$ is the diffusivity of spherical compartments and $$$\lambda_{\parallel}^{ext}$$$, $$$\lambda_{\perp}^{ext}$$$ are the parallel and perpendicular diffusivities of extracellular space. We assume that the perpendicular diffusivity of cylinders is zero and the parallel diffusivity is the intrinsic neural diffusivity $$$\lambda$$$. In STE, diffusion weighting is isotropic and there is no dependence on compartment orientation. The signal is $$\frac{S_{STE}(b)}{S_0} = v_{sph}\exp(-b\lambda_{sph})+v_{cyl}\exp\big(-\frac{b}{3}\lambda\big)+v_{ext}\exp\big(-\frac{b}{3}(\lambda_\parallel^{ext}+2\lambda_\perp^{ext})\big)$$ where b is the trace of the diffusion weighting b-tensor. To reduce the number of free parameters, we model extracellular diffusivities $$$\lambda_\parallel^{ext}$$$ and $$$\lambda_\perp^{ext}$$$ using a tortuosity approximation10. We also assume that $$$\lambda_{sph}<\lambda$$$ due to compartment restriction.
Model parameter estimation
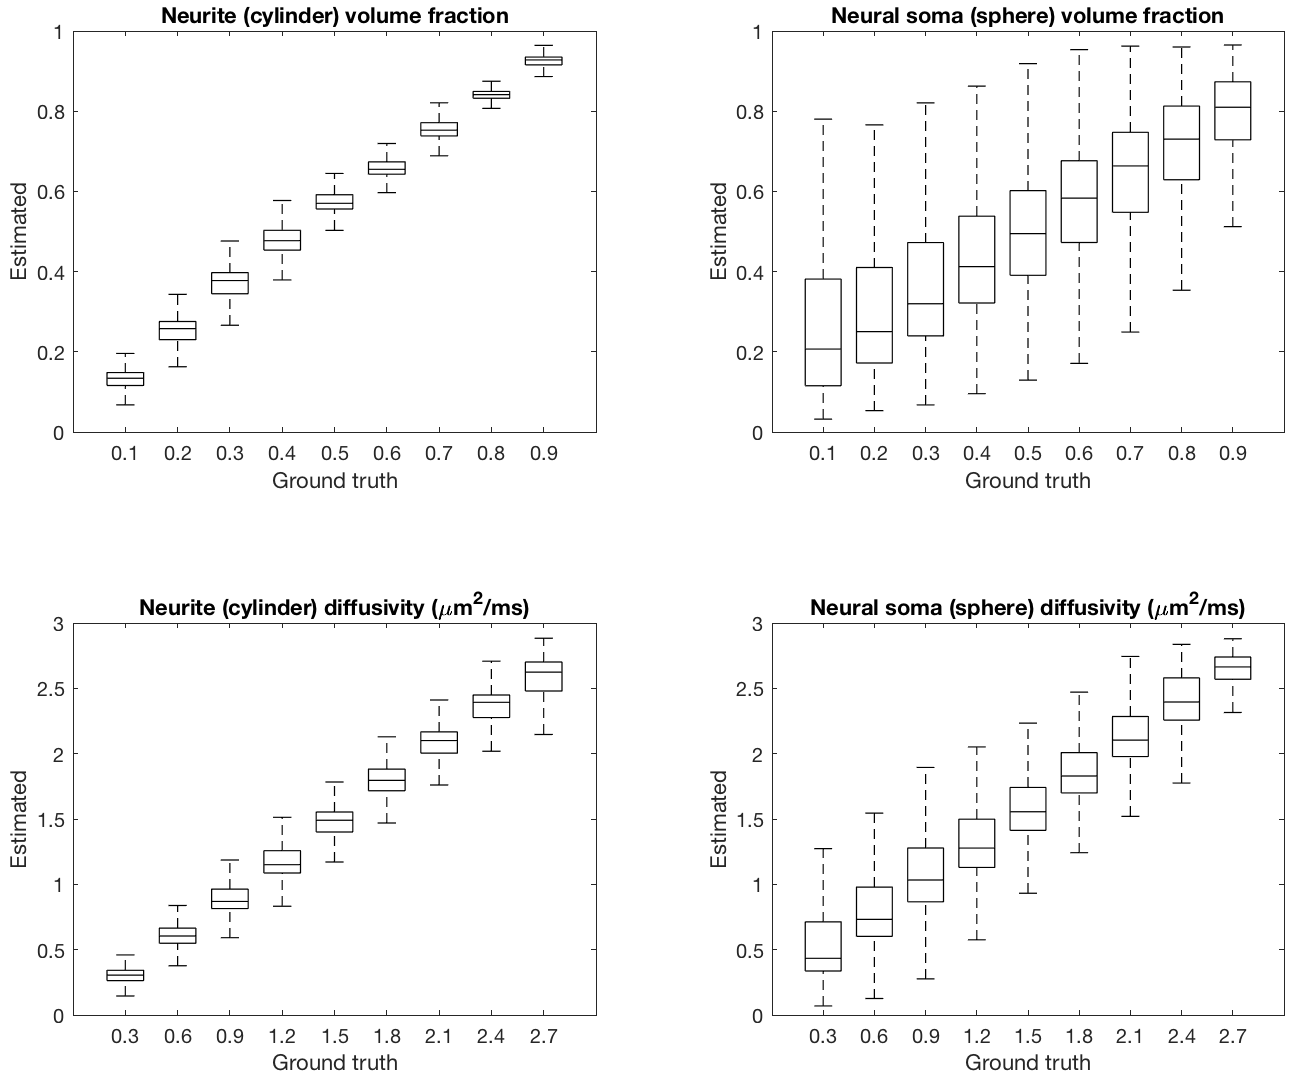
To estimate model parameters, a neural network of three fully connected layers with rectified linear unit activation functions was used. Training was done on a synthesised dataset using a mean square error loss criterion and a stochastic gradient descent optimiser. The model parameters in the training dataset were kept within biophysically plausible ranges, i.e. $$$v_{sph}\in[0,1]$$$, $$$\lambda\in[0,3]$$$ μm2/ms and $$$\lambda_{sph}\in[0,\lambda]$$$.
Results and Discussion
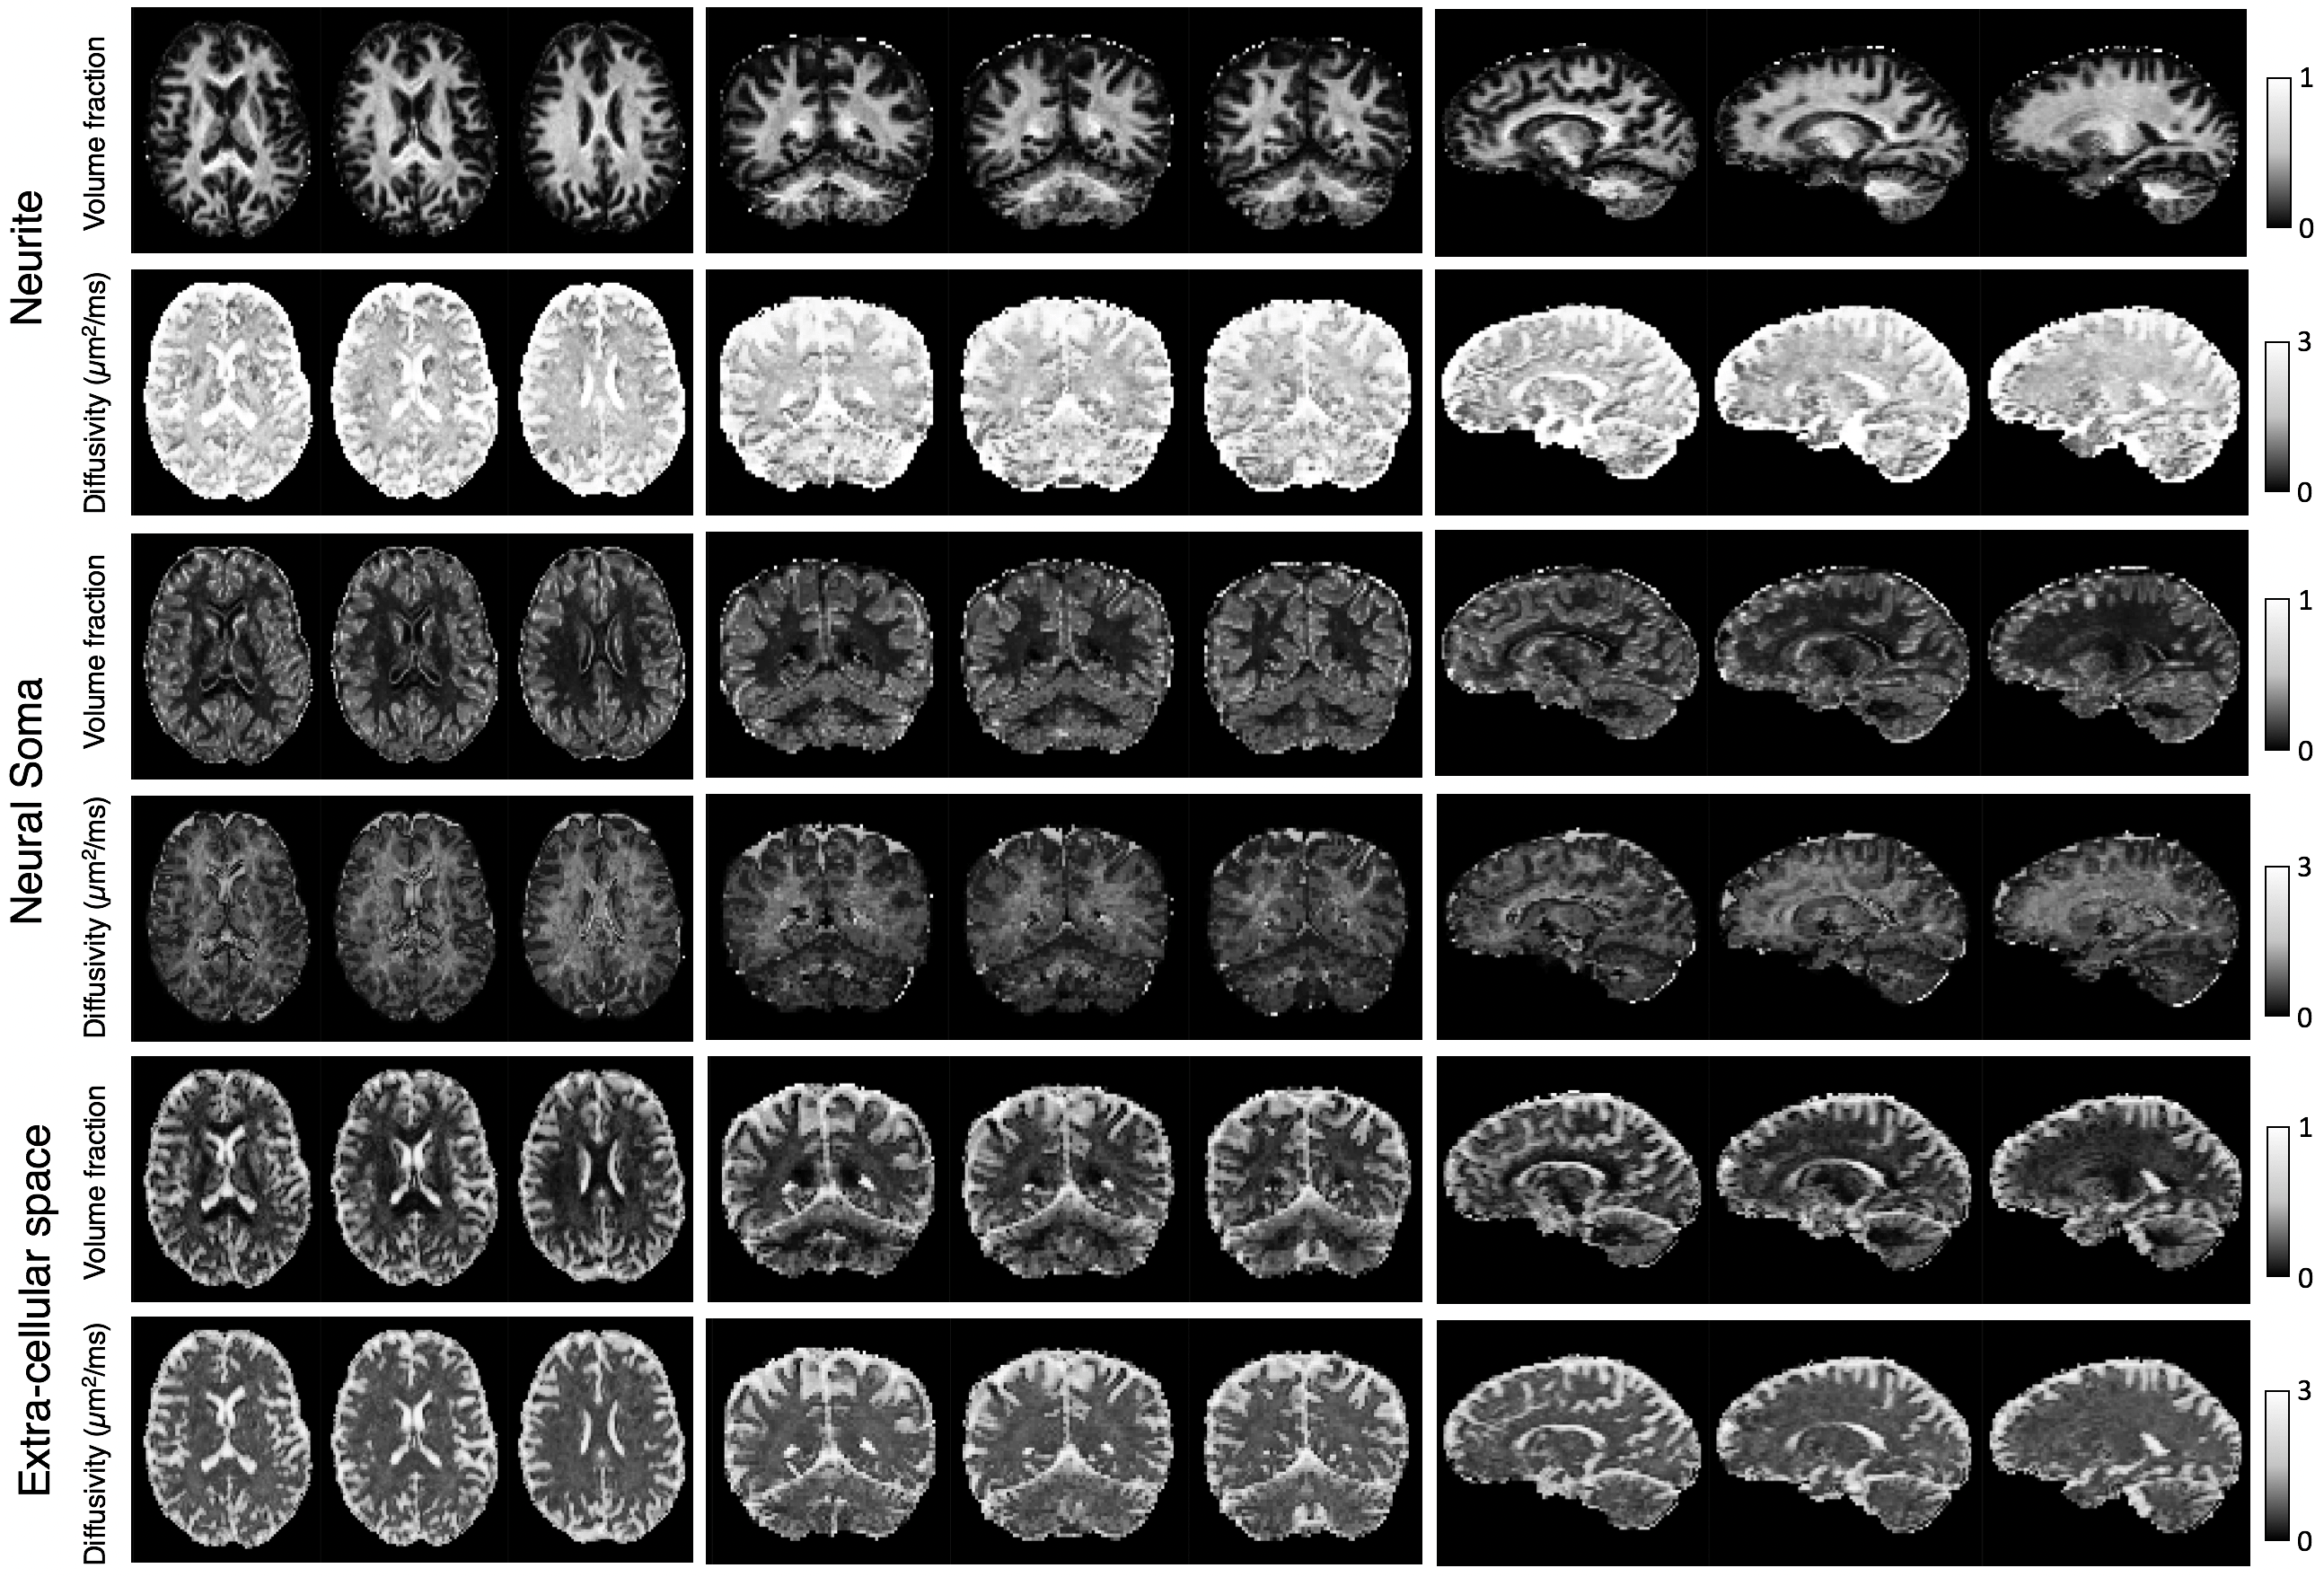
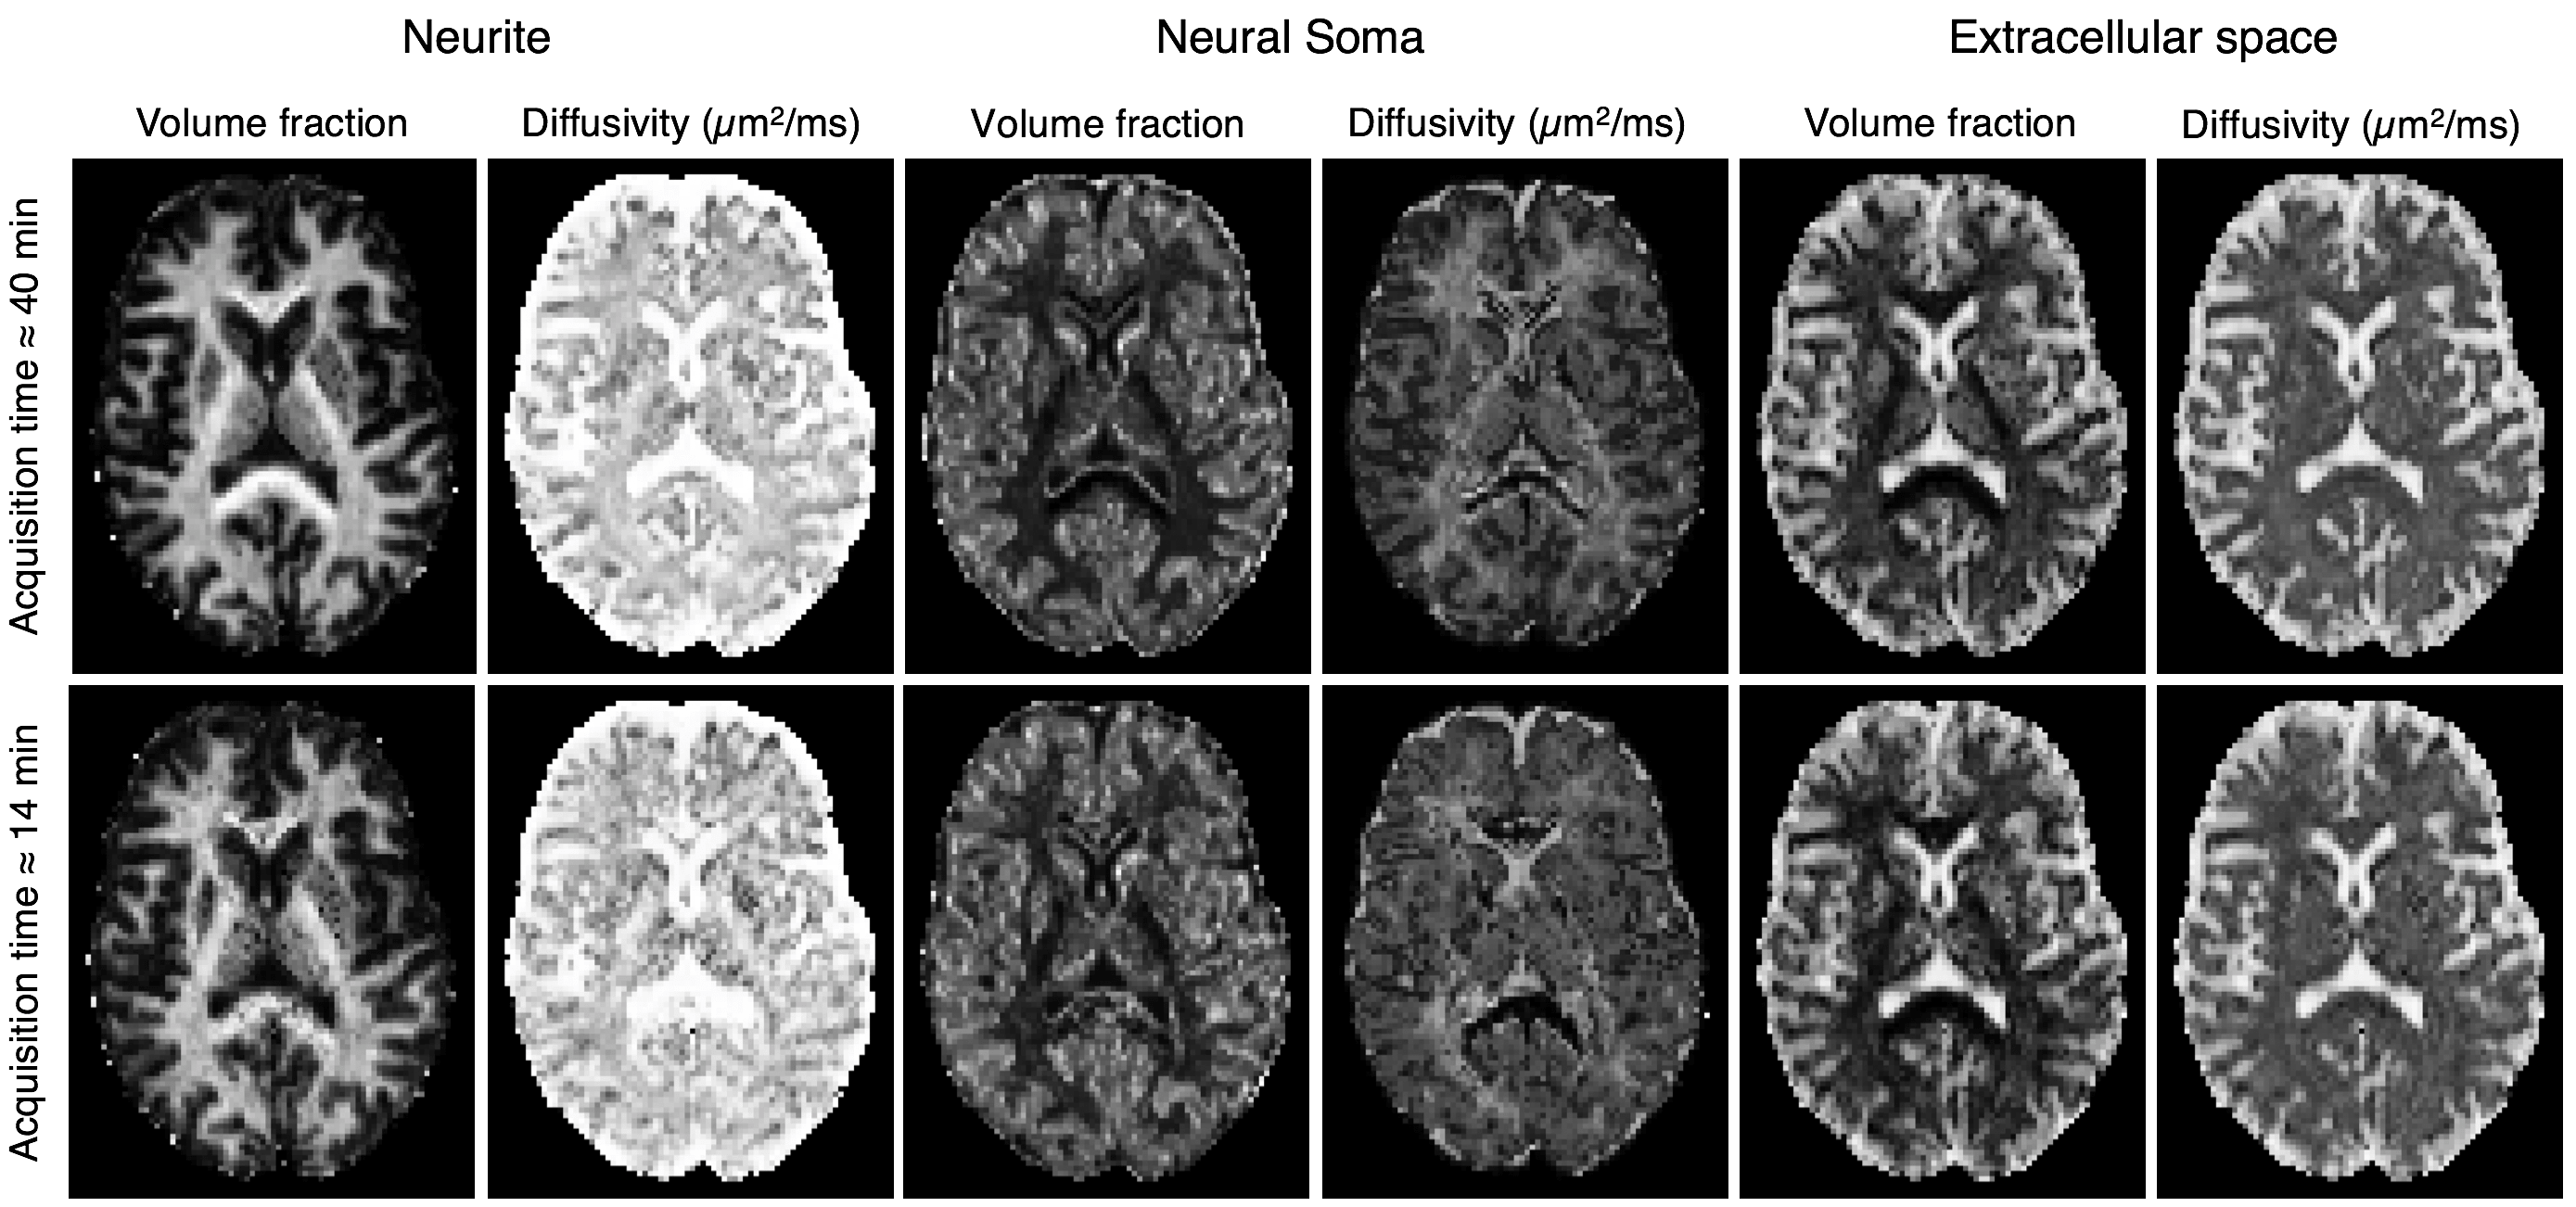
To check that the trained neural network can recover model parameters, a test dataset was evaluated. Figure 2 shows that parameters are estimated with reasonable accuracy. For imaging grey matter, we suggest that cylindrical and spherical compartments are markers for neurites and neural soma and show parameter maps of compartment volume fractions and diffusivities (Figure 3). As expected, neurite volume fraction is high in white matter and low in grey matter. The maps also show high volume fraction of spherical compartments in both the cerebellar and cerebral cortex, which in agreement with well-known neuroanatomy presumably reflects neural soma in grey matter. In Figure 4, we demonstrate that these methods are robust for clinically viable acquisition times. We compare maps from a full dataset (~40 minutes) with maps using one third of the acquired gradient directions (~14 minutes). Similar results are found for five further subjects (not shown).Conclusion
This work demonstrates that cylindrical and spherical compartments can be disentangled using B-tensor encoding. These geometries putatively reflect neurites and neural soma in brain grey matter. The density of neural soma may be used as a novel biomarker for neurodegenerative diseases such as Alzheimer’s and Parkinson's disease. Data was obtained on a clinical system using realistic measurement times that could be shortened to as low as five minutes with multiband EPI13. With deep learning, model parameters can be estimated in seconds, and hence the methods described here can easily be translated to everyday clinical use.Acknowledgements
The authors thank the London Interdisciplinary Bioscience PhD Consortium and the following grants for funding: BBSRC BB/M009513/1, UK EPSRC EP/M020533/1, EP/N018702/1 and EU H2020 634541-2. We also thank Filip Szczepankiewicz and Markus Nilsson for sharing their free-waveform diffusion EPI sequence.References
[1] Topgaard, D. (2017), Multidimensional diffusion MRI. Journal of Magnetic Resonance, 275, 98-113.
[2] Westin, C.-F., Knutsson, H., Pasternak, O., Szczepankiewicz, F., Ozarslan, E., van Westen, D., Mattisson, C., Bogren, M., O’Donnell, L. J., Kubicki, M. (2016), Q-space trajectory imaging for multidimensional diffusion MRI of the human brain. NeuroImage, 135, 345-362.
[3] Lasic, S., Szczepankiewicz, F., Eriksson, S., Nilsson, M., Topgaard, D. (2014), Microanisotropy imaging: quantification of microscopic diffusion anisotropy and orientation order parameter by diffusion MRI with magic-angle spinning of the q-vector. Frontiers in Physics, 2: 11.
[4] Eriksson, S., Lasic, S., Topgaard, D. (2013), Isotropic diffusion weighting in PGSE NMR by magic-angle spinning of the q-vector. Journal of Magnetic Resonance, 226, 13-18.
[5] Tax, C. M. W., Szczepankiewicz, F., Nilsson, M., Jones, D. (2018), The Dot… wherefore art thou? Search for the isotropic restricted diffusion compartment in the brain with spherical tensor encoding and strong gradients. ISMRM 2018, Paris, France.
[6] Palombo, M., Shemesh, N., Ianus, A., Alexander, D. C., Zhang, H. (2018a), A compartment based model for non-invasive cell body imaging by diffusion MRI. ISMRM 2018, Paris, France.
[7] Palombo, M., Shemesh, N., Ianus, A., Alexander, D. C., Zhang, H. (2018b), Abundance of cell bodies can explain the stick model’s failure in grey matter at high b-value. ISMRM 2018, Paris, France.
[8] Sjolund, J., Szczepankiewicz, F., Nilsson, M., Topgaard, D., Westin, C. F., Knutsson, H. (2015), Constrained optimization of gradient waveforms for generalized diffusion encoding. Journal of Magnetic Resonance, 261, 157-168.
[9] Szczepankiewicz, F., Nilsson, M. (2018), Maxwell-compensated waveform design for asymmetric diffusion encoding, ISMRM 2018, Paris, France.
[10] Stanisz, G. J., Szafer, A., Wright, G. A., Henkelman, R. M., (1997), An analytical model of restricted diffusion in bovine optic nerve. Magnetic Resonance in Medicine, 37, 103-111.
[11] Kaden, E., Kruggel, F., Alexander, D. C. (2016a), Quantitative mapping of the per-axon diffusion coefficients in brain white matter. Magnetic Resonance in Medicine, 75, 1752-1763.
[12] Kaden, E., Kelm, N. D., Carson, R. P., Does, M. D., Alexander, D. C. (2016b), Multi-compartment microscopic diffusion imaging. NeuroImage, 139, 346-359.
[13] Setsompop, K., Gagoski, B. A., Polimeni, J. R., Witzel, T., Wedeen, V. J., Wald, L. L. (2012), Blipped-controlled aliasing in parallel imaging for simultaneous multislice echo planar imaging with reduced g-factor penalty. Magnetic Resonance in Medicine, 67:5, 1210-1224.
Figures