0056
Estimating compartment- and cell-specific microscopic anisotropy in the human brain using double-diffusion encoding spectroscopy at 7T1Radiology, C.J. Gorter Center for High Field MRI, Department of Radiology, Leiden, Netherlands, 2Danish Research Centre for Magnetic Resonance, Copenhagen University Hospital Hvidovre, Hvidovre, Denmark
Synopsis
Double diffusion encoding spectroscopy (DDES) offers the unique ability to estimate compartment and cell-specific micro-anisotropy (μFA) in vivo. Recently, this method allowed the estimation of intracellular micro-anisotropy in the white matter. Here, we propose to measure the μFA in different diffusion weighting settings to explore intra- and extracellular μFA in both white (WM) and grey matter (GM). We show that intracellular μFA is similar in both WM and GM, but extracellular space in WM is significantly more anisotropic compared to GM.
Introduction
Diffusion-weighted imaging and spectroscopy using double diffusion encoding (DDE) offer the unique ability to estimate tissue microscopic anisotropy (μFA) in vivo [1-6]. Previous reports demonstrated that the majority of the intracellular space consists of “neurites” (e.g. axons and astrocytic processes) in both grey matter (GM) and white matter (WM), across cell-types [7,8], resulting in a very high intracellular μFA [3]. The manner in which the organization of cells and their processes defines the microstructural features of the extracellular space still remains poorly understood. As opposed to water, brain metabolites are primarily confined inside cells [9,10], thus providing a microstructural marker unique to the intracellular space. Measuring side-by-side water and brain metabolites μFA in different diffusion weighting settings offers a reading of intra- and extracellular μFA. Here, we performed DDE measurements of water and brain metabolites μFA at short diffusion and mixing times (~30-40ms) in both GM and WM. While the metabolite DDES measurements provide a benchmark for the intracellular μFA in both tissue types, water DDES measurements using a wide range of b values enable the gradual elimination of the extracellular contribution. We show that while the intracellular μFA is similar in WM and GM, the extracellular μFA in WM is significantly more anisotropic compared to GM.Materials and Methods
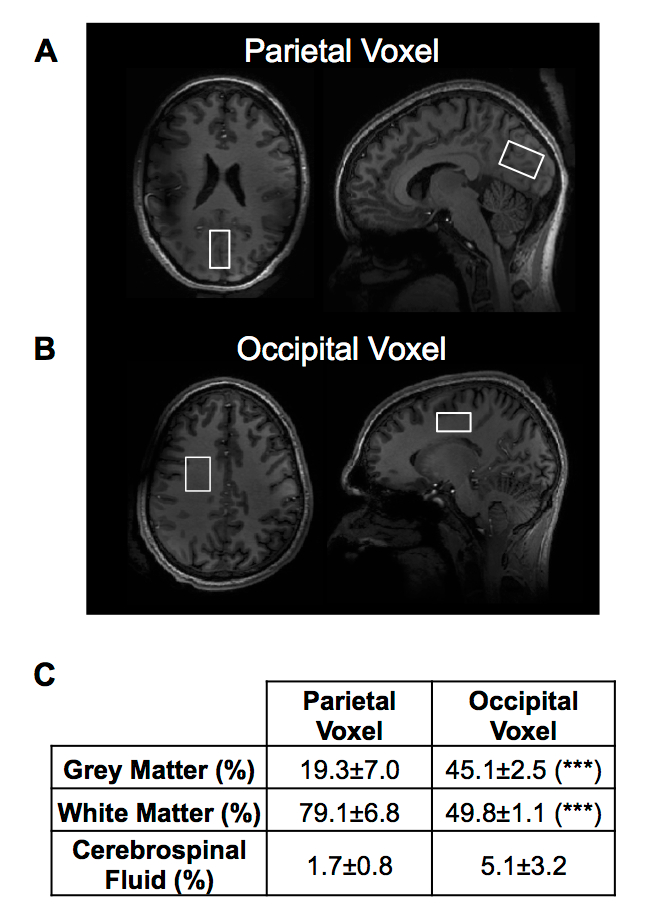
Acquisition: Experiments were performed on 8 healthy volunteers (31±11y/o) using a Philips 7T whole body MRI scanner (Philips Healthcare, The Netherlands) equipped with a volume transmit/32-channel receive head coil (Nova Medical, USA). A 3D-T1W gradient-echo acquisition (TR/TE=5/2ms, resolution=1x1x1mm3) was used for planning of the voxels-of-interest (VOIs). A 9mL VOI was positioned either in a white matter region within the parietal lobe (n=4, Fig.1A) or within the occipital cortex (n=3, Fig.1B). DW-MRS data were acquired using a sLASER-DDE sequence (TR/TE=5 cardiac cycles/185ms, single gradient duration (δ/2)=15.5ms, bipolar gap (τ)=10ms and Δ=45ms). Cardiac gating was achieved using a pulse-oximeter. As previously described [3], the first gradient was set either to [1,1, -0.5], [-0.5, 1, 1] or [1, -0.5, 1]. The second gradient was given 8 equally spaced directions (θ) tracing a circle that included the first gradient direction. For water acquisitions, 4 gradient strengths were used, resulting in 4 b values (918, 2066, 4050 and 7199s/mm2) and each condition was repeated twice. For metabolite acquisitions, data were acquired at b=7199s/mm2 and each condition was repeated six times. Data were acquired with positive and negative diffusion gradients to compensate for cross-terms between diffusion and imaging/background gradients [11,12].
Analysis: Individual spectra were corrected for eddy currents, phase and frequency variations using in-house Matlab routines. The water signal was integrated using Matlab and tNAA/tCr/tCho levels were quantified using LCModel [13] for each b value, θ condition and gradient polarity. Modeling was done using Matlab as previously described [3]. Anatomical images were segmented using FSL (Brain Extraction Tool [14]) and Matlab to quantify the volume fraction of WM, GM and cerebrospinal fluid (CSF) per VOI.
Results and Discussion
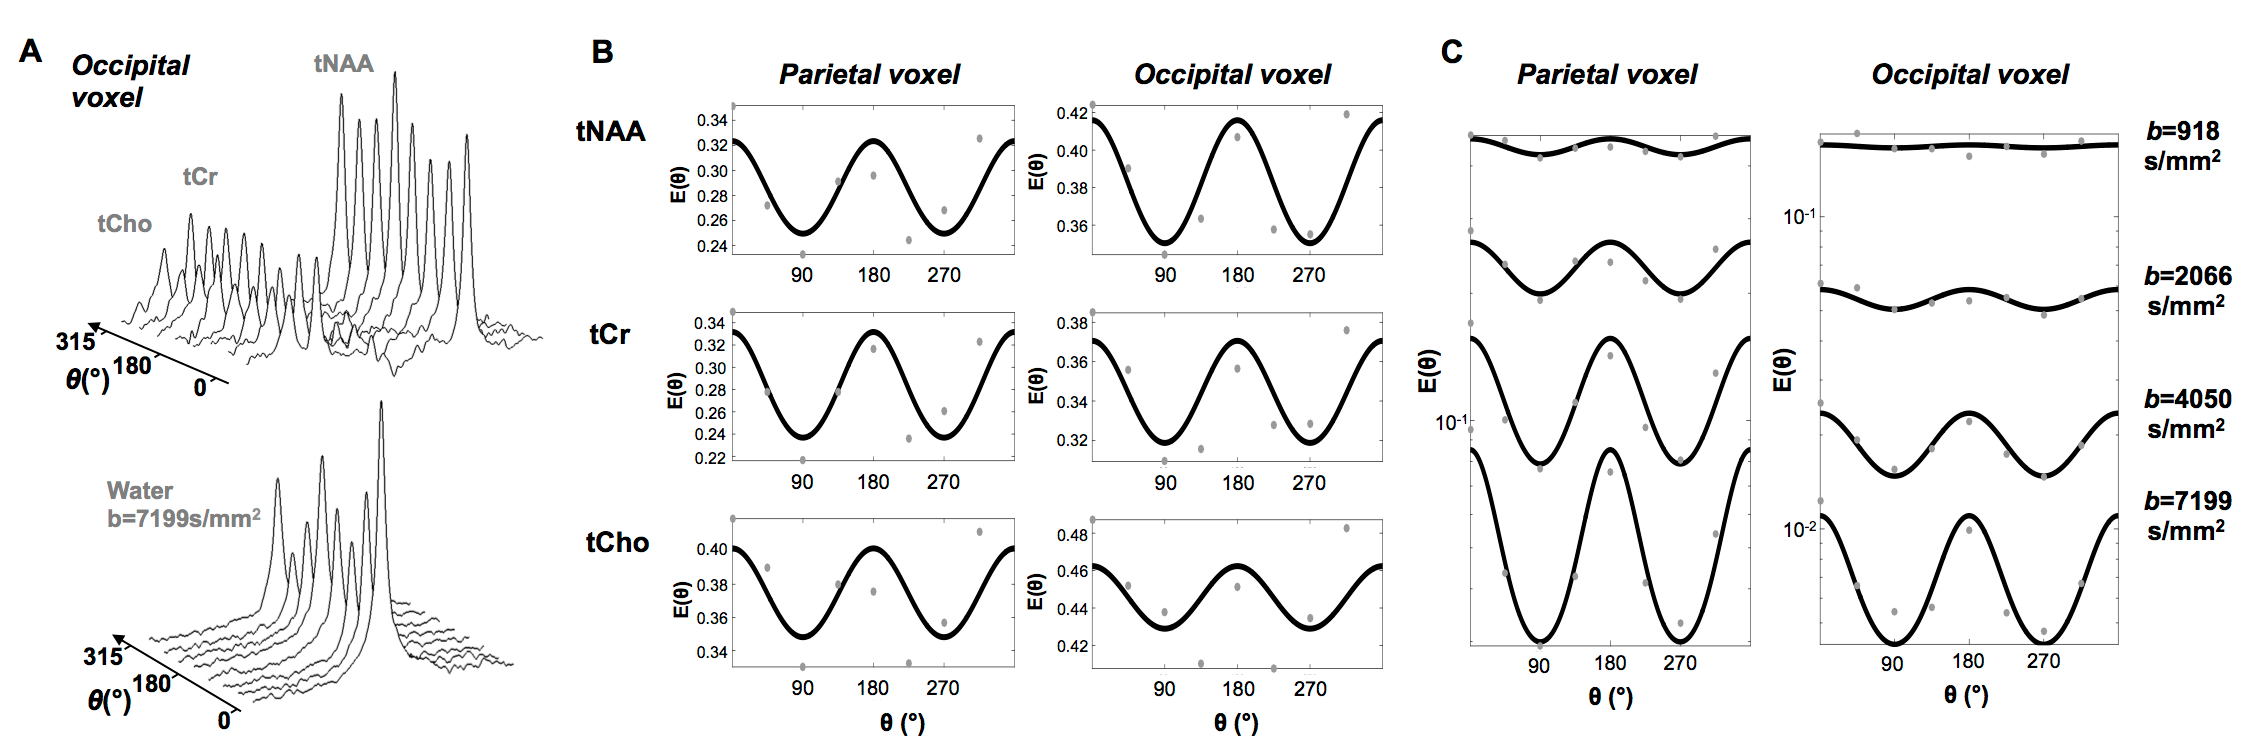
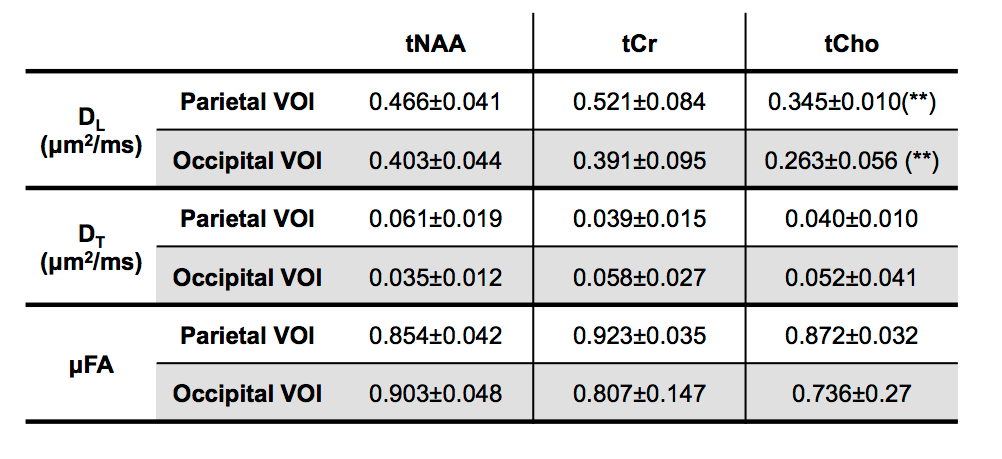
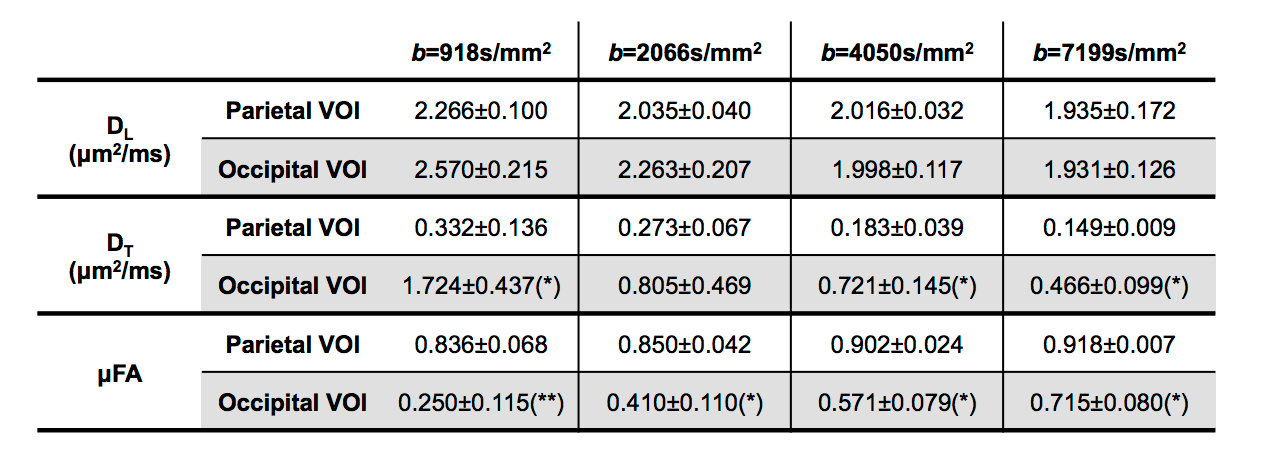
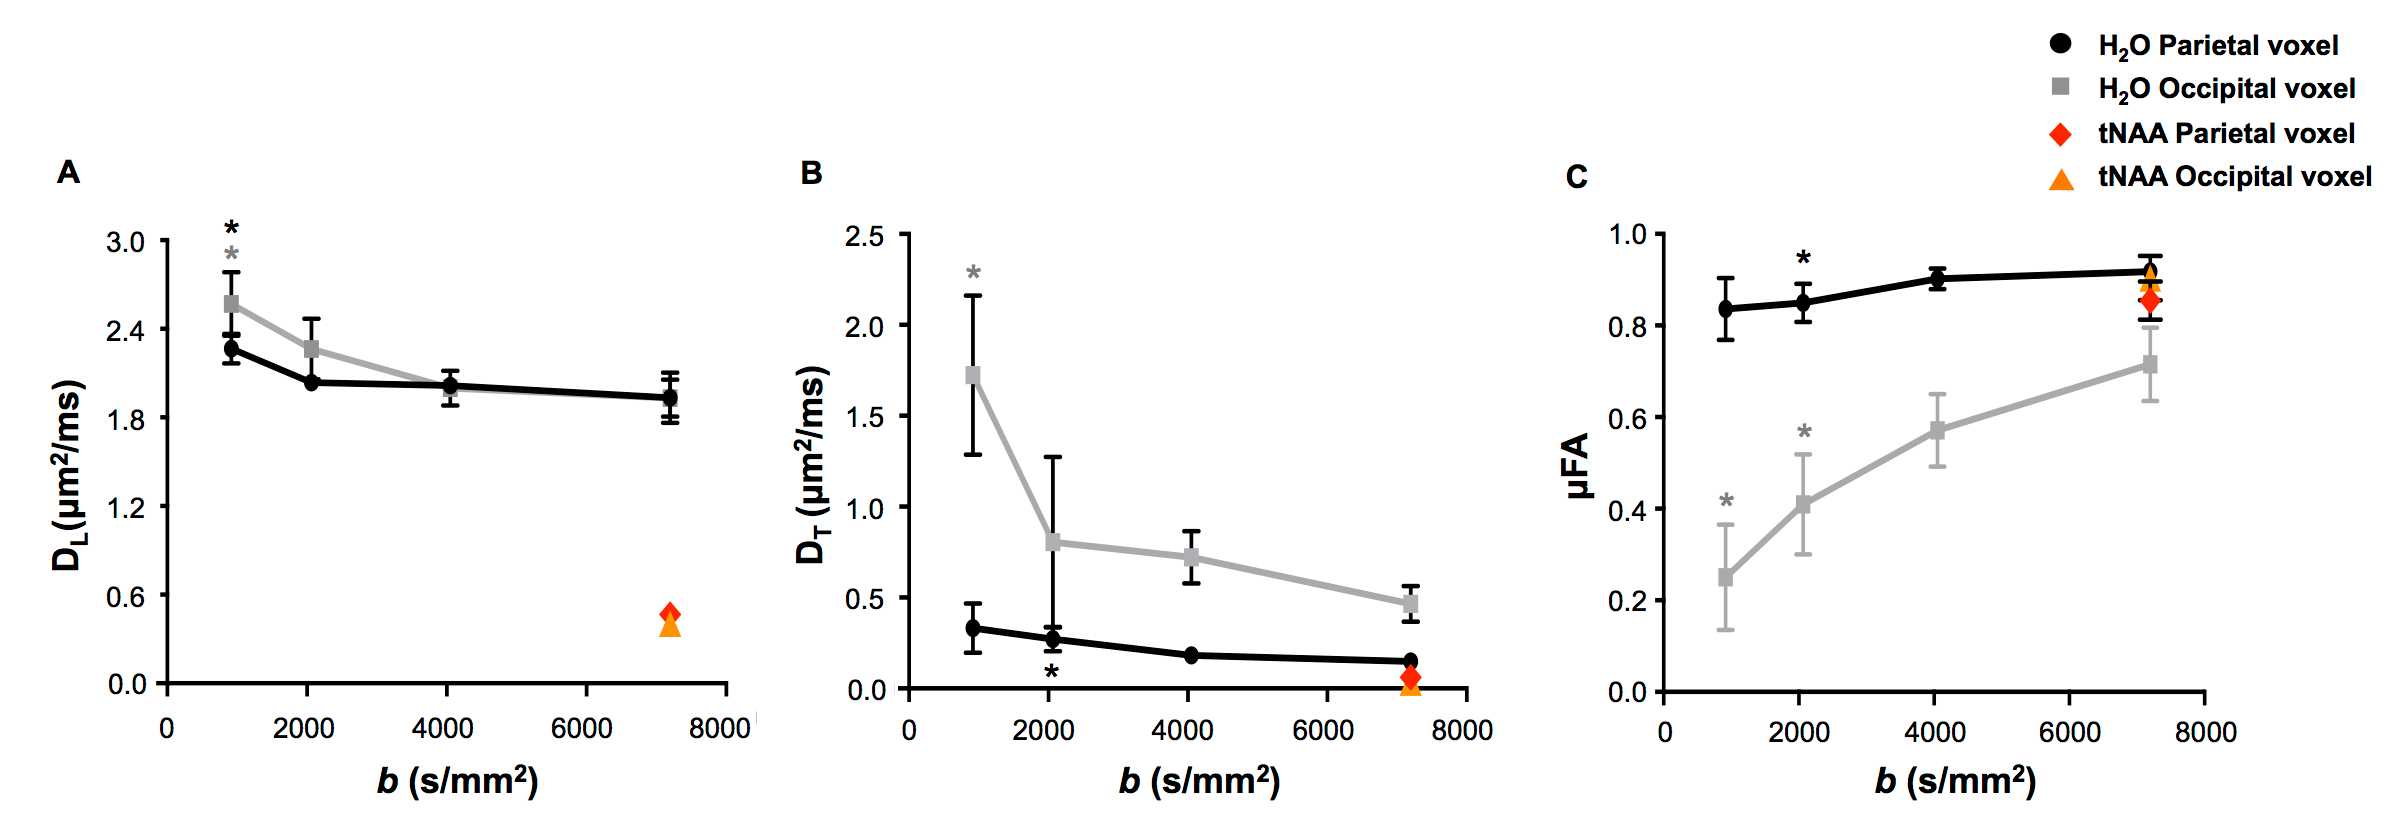
The parietal VOI contained mostly WM, whereas occipital VOI contained an equal amount of GM and WM (Fig.1C). Representative metabolite DDES data are shown in Fig.2A. Fitted θ-modulations (Fig.2B), and the resulting DL, DT and μFA for tNAA, tCr and tCho in both VOIs are shown in Fig.3. DL(tCho) was significantly lower compared to tNAA in both VOIs, possibly due to the specific compartmentation of tCho in astrocytes and tNAA in neurons. No significant differences were observed between metabolite μFA in both VOIs. At very high b (7199s/mm2), parietal water μFA was about 0.9, similar to metabolite μFA in both VOIs (Fig.2/4). This suggests that the extracellular compartment at very high b is essentially fully suppressed [15]. In the occipital VOI, water μFA at the highest b value was significantly lower compared to parietal VOI (Fig.4/5), suggesting that intercompartmental exchange might play a role in GM, even at relatively short mixing/diffusion times. At low b values, water μFA was significantly decreased in both VOIs (Fig.5), indicating that the extracellular space is less microscopically anisotropic in both GM and WM. At the lowest b, water μFA in the parietal VOI was four times higher compared to the occipital VOI (Fig.4), showing that the extracellular space in WM is highly anisotropic, or conversely, that the tortuosity in the direction perpendicular to the fiber propagation direction significantly affects water diffusion.Conclusion
We illustrated how DDES can be used to study cell-specific and compartment-specific micro-anisotropy in the human brain across tissue types. A comprehensive model is needed to account for transmembrane exchange and other exchange processes, e.g. between branches in highly arborized cells such as protoplasmic astrocytes in GM.Acknowledgements
No acknowledgement found.References
[1] Ianus et al., NeuroImage 2018; [2] Lawrenz et al., MRM 2018; [3] Lundell et al., ISMRM 2018; [4] Shemesh et al., MRM 2016; [5] Lasič et al., Front. Phys. 2014; [5] Jespersen et al., NMR Biomed 2013; [7] Najac et al., Brain Struct. Funct. 2016; [8] Palombo et al., PNAS 2016; [9] Urenjak et al., J. Neurosci. 1993; [10] Choi et al., NMR Biomed. 2007; [11] Neeman et al., J. Magn. Res 1969; [12] Zhong et al., J. Magn. Res 1991; [13] Provencher et al., MRM 1993; [14] Smith, Hum. Brain Mapp 2002; [15] Veraart et al., NeuroImage 2018Figures