0053
LFP-triggered Co-activation Patterns Show That the Relationship between LFP and BOLD Is Driven by a Few Distinct Events1Biomedical Engineering, Georgia Institute of Technology and Emory University, Atlanta, GA, United States
Synopsis
To gather electrophysiological evidence of time-varying functional networks, we developed a new method to analyze simultaneous fMRI and LFP data, which averages the fMRI frames at LFP power higher or lower than a threshold. The results not only show that the correlation between LFP power and BOLD is driven by a few distinct instead of a continuous interaction, but also suggests that the non-stationary resting state networks found in fMRI studies represent the time-varying behavior of LFPs.
Purpose
Recent resting state fMRI (rs-fMRI) studies have shown that the inter-regional BOLD correlation is driven by a few discrete events that have the highest amplitudes1,2. By solely using these frames of the time course, one can closely reproduce the spatial pattern seen in the cross correlation maps. This approach takes advantage of the rich information in the spatial domain, and reveals that the functional connectivity might be nonstationary. However, such an approach has not been employed in the analysis of simultaneous rs-fMRI and LFP measurements, which could provide an electrophysiological basis for the time-varying co-activation patterns. Here we introduce a new method called LFP-triggered co-activation and co-deactivation patterns (LFP-CAPs and LFP-CDAPs) to analyze simultaneous rs-fMRI and LFP data, and reveal that the correlation between LFP and BOLD signal is also driven by a few events.Methods
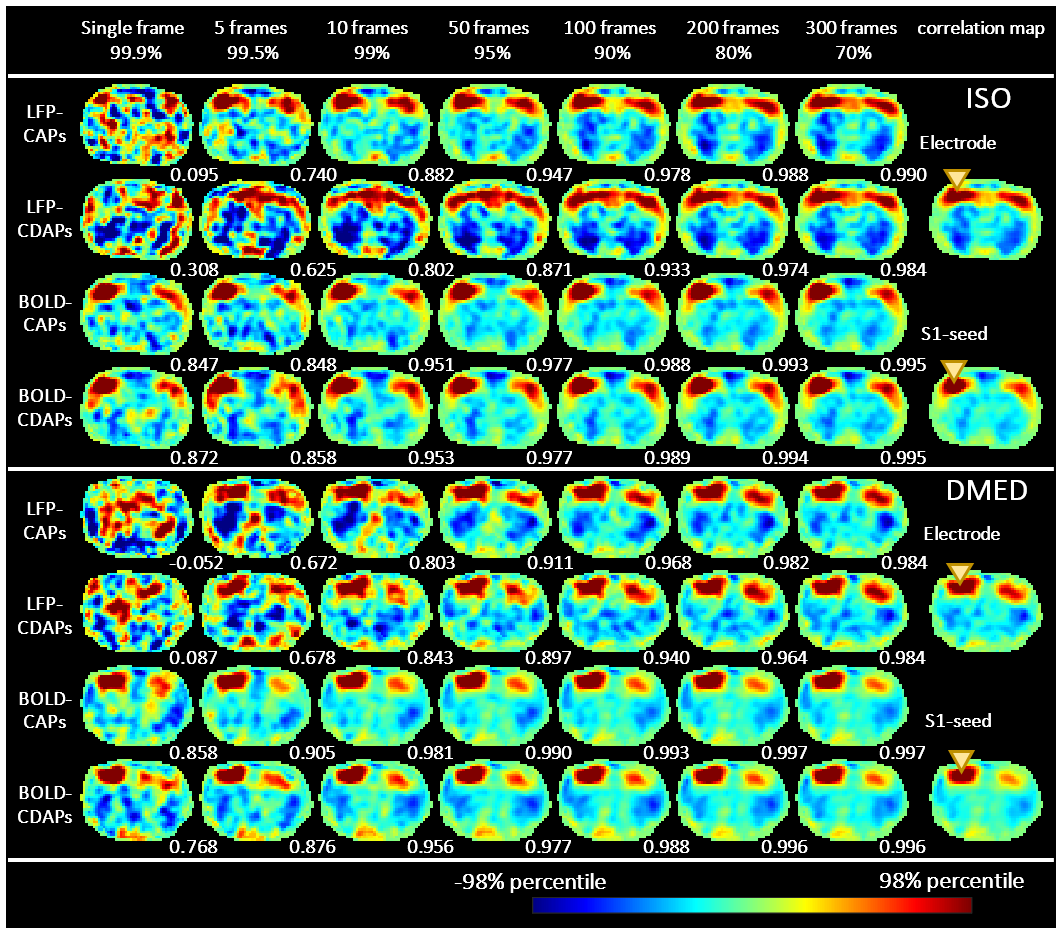
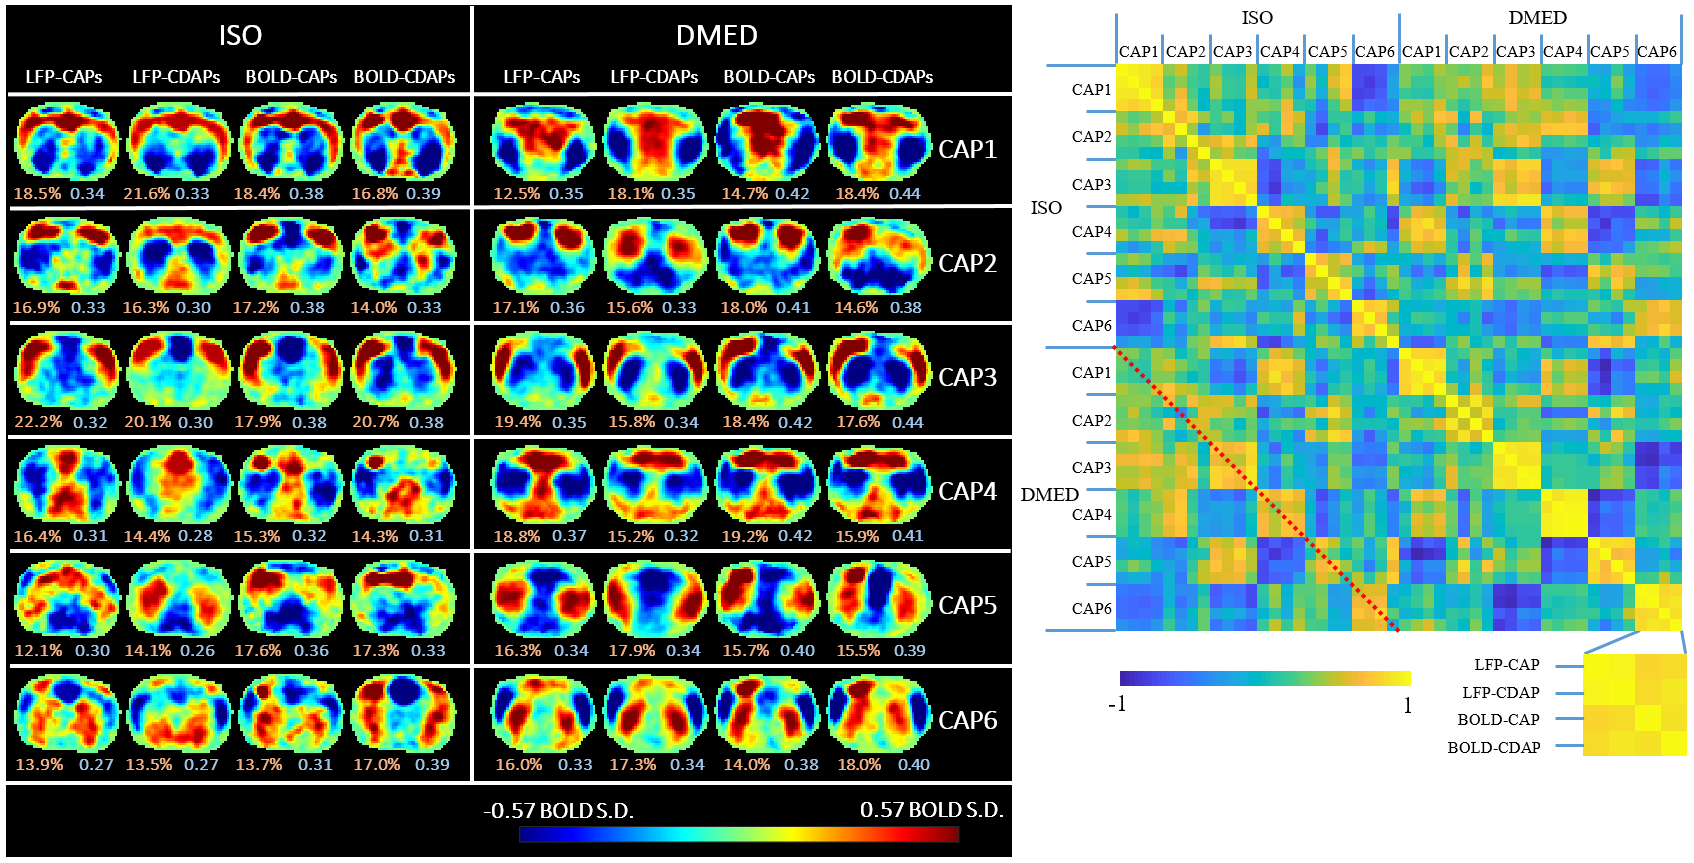
Experiments: Resting state-fMRI scans and LFP recordings were acquired simultaneously on 22 Sprague-Dawley rats, with 32 sessions from 12 rats under Isoflurane (ISO) ranging from 1.2% to 2%, and 22 sessions from 10 rats under dexmedetomidine (DMED) anesthesia (subcutaneous infusion stepping from 0.05 mg/kg/h to 0.15 mg/kg/h after 1.5 hours). Single slice gradient echo EPI scans were obtained on a 9.4T small animal MRI system (Bruker, Billerica, MA) with scan parameters: TR/TE = 500/15ms, voxel size = 0.3*0.3*2mm, matrix size=64*64, number of TR=1000. LFPs were recorded using glass electrodes placed on the primary somatosensory cortex (S1) in both hemispheres at a sampling rate of 12KHz. FMRI preprocessing: Motion-correction, spatially smoothing (FWHM=0.84mm), bandpass filtering (0.01~0.1Hz under ISO and 0.01~0.25Hz under DMED), global signal and linear trend regression were performed sequentially. LFP preprocessing: the gradient-induced artifacts was removed following established methods3 and the LFP time courses were low pass filtered to 100Hz. The LFP broadband power time courses were calculated by integrating the power spectral density (PSD) function estimated from a 1-second long sliding window, (which moves 0.5 second at each step to match the fMRI temporal resolution) and then band pass filtered (0.01~0.1Hz under ISO and 0.01~0.25Hz under DMED). LFP-CAPs: to calculate LFP-CAPs, first a threshold was applied to the LFP time course and the fMRI frames a certain lag (4 seconds under ISO, 2.5 seconds under DMED) after the LFP supra-threshold events were selected and averaged across sessions, producing spatial patterns showing the regions where the BOLD signal “co-activate” with the LFP power. The conventional correlation maps and the original co-activation patterns1 (referred to as the BOLD-CAPs) were also calculated for comparison. The selected frames were further separated into six groups using K-means clustering (with 1 minus correlation as the distance).Results and Discussions
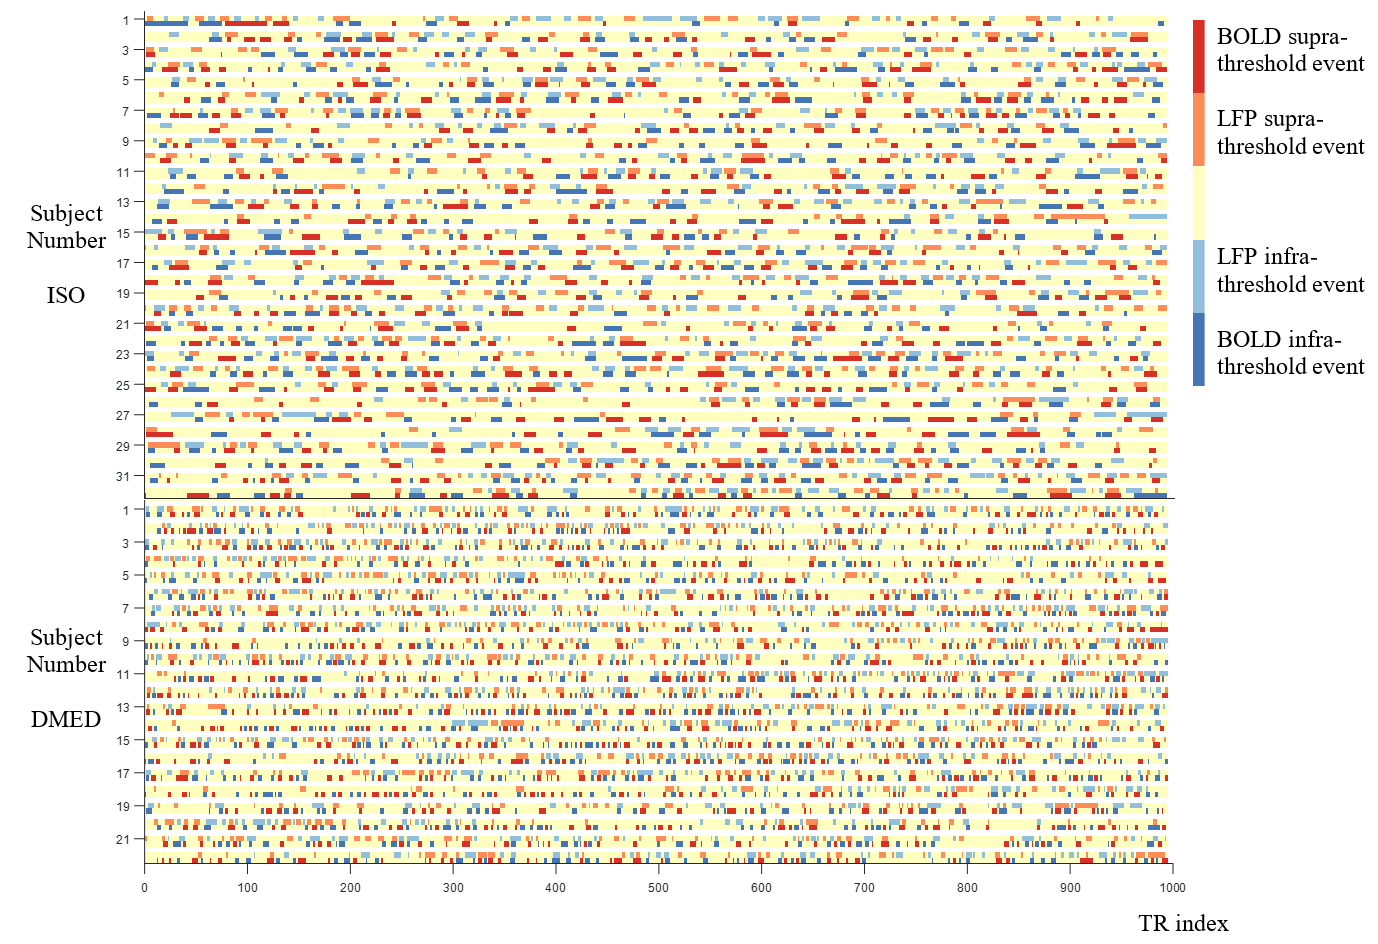
Figure 1 shows that averaging only a small portion of the fMRI frames (10% for most cases, may need 20% for LFP-CDAPs) yields spatial patterns nearly identical to the correlation map, suggesting that the relationship between LFP and BOLD is dominated by a few supra-threshold and infra-threshold events. Furthermore, those LFP-BOLD co-activation events can be separated into several CAP clusters, where the LFP-CAPs and BOLD-CAPs are highly spatially similar within each cluster (can be seen in Figure 2 both visually from the patterns themselves and from the 4 by 4 quasi-diagonal elements in the correlation matrix). It is worth mentioning that the LFP activation events and the BOLD activation events have only about 25% overlapping in timing (shown in Figure 3), so most BOLD frames come from different time points, and yet averaging them producing very similar spatial patterns. Since the LFP power directly measures the neuro activities while the BOLD signal indirectly reflects the neuro activities through neurovascular coupling, it is possible that the co-activation of LFP power of multiple regions somehow propagates through the LFP-BOLD system, and produces the similarity between LFP-CAPs and BOLD-CAPs, suggesting the functional network might be indeed time-varying, though such statement can only be confirmed by using multiple electrodes to obtain the “true” co-activation patterns among LFPs at different brain regions, instead of inferring the co-activations from LFP-BOLD interactions.Conclusion
We proposed a new method to analyze simultaneous fMRI and LFP data, which averages the fMRI frames at LFP power higher or lower than a thresholds. The results shows that the selected frames can resemble the spatial patterns seen in the correlation map, suggesting the relationship between LFP and BOLD is driven by instantaneous co-activations or co-deactivations events. The spatial similarities between LFP-CAPs and BOLD-CAPs suggests that the non-stationary resting state networks found in fMRI studies may be attributed to the non-stationary behavior of LFP in different brain regions, although the underlying mechanism is still not fully understood.Acknowledgements
Funding sources: NIH 1 R01NS078095-01, BRAIN initiative and NSF INSPIRE. The authors would like to thank Chinese Scholarship Council (CSC) for financial support.References
1. Liu X, Duyn JH. Time-varying functional network information extracted from brief instances of spontaneous brain activity. Proceedings of the National Academy of Sciences. 2013;110(11):4392–4397.
2. Petridou N, Gaudes CC, Dryden IL, et al. Periods of rest in fMRI contain individual spontaneous events which are related to slowly fluctuating spontaneous activity. Human Brain Mapping. 2013;34(6):1319-29.
3. Pan WJ, Thompson G, Magnuson M, et al. Broadband local field potentials correlate with spontaneous fluctuations in functional magnetic resonance imaging signals in the rat somatosensory cortex under isoflurane anesthesia. Brain Connectivity. 2011;1(2):119-31.
Figures