0052

Neurovascular coupling in task and resting state using simultaneous calcium fiber photometry and fMRI in rats
Chuanjun Tong1, Jiankun Dai2, Yanqiu Feng1, and Zhifeng Liang2

1Institution of Medical Information, Sourthern Medical University, Guangzhou, China, 2Institution of Neuroscience, Shanghai, China

Synopsis

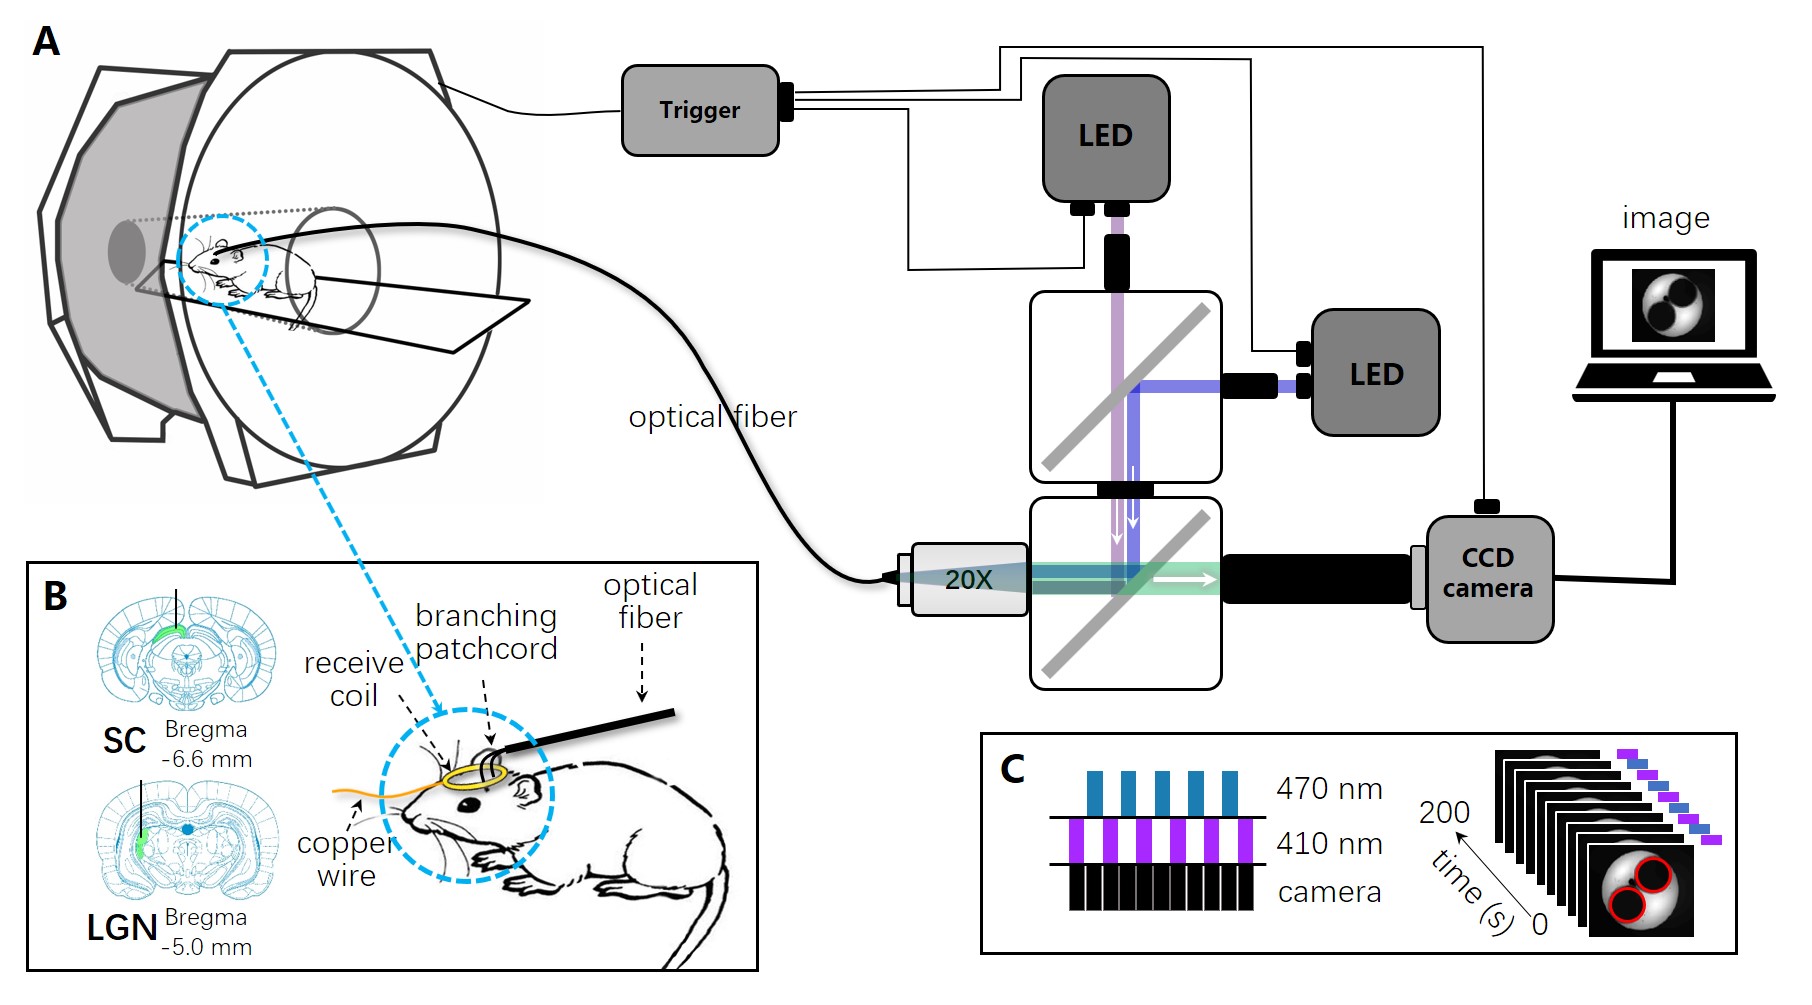
Neurovascular coupling is the foundation of functional brain imaging. We developed a dual site, dual color simultaneous GCaMP6-based fiber photometry and fMRI recording system in rats, to simultaneously record calcium and BOLD signals. Our results revealed the strong couplings in the task condition, and much weaker but still significant coupling in the resting state. We also showed that in the resting state such coupling was susceptible to different preprocessing steps. Our results provided a novel perspective on neurovascular coupling in task and resting state conditions.

Introduction

Fluorescence-based calcium (GCaMP6) and BOLD recordings was a novel methodology with electromagnetic interference-free1 and cell-type specificity2. Prior studies have observed robust synchronous responses of GCaMP and BOLD signals under several stimulation paradigms, such as visual2,3, sensory4 and optogenetic stimulations1,5. In addition, certain studies focused on the coupling between spontaneous brain activities and hemodynamics using the GCaMP recordings and BOLD fMRI. These studies spatially mapped BOLD signal fluctuations with slow (<1Hz) and infra-slow (<0.1Hz) frequency neural activities6-8. Nevertheless, it remained ambiguous how the high (>1Hz) frequency calcium activities devoted to the BOLD signals and the difference of hemodynamics between task- and resting- state. We combined BOLD fMRI with simultaneous GCaMP6-based fiber photometry to explore whether the high frequency calcium signals have unique spatiotemporal dynamics with BOLD signals.

Method

Eight adult SD rats were used in task- and resting- state fMRI study and the simultaneous GCaMP6-fMRI data were acquired using 9.4T Bruker scanner MRI with an 86mm diameter volume coil for transmission and 20mm diameter single loop surface coil for receiving. Anatomical images were acquired using a T2 RARE sequence (matrix size = 256×256; FOV = 3.2×3.2 cm; slice number = 20; slice thickness = 0.8 mm). Functional gradient-echo EPI images were acquired with the following parameters: repetition time (TR) = 1000 ms; echo time (TE) = 15 ms; matrix size = 80×67; FOV = 3.2×2.68 cm; slice number = 20; and slice thickness = 0.8 mm, 600 repetitions. The overall optical setup was adopted from Kim et al., 20169, and was summarized in Figure 1. After the normalization of GCaMP6 signals, a band-pass filter was applied and separated the signals to three sub-frequency bands10. Then, sub-frequency signals were used to HRF estimation. The HRFs were estimated by minimizing the cost function $$E(h ̂)=‖y-Xh ̂ ‖_2^2+λ‖∇_2 h ̂ ‖_2^2 ,$$ where $$$y,X,h$$$ were corresponded to the BOLD signal, GCaMP signal and HRF. To examine the validity of the estimated HRFs, we used the leave-one-out approach to calculate the correlation between the HRF predicted BOLD and actual BOLD time courses. Predicted BOLD was generated by convolving the “left one” GCaMP6f signal and optimal HRF, which was estimated from remaining pairs of GCaMP6f and BOLD time series by ten-fold cross-validation. By adopting this approach, circular analysis was avoided. Then correlation maps were generated by calculating correlation coefficients between predicted BOLD time courses and the BOLD time courses in all voxels. At the group level, the one-sample t-test was performed in the resulting cross-correlation coefficient maps with a significance threshold of p < 0.005.

Results

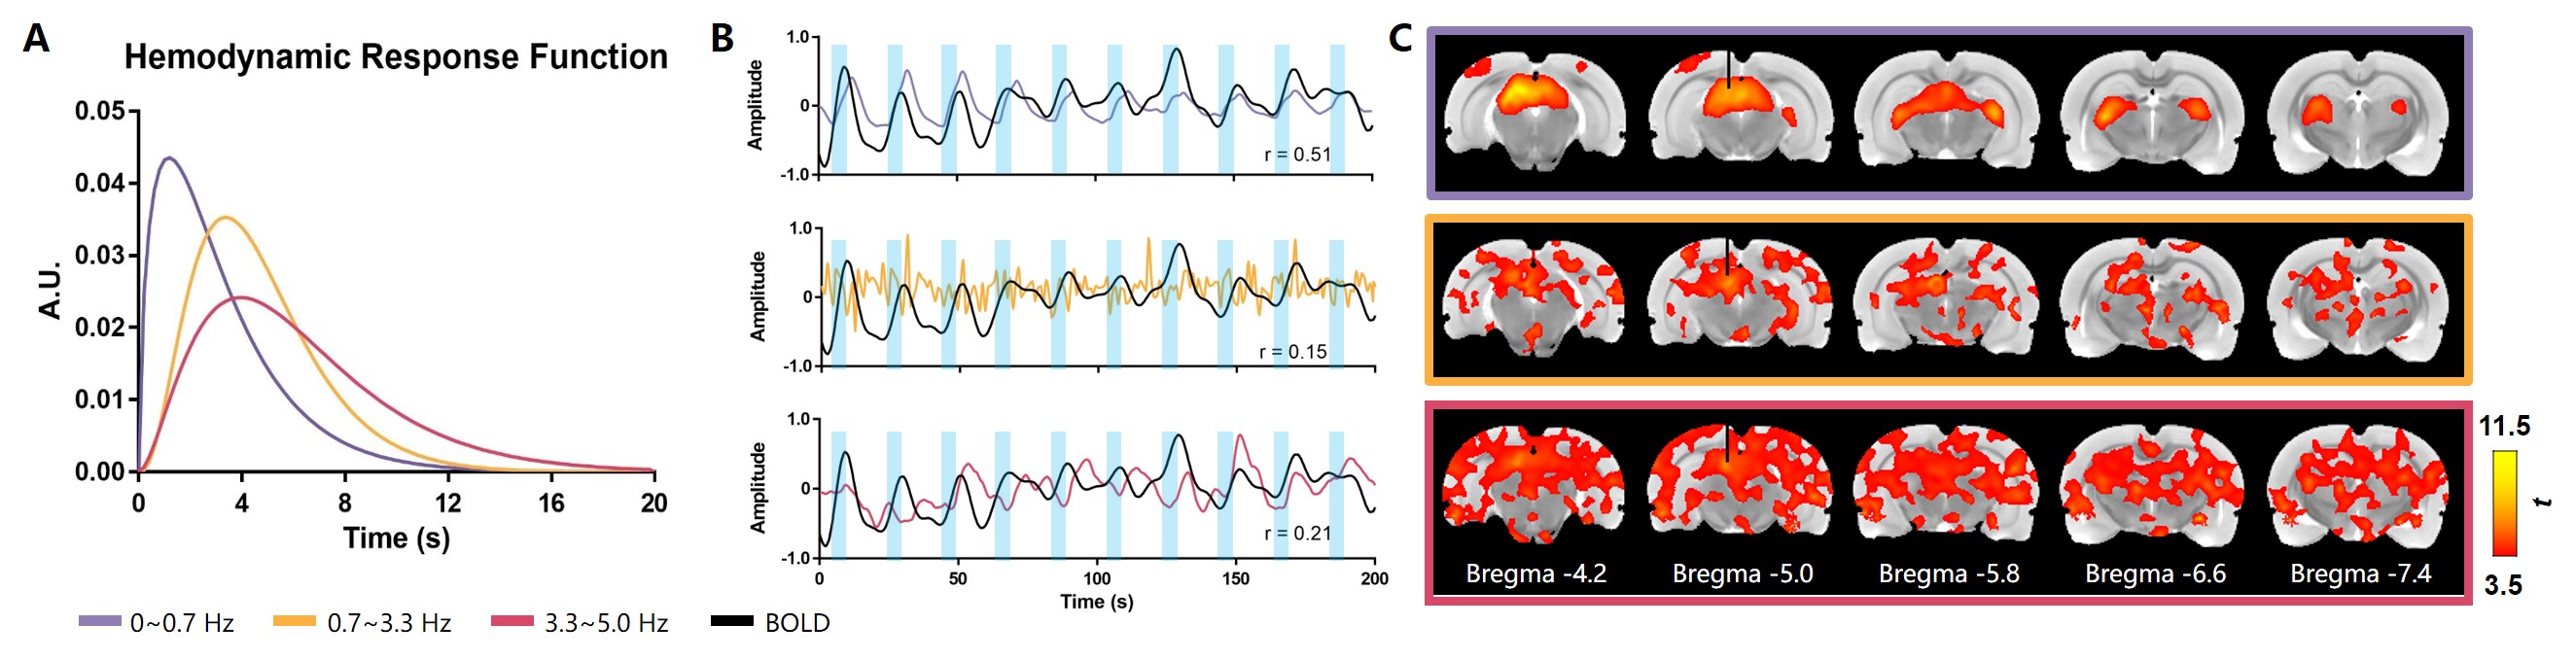
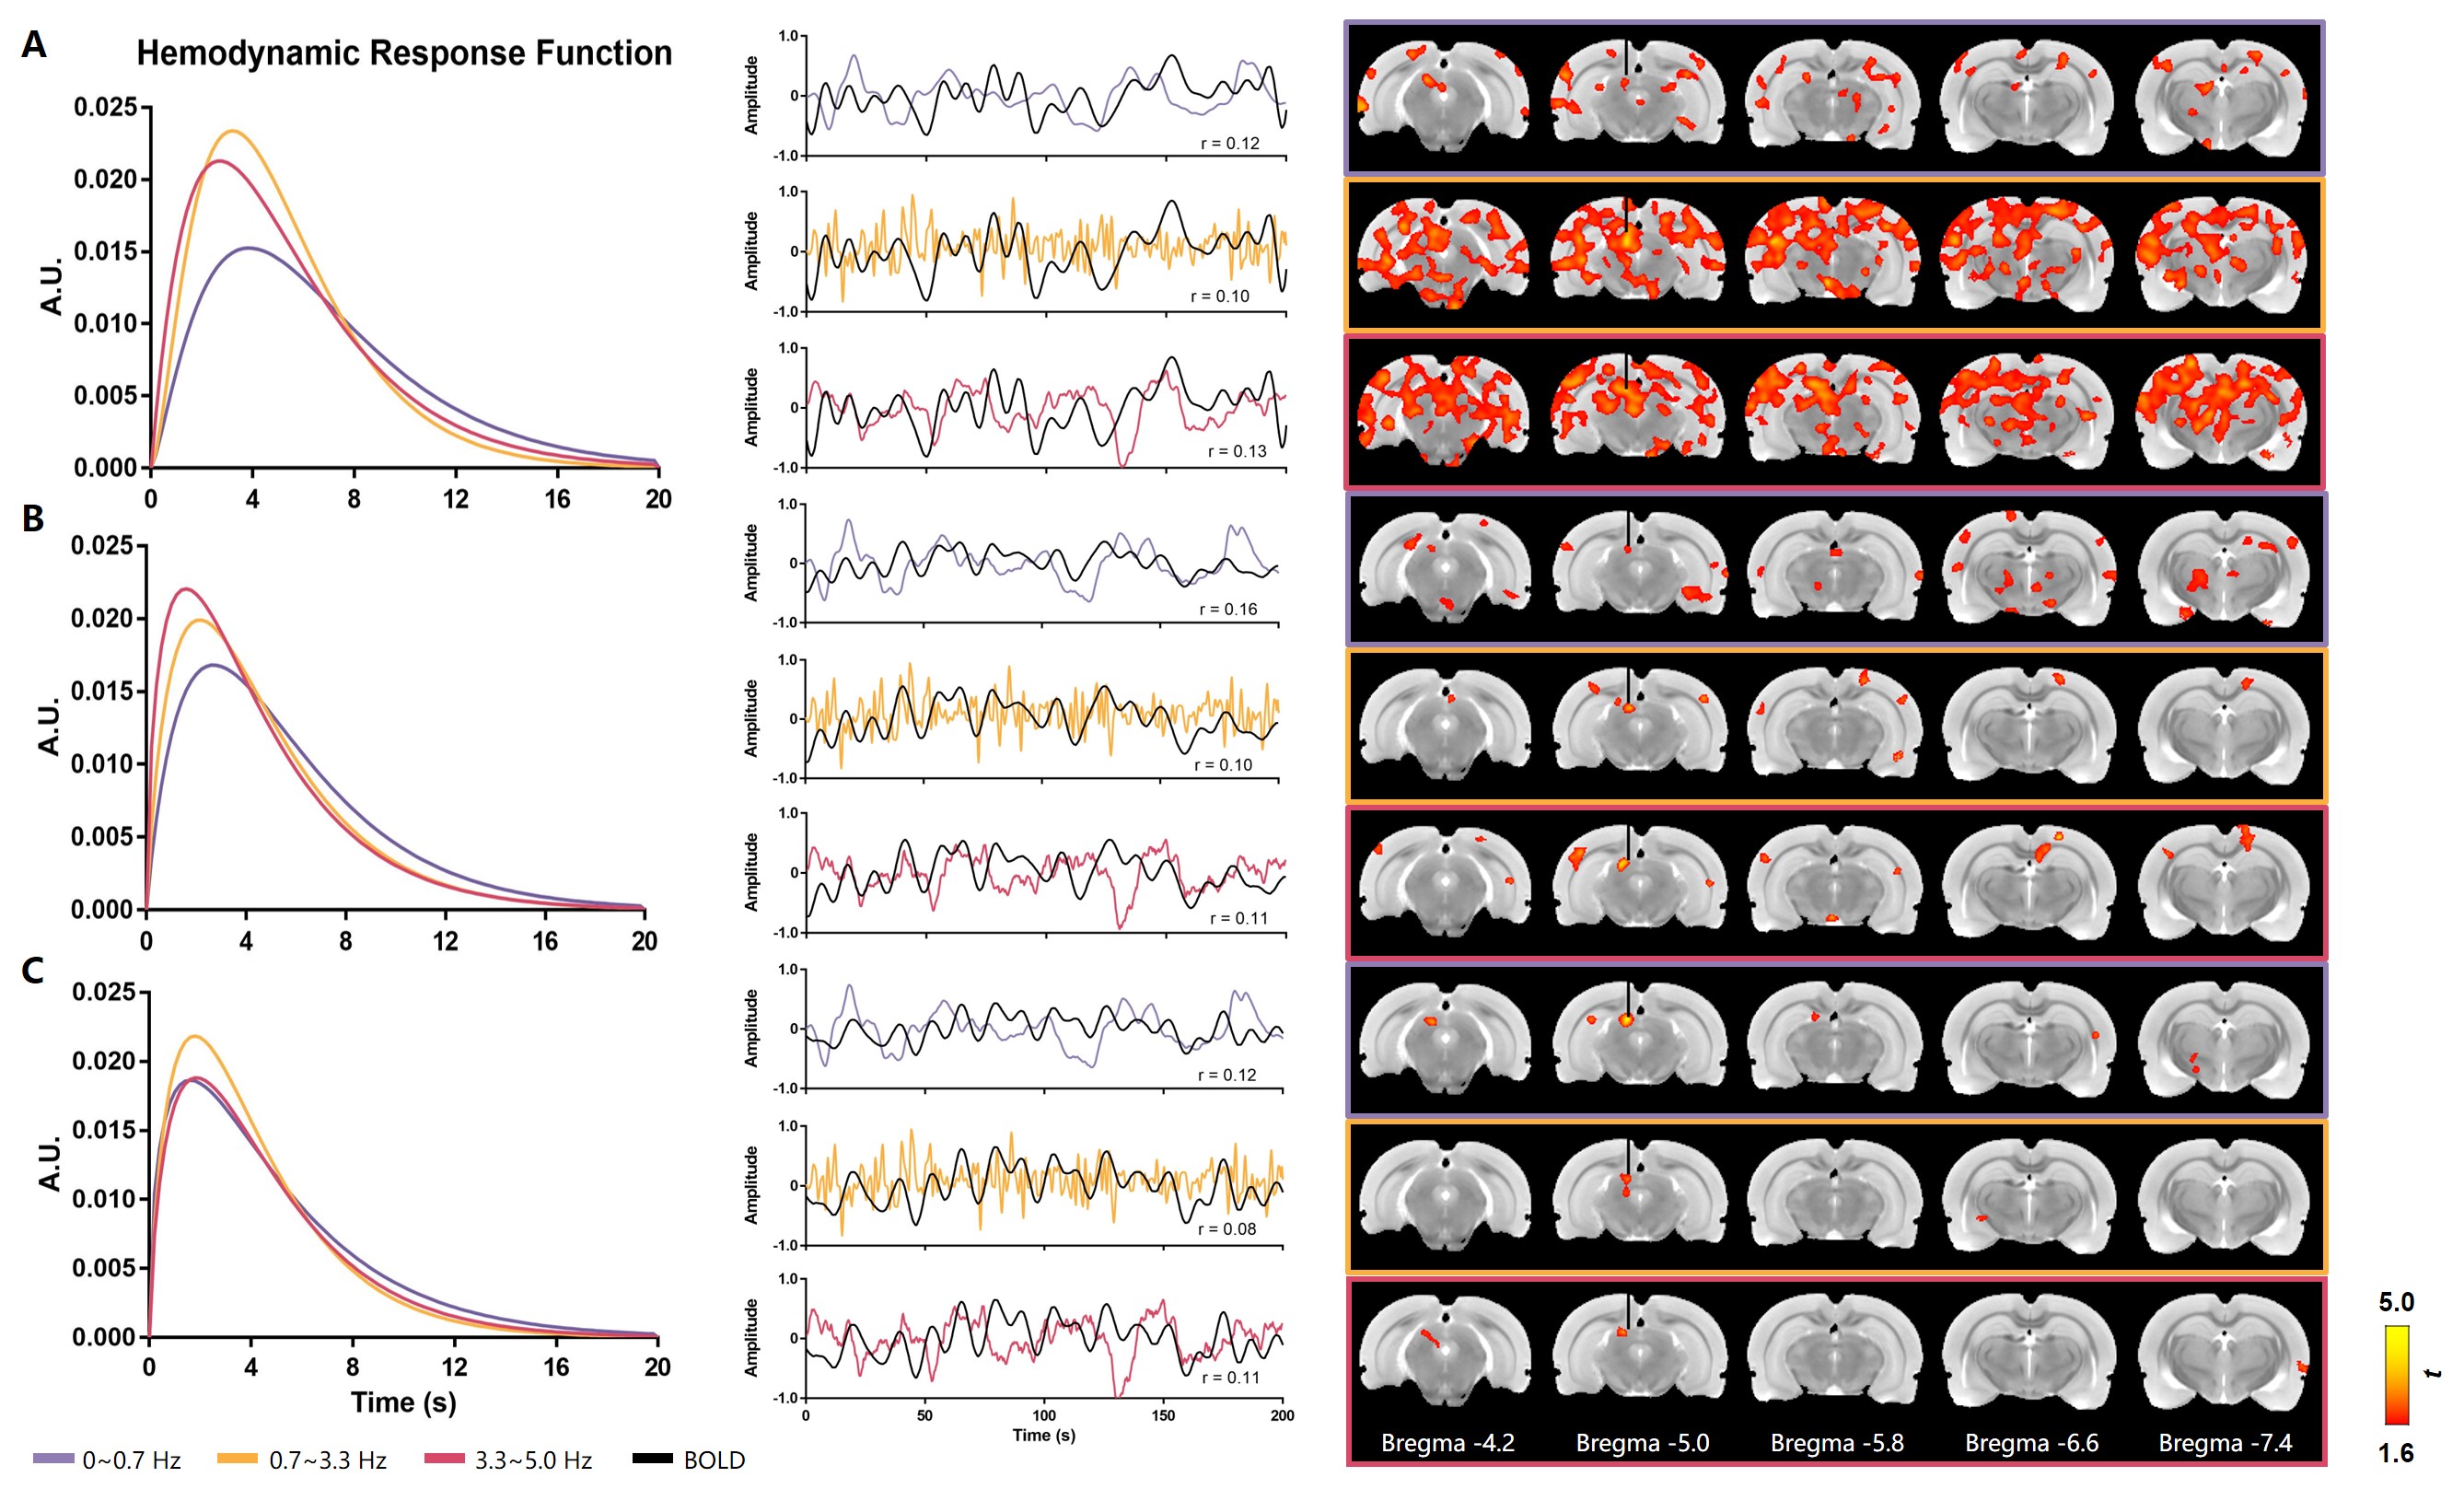
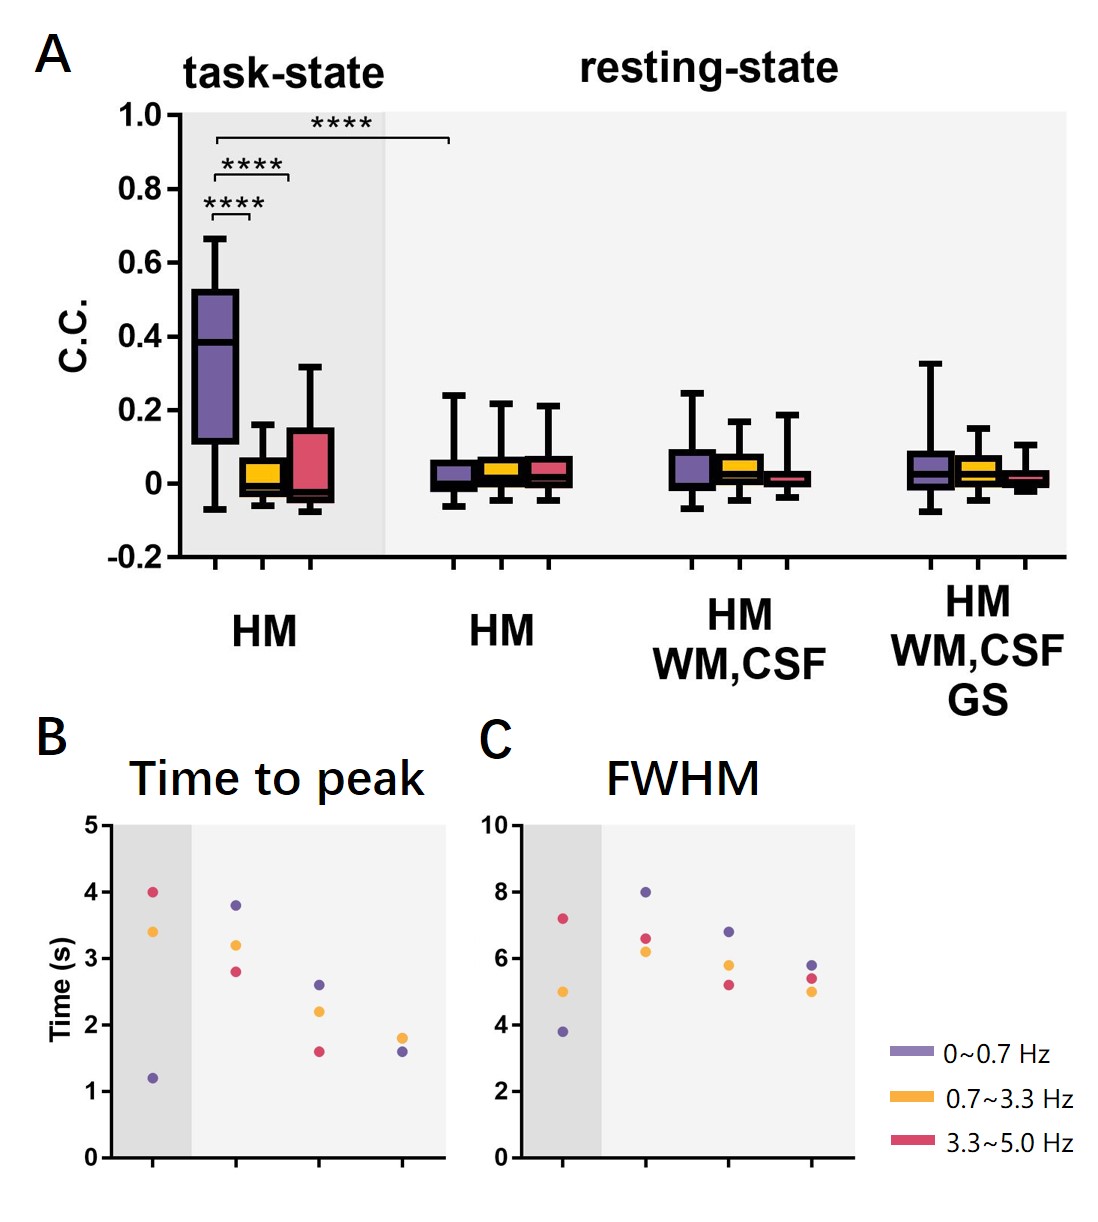
Figure 2.A-C showed the estimated HRFs, fitting results and spatial correlations between separating frequency band predicted BOLD and observed BOLD signals under visual stimulation within SC. Figure 3 showed results from the same animals but during resting state, with Figure 3 A, B and C showing results from three types of nuisance signal regression , i.e. A. head motion (HM); B. HM, white mater (WM), cerebrospinal fluid (CSF); C. HM, WM, CSF and global signals. To further quantify the coupling difference between task- and resting state, we used ANOVA analysis for the correlation coefficients values around the fiber tips. The three-way ANOVA yielded significant main effects in neurovascular coupling for experimental programs (i.e. task- and resting- state), sub-frequencies, and brain regions (i.e. LGN and SC). The two-way ANOVA showed significant main effects in coupling for sub-frequencies, showing no significant effects for regressions on BOLD signals and sub-frequencies regressions × cross reactions (Figure.4A). In addition, HRF derived from difference frequency of calcium signals or different regression showed different temporal characteristics such as time-to-peak (Figure.4B) and FWHM (Figure.4C).

Conclusion

Results suggested differential coupling between calcium and BOLD signal in task and resting state across sub-frequencies. Furthermore, in the resting state different preprocessing strategies can affect such coupling.

Acknowledgements

No acknowledgement found.

References

  1. Schmid F, Wachsmuth L, Schwalm M, et al. Assessing sensory versus optogenetic network activation by combining (o)fMRI with optical Ca2+ recordings. J Cereb Blood Flow Metab. 2015;36(11):1885-1900.
  2. Chen TW, Wardill TJ, Sun Y, et al. Ultrasensitive fluorescent proteins for imaging neuronal activity. Nature. 2013;499(7458):295-300.
  3. Liang Z, Ma Y, Watson GDR, Zhang N. Simultaneous GCaMP6-based fiber photometry and fMRI in rats. J Neurosci Methods. 2017;289:31-38.
  4. Kozberg MG, Ma Y, Shaik MA, Kim SH, Hillman EM. Rapid Postnatal Expansion of Neural Networks Occurs in an Environment of Altered Neurovascular and Neurometabolic Coupling. J Neurosci. 2016;36(25):6704-17.
  5. Kim CK, Yang SJ, Pichamoorthy N, et al. Simultaneous fast measurement of circuit dynamics at multiple sites across the mammalian brain. Nat Methods. 2016;13(4):325.
  6. Mitra A, Kraft A, Wright P, et al. Spontaneous Infra-slow Brain Activity Has Unique Spatiotemporal Dynamics and Laminar Structure. Neuron, 2018; 98(2).
  7. Schwalm M, Schmid F, Wachsmuth L, et al. Cortex-wide BOLD fMRI activity reflects locally-recorded slow oscillation-associated calcium waves. Elife, 2017; 6.
  8. Wang M, He Y, Sejnowski TJ, Yu X. Brain-state dependent astrocytic Ca2+ signals are coupled to both positive and negative BOLD-fMRI signals. Proc Natl Acad Sci U S A. 2018;115(7):E1647-E1656.
  9. Kim C K, Yang S J, Pichamoorthy N, et al. Simultaneous fast measurement of circuit dynamics at multiple sites across the mammalian brain. Nature Methods, 2016, 13(4):325.
  10. Ma Y, Shaik MA, Kozberg MG, et al. Resting-state hemodynamics are spatiotemporally coupled to synchronized and symmetric neural activity in excitatory neurons. Proc Natl Acad Sci U S A. 2016;113(52):E8463-E8471.

Figures

Figure 1 Schematic illustration of the setup of simultaneous calcium fiber photometry and fMRI. (A) The upper right side showed the optical component mounted on an optical table. The upper left side showed the anesthetized rat in the bore of 9.4T MRI tethered to optical patch cable. The fiber-optic implant was shown in (B). (C) Left side: The diagram that the time-division multiplexing scheme for simultaneous imaging. Right side: acquired calcium fiber photometry data. The red circles were the manual masks for extracting the GCaMP6f signals.

Figure 2 GCaMP6f-based spatiotemporal neurovascular coupling within SC under visual stimulation. (A) Estimated HRFs by deconvolving sub-frequencies GCaMP6f signals from simultaneously acquired BOLD signal. (B) Time courses between actual BOLD signal and predicted BOLD signals by convolving the sub-frequency GCaMP6f signals with corresponding HRFs. (C) Brain-wide correlation t-maps at 0~0.7 Hz (Top), 0.7~3.3 Hz (Middle), and 3.3~5 Hz (Bottom) frequency situations. The significance level was set to p<0.005, and the minimum cluster size was set to 10 voxels. Blue shades indicated the time periods of light stimulation.

Figure3 GCaMP6f-based spatiotemporal neurovascular coupling with different BOLD-regressions within SC in resting state. The layout in horizontal plane was the same as Figure 2, i.e. estimated HRFs, time courses, and brain-wide correlation t-maps. (A-C) The spatiotemporal neurovascular coupling between GCaMP6f and BOLD signals in SC. The BOLD signals were preprocessed with HM (A), HM, WM, CSF (B), and HM, WM, CSF, GS (C) regressions, respectively. The significance level was set to p<0.005, and the minimum cluster size was set to 10 voxels.

Figure 4 Quantitative comparisons of neurovascular coupling and hemodynamic responses. The neurovascular coupling (A) and the parameters (B: Time to peak; C: FWHM) of hemodynamic responses across sub-frequencies upon different regressions on BOLD signals within SC in task- and resting- state. Significant positive correlation coefficient value in each column using one sample t-test (p<0.05). Correlation values were obtained by averaging the coefficients of voxels around the tip of the optical fiber (*p<0.05; **p<0.001, post-hoc Tukey tests).

Proc. Intl. Soc. Mag. Reson. Med. 27 (2019)
0052