0049
Translating pH-sensitive PROgressive saturation for Quantifying Exchange using Saturation Times (PRO-QUEST) MRI to a 3T Clinical Scanner1Department of Brain Repair and Rehabilitation, UCL Queen Square Institute of Neurology, University College London, London, United Kingdom, 2Queen Square MS Centre, Department of Neuroinflammation, UCL Queen Square Institute of Neurology, University College London, London, United Kingdom, 3Philips Healthcare, Surrey, United Kingdom, 4UCL Centre for Medical Imaging, University College London, London, United Kingdom, 5Department of Brain and Behavioural Sciences, University of Pavia, Pavia, Italy, 6Brain MRI 3T Research Centre, IRCCS Mondino Foundation, Pavia, Italy
Synopsis
In this work, a recently developed method called PRO-QUEST (PROgressive saturation for Quantifying Exchange using Saturation Times) is translated to a 3T clinical scanner for assessing pH-sensitive indices in phantoms and a healthy volunteer. Our results demonstrate that quantification of pH sensitive indices using PRO-QUEST is feasible at 3T within clinically acceptable acquisition times. Our initial findings suggest that PRO-QUEST has the potential to provide a new biomarker to study neurological disorders associated with brain tissue acidosis.
Introduction
Understanding pH regulation in the brain is important both in healthy and pathophysiological conditions because tissue acidity may be a key characteristic associated with neurological disorders such as schizophrenia, bipolar disorder, panic attack and ischemia1-3. Recently, the feasibility of mapping pH sensitive exchange rates was demonstrated in phantoms and in vivo ischemic rat brains using a novel pulse sequence called PRO-QUEST (PROgressive saturation for Quantifying Exchange using Saturation Times)4. We aimed to translate PRO-QUEST to a 3T clinical scanner and estimate pH-sensitive indices for phantoms with various pH values and a healthy volunteer.Methods
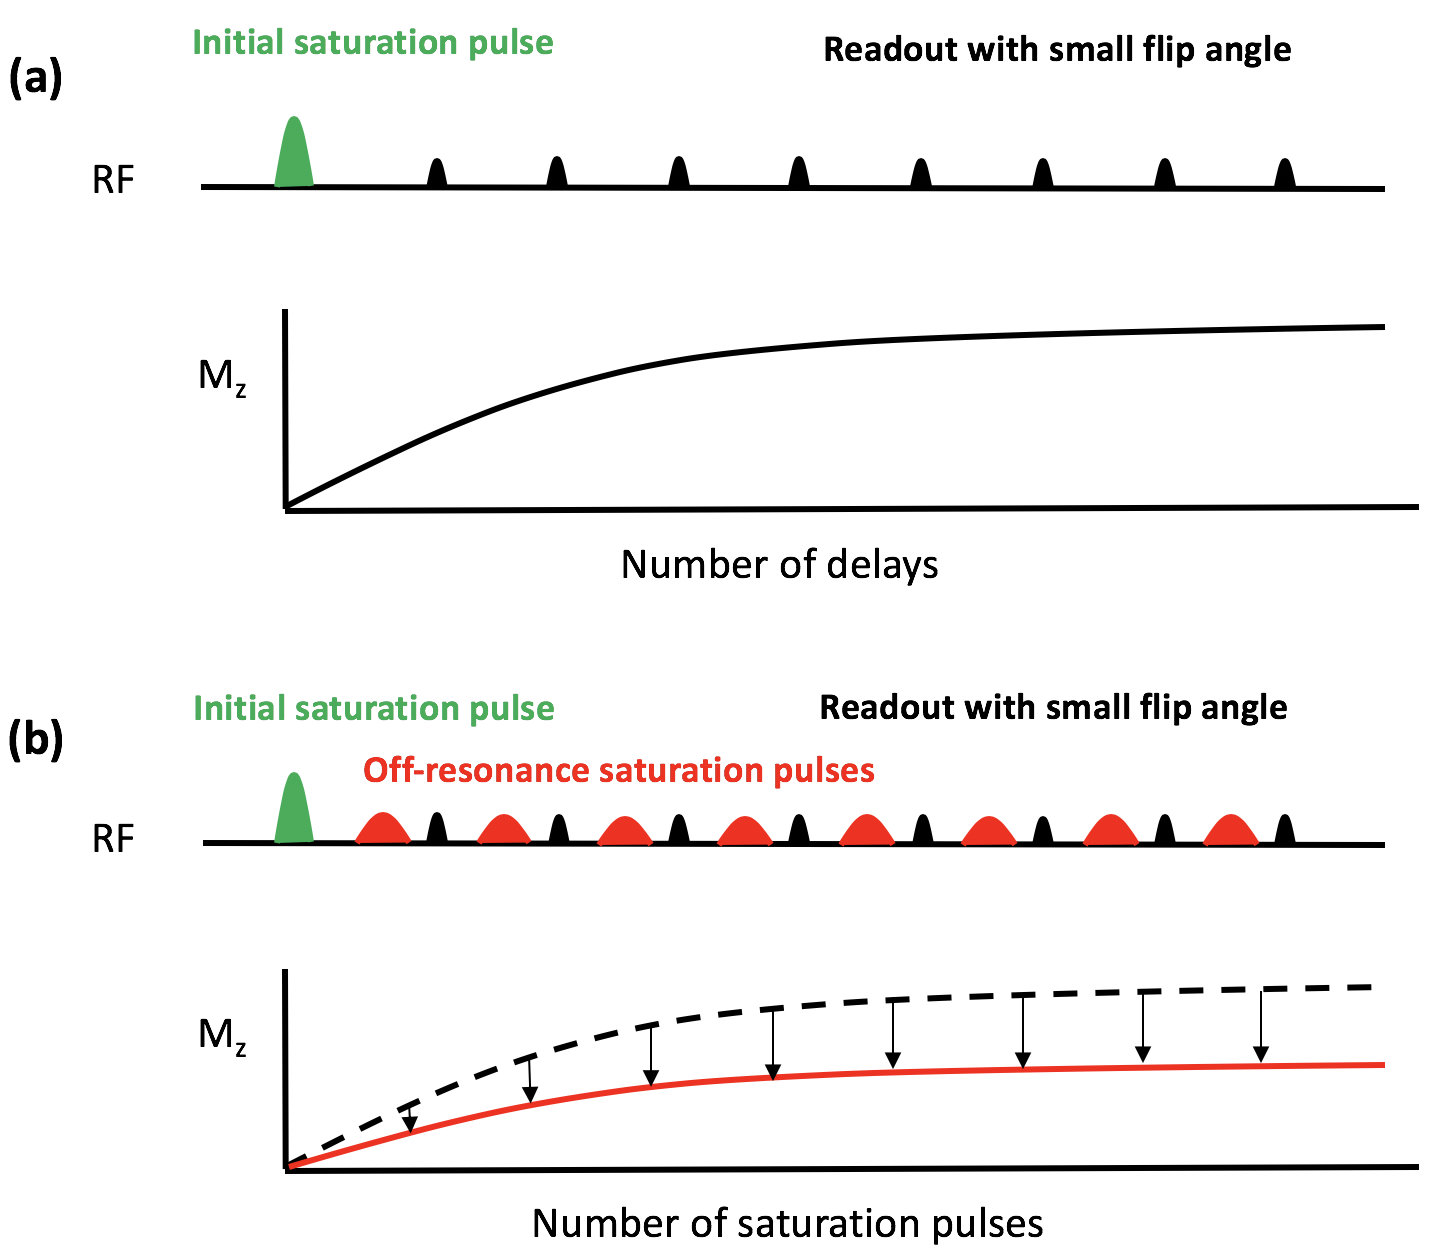
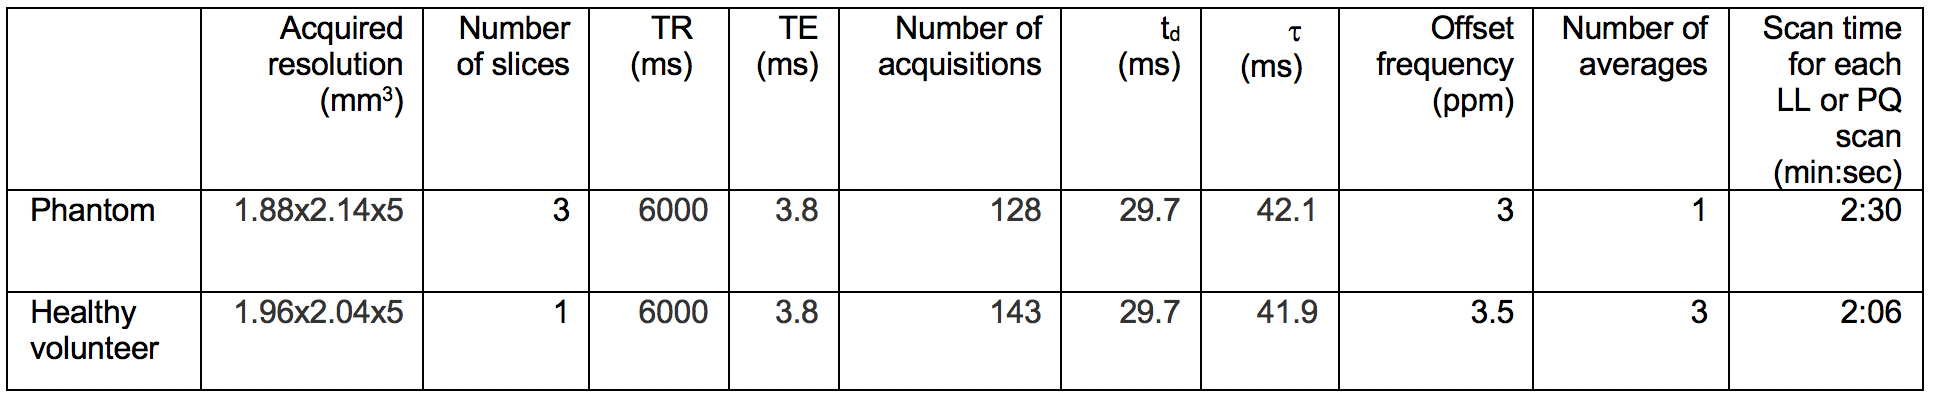
The PRO-QUEST sequence was implemented on a 3T Philips Ingenia MRI scanner (Philips Healthcare, Best, the Netherlands) and tested on phantoms consisting of 100mM glutamate in a standard solution of 1x phosphate-buffered saline (PBS) with several pH (6.08, 6.64 and 7.19) and a pure PBS sample (pH 7.14). Phantoms and a healthy volunteer were scanned using a 32 channel head coil. First, a Look-Locker (LL) sequence (Figure 1a) was implemented with 20ms delay times (in lieu of off-resonance saturation pulses displayed in Figure 1b) prior to a multishot turbo field echo planar imaging (TFEPI) readout (EPI factor=7) and n acquisitions (n=128 for phantom; n=143 for volunteer) with the following imaging parameters: imaging pulse=sinc-gaussian, duration=0.67 ms, flip angle=8°\15°, TE=3.8 ms, time between readout pulses=42 ms, acquired resolution=1.88x2.14x5 mm3 (phantom) and 1.96x2.04x5mm3 (volunteer), TR=6s. For the PRO-QUEST scans (Figure 1b), an off-resonance saturation pulse centred at 3.0ppm (glutamate phantom) or 3.5ppm (volunteer) was applied prior to the TFEPI readouts with identical imaging parameters as the LL sequence. Parameters for the off-resonance saturation pulses used in the PRO-QUEST sequence are as follows: off-resonance saturation pulse=sinc-gaussian, bandwidth=300Hz, duration=20 ms, flip angle=400° (equivalent of 1.3μT). For the healthy volunteer scan, single slice acquisitions were obtained with a scan time of 2 min 6 s (3 averages) per sequence. Imaging parameters are summarised in Table 1. Additionally, standard multi-echo turbo spin echo (TSE) sequence (TSE factor=20) consisting of 10 echoes with TE=20-200ms with 20ms of inter-echo spacing was used to quantify T2 (to be used as a input parameter in equation 2) in the same geometry as PRO-QUEST.
Data processing was performed using custom-written scripts in MATLAB (The Mathworks, Natick, MA, USA). The derived Block-McConnell models4 were fitted to magnitude data using maximum likelihood estimation. The following equation was fitted to LL data to estimate the equilibrium magnetization M0, T1 and B1:
Mzd(nτ)={1-[(cosθ)n-1e-(n-1)τR1]}Mzd(τ)/{1-[(cosθ)e-τR1]}+M0(1-e-tdR1)[(cosθ)n-1e-(n-1)τR1 -----[1]
where Mzd(τ) = M0 (1-e-τR1); td is the time between the initial saturation pulse and the first readout pulse; τ is the time between readout pulses with small flip angle θ; R1 = 1/T1; n is number of acquisitions.
Next, the obtained M0,T1, B1 values were used as input parameters for estimating the exchange-dependent relaxation, Rex by fitting the PRO-QUEST data:
Mzsat(nτ)={1-[(cosθ)ne-n(τR1-tsat(R1-R1ρ) )]}Mzsat(τ)/{1-[(cosθ)e-(τR1-tsat(R1-R1ρ))]}+M0(1-e-tdR1)[(cosθ)ne-n(-τR1-tsat(R1-R1ρ))] -----[2]
where Mzsat(τ) = Mss (1-e-(R1ρtsat))(cosθ)e-(τ - tsat)R1 + M0(1-e-(τ-tsat)R1; Mss = (R1cos2φ)/R1ρ; R1ρ = R1cos2φ+(R2+ Rex)sin2φ; φ is the angle between the effective field and the z-axis. Further definition of the equations and parameters are described in literature4.
Results and Discussion
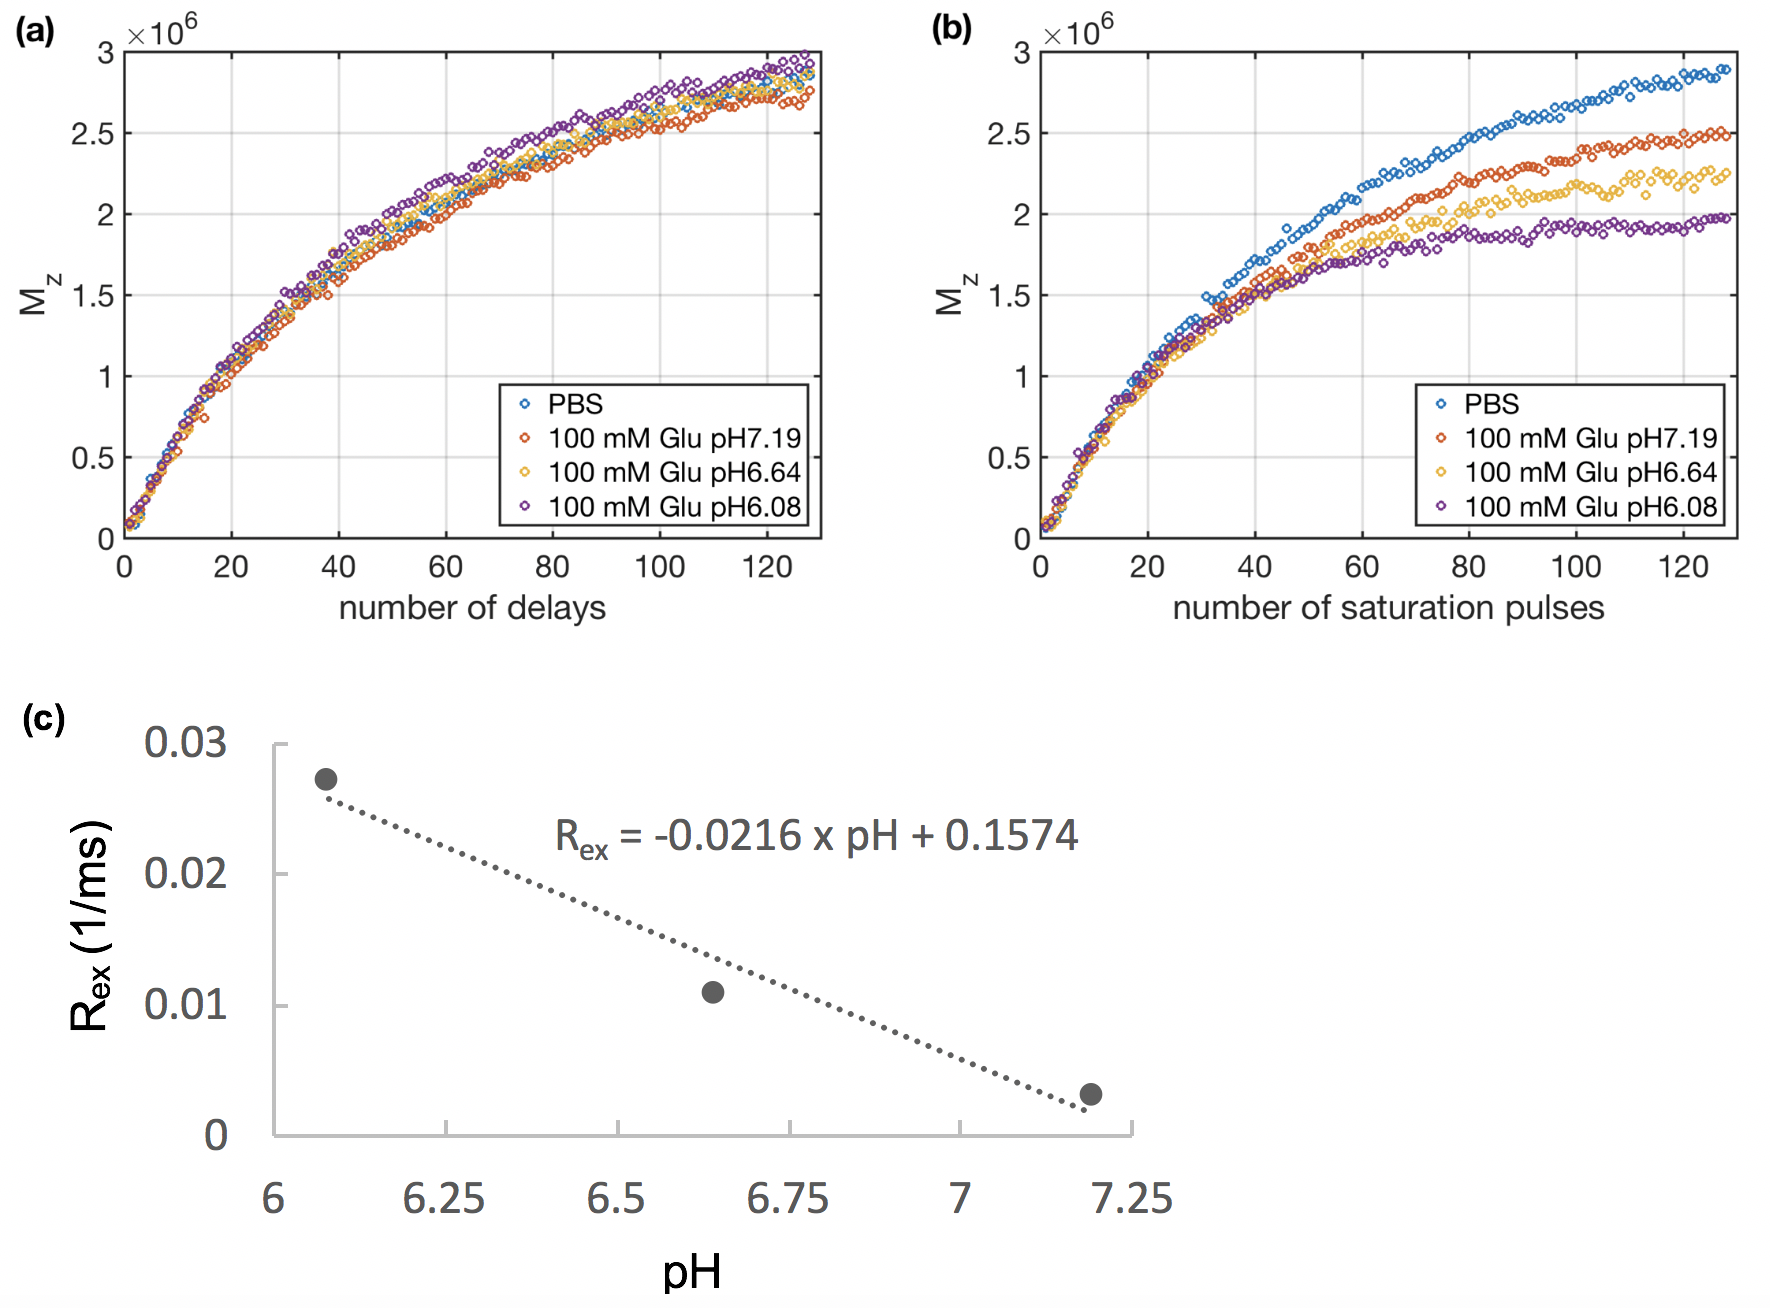
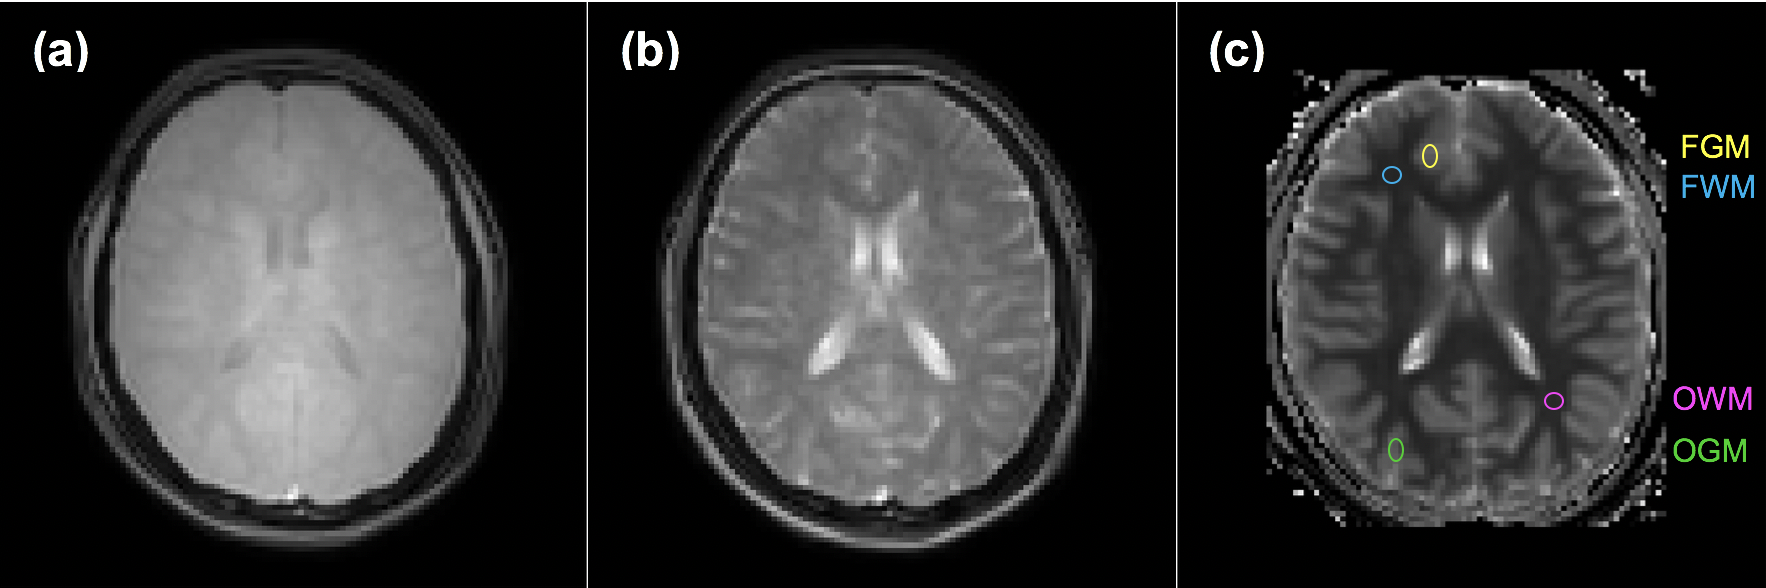
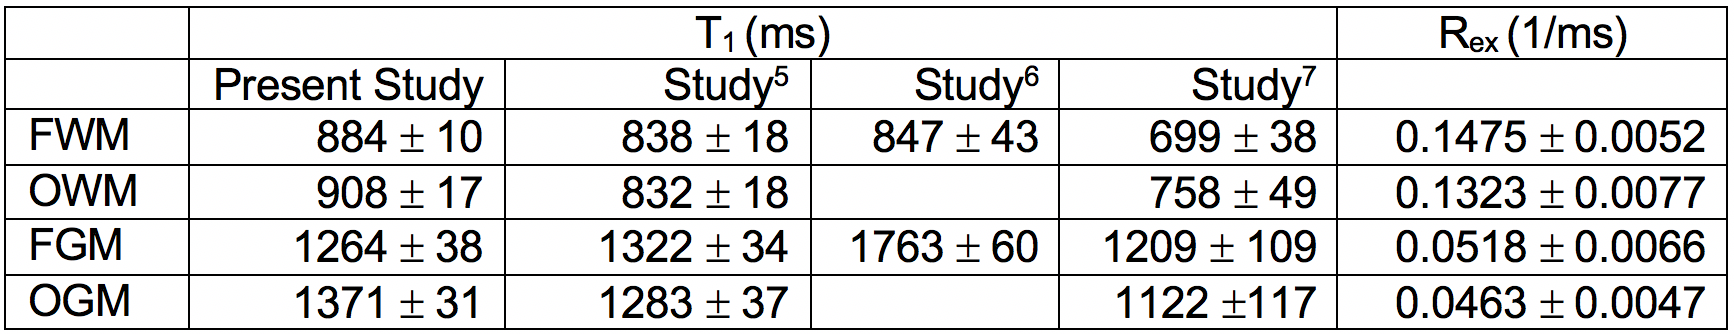
Similar to the pre-clinical cases4, progressive saturation recovery curves with off-resonance saturation pulses show clear separation among samples with various pH values in glutamate and PBS (Figure 2b) while the ones without off-resonance saturation pulses are nearly indistinguishable (Figure 2a). The estimated Rex significantly correlates with pH in glutamate samples (Figure 2c). In the healthy volunteer, the PRO-QUEST image of signal evolution at the final phase of the amide proton resonance shows clear contrast between white and grey matters (WM/GM) (figure 3b) as contrary to the LL image (without off-resonance saturation pulses) (figure 3a). The origin of contrast between WM and GM needs further investigation. As for prerequisite parameters in estimation of PRO-QUEST indices, calculated T1 values from the LL scan in a healthy volunteer are remarkably consistent with literature values (table 2)5-7. The pH sensitive Rex shows differences between WM and GM.
Due to intrinsic limitations of the specific absorption rate and duty cycle (50%) at clinical field strength, the efficiency of the off-resonance saturation scheme is somewhat compromised. Nonetheless, clinical translation of this technique is very feasible given its easy implementation on standard clinical platforms and the use of existing LL-type of readouts, therefore not requiring pulse programming. Further work is required to achieve full brain coverage within clinically relevant acquisition time.
Conclusion
Our results demonstrate that quantification of pH sensitive indices using PRO-QUEST is feasible at 3T within clinical acquisition time. Our initial findings suggest that it would be worthwhile to apply PRO-QUEST for studies on patients with neurological impairment associated with acidosis to better understand its distinct imaging features relative to conventional techniques.Acknowledgements
This work was supported by funding from the European Union’s Horizon 2020 research and innovation programme under the Grant Agreement No 667510.References
- Acids in the brain: a factor in panic? Esquivel G, Schruers KR, Maddock RJ, Colasanti A, Griez EJ. J Psychopharmacol. 2010;24(5):639-47.
- Brain lactate and pH in schizophrenia and bipolar disorder: a systematic review of findings from magnetic resonance studies. Dogan AE, Yuksel C, Du F, Chouinard VA, Öngür D. Neuropsychopharmacology. 2018;43(8):1681-1690.
- Using the amide proton signals of intracellular proteins and peptides to detect pH effects in MRI. Zhou J, Payen JF, Wilson DA, Traystman RJ, van Zijl PC. Nat Med. 2003;9(8):1085-90.
- PRO-QUEST: a rapid assessment method based on progressive saturation for quantifying exchange rates using saturation times in CEST. Demetriou E, Tachrount M, Zaiss M, Shmueli K, Golay X. Magn Reson Med. 2018;80(4):1638-1654.
- NMR relaxation times in the human brain at 3.0 Tesla. Wansapura JP, Holland SK, Dunn RS, Ball WS Jr. J Magn Reson Imaging. 1999;9:531–538.
- Interregional variation of longitudinal relaxation rates in human brain at 3.0 T: relation to estimated iron and water contents. Gelman N, Ewing JR, Gorell JM, Spickler EM, Solomon EG. Magn Reson Med. 2001;45:71–79.
- Routine clinical brain MRI sequences for use at 3.0 Tesla. Lu H, Nagae-Poetscher LM, Golay X, Lin D, Pomper M, van Zijl PC. J Magn Reson Imaging. 2005;22(1):13-22.
Figures