0048
High-resolution phosphocreatine mapping of human skeletal muscle by artificial neural network-based chemical exchange saturation transfer MRI at 3T1F.M. Kirby Research Center for Functional Brain Imaging, Kennedy Krieger Research Institute, Baltimore, MD, United States, 2Russell H. Morgan Department of Radiology and Radiological Science, The Johns Hopkins University School of Medicine, Baltimore, MD, United States, 3Division of Cardiology, Department of Medicine, The Johns Hopkins University School of Medicine, Baltimore, MD, United States, 4Department of Biomedical Engineering, City University of Hong Kong, Hong Kong, China
Synopsis
The creatine kinase reaction provides energy for cells by reversibly regenerating adenosine triphosphate from a phosphocreatine pool. Functional impairment of this system is observed in many neurodegenerative and muscle diseases. In this study, we developed a high-resolution phosphocreatine (PCr) mapping approach that can be used on standard magnetic resonance clinical scanners by specifically detecting PCr via the water proton signal using a chemical exchange saturation transfer (CEST) method. An artificial neural network was employed to achieve absolute quantification of PCr concentration. Such a mapping method offers a non-invasive, rapid imaging tool to quantify abnormalities in PCr content and distribution in musculoskeletal diseases.
Introduction
Phosphocreatine (PCr) plays a vital role in cellular energy buffering and energy transport, particularly in skeletal muscles with high and fluctuating energy demands (1). Chemical exchange saturation transfer (CEST) MRI has a great advantage in detecting millimolar metabolites in vivo through the water signal over magnetic resonance spectroscopy (2,3). In this study, we optimized the saturation power (B1) and length (tsat) to maximize the PCr CEST contrast for human skeletal muscle at 3T. An artificial neural network-based CEST quantitation method dubbed ANNCEST was designed to quickly and simultaneously quantify four parameters from the Z-spectrum on a voxel-by-voxel basis: PCr concentration, the proton exchange rate, B0 and B1.
Methods
ANNCEST utilizes a fully-connected feed-forward neural network for the CEST quantification, as shown in Fig. 1. The training data for numerical simulations and the PCr phantom were generated using the Bloch equations with various concentrations, exchange rates, B0 or/and B1, as well as Gaussian noise. An MTC pool was added when generating the training data for human skeletal muscle experiments. The neural network training was accomplished using MATLAB (version 9.4.0.813654) with built-in deep learning toolbox. Numerical simulations and phantom experiments on a 3T Bruker Biospec system (Bruker, Ettlingen, Germany) were performed to validate the feasibility of ANNCEST. Human skeletal muscle experiments were performed on a 3T MRI system (Achieva, Philips, The Netherlands). Saturation powers (0.2, 0.4, 0.6, 0.8 and 1 µT) and lengths (0.4, 0.6, 0.8 and 1 s) were optimized based on the achieved contrast (Z-spectral difference, DZ) for PCr ANNCEST at 3T. To validate the approach, the depletion of PCr in the human calf muscle after exercise was detected using the proposed method. All human studies were approved by the local Institutional Review Board.Results and Discussion
Representative training data for the numerically simulated phantom experiments are shown in Fig. 2(a). The exchange rate ratio between 1.95 ppm and 2.5 ppm was set to 1: 2.19 according to the measurement of PCr phantom at 37 degree using magnetization recovery technique. The performance of the neural network with different numbers of hidden layers was measured as shown in Fig. 2(b), and the proper number of hidden layers was found to be 7. From Figs. 2 (d~n), ANNCEST yields better quantification results compared to the Bloch fitting method. ANNCEST takes 2 seconds on a personal computer, while Bloch fitting requires around 18 hours on a cluster computer. The same trained neural networks were applied to the phantom experiment (Fig 3). The predicted concentration and B0 map are consistent with ground truth and B0 map measured by the WASSR approach (4).
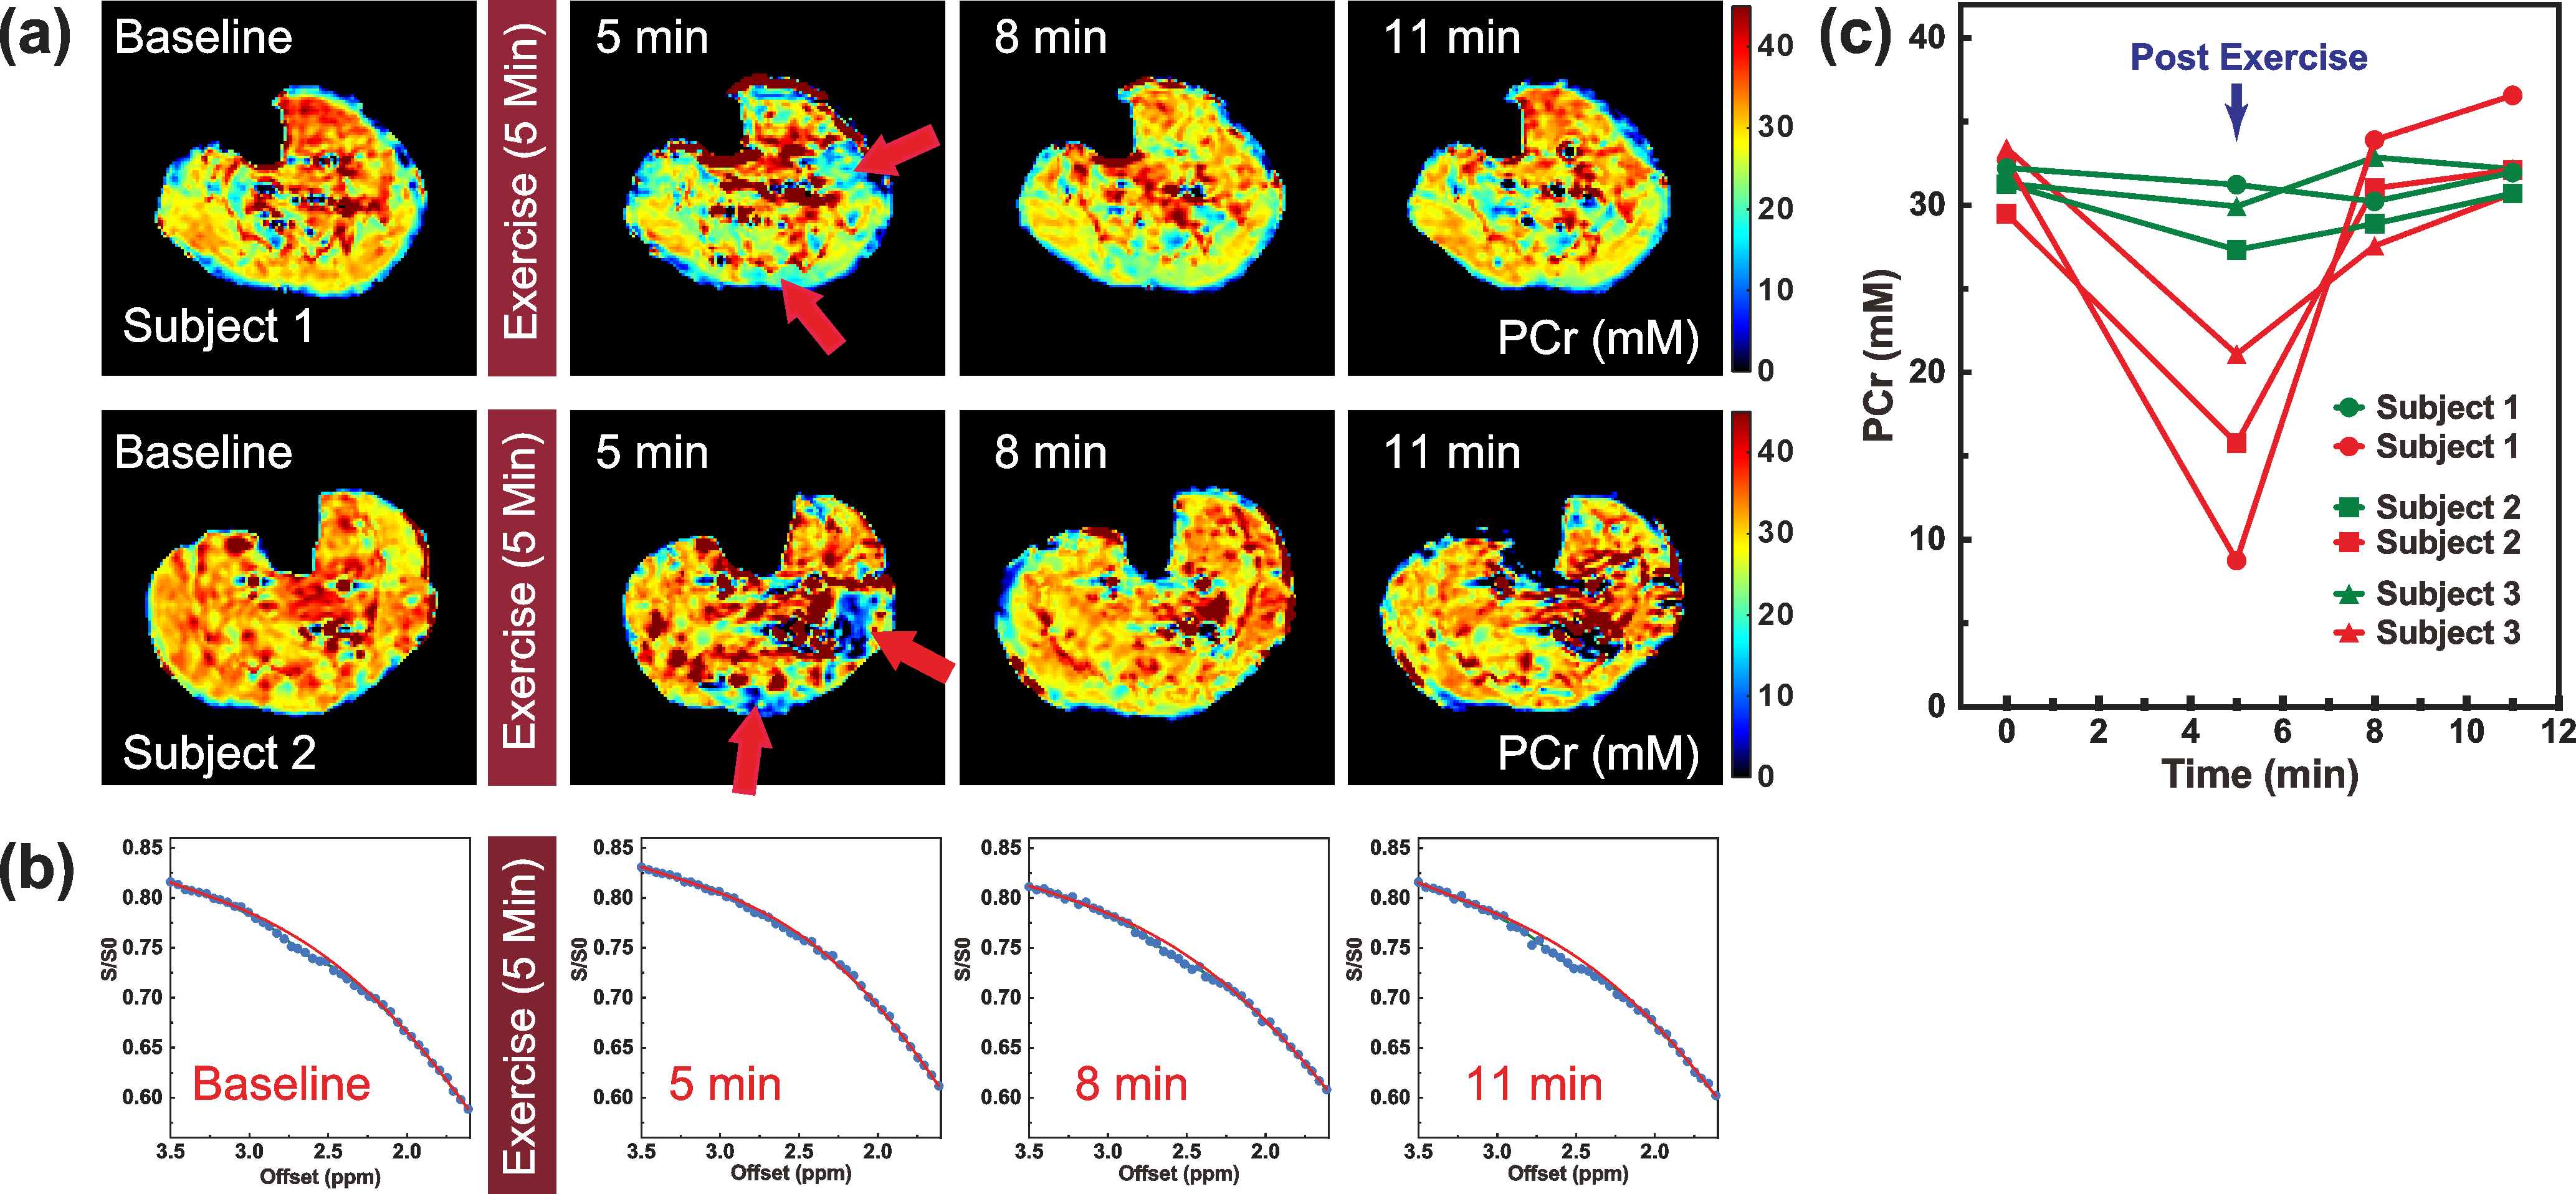
Our previous study on mouse skeletal muscle at 11.7T demonstrated that PCr and Cr show distinguishable peaks around 2.5 ppm and 1.95 ppm without the contamination of proteins (5). Due to the relatively fast exchange rate of Cr (950±100 Hz), the Cr CEST peak at 1.95 coalesces with the water resonance at 3T and only a separate PCr peak is observed in muscle at low B1, as shown in Fig. 4 (a). From the data in Figs. 4(b, c), the optimal saturation power and saturation length for PCr CEST on skeletal muscle at 3T were found to be 0.6 µT and 1 s, respectively. High-resolution maps of PCr concentration and exchange rate obtained by ANNCEST are shown in Figs. 4(d, e). The PCr concentration value 31.7 ± 1.4 mM and exchange rate value 164 ± 36.8 Hz are consistent with previous studies (6,7). The B0 and B1 maps obtained by ANNCEST were comparable to the ones obtained independently by dual-echo and DREAM (8), respectively. The PCr map of skeletal muscle was further validated through in-magnet exercise (Fig. 5(a)). The Z-spectra for the peroneus longus muscles at each time points are also plotted and demonstrate the decrease of the PCr CEST peak after the exercise (Fig. 5(b)). The PCr concentration for the peroneus longus muscle dropped to 15.2 ± 6.2 mM right after exercise and recovered rapidly to baseline level 30.8 ± 3.0 mM at 3 minutes after exercise (Fig. 5(c)). In the soleus muscle, the PCr concentration decreased only slightly (29.5 ± 2 mM). This is in good agreement with those reported previously in healthy volunteers, in which the gastrocnemius muscle showed significantly higher PCr depletion compared to the soleus muscle (9-11).
Conclusion
We present a novel method that can reliably map the PCr concentration of the human calf muscle at 3T MRI scanners in 3 minutes and is immune to the B0/B1 inhomogeneities. In addition, the proposed method does not require any exogenous contrast agent or special hardware and thus has great potential to be a clinical-ready technique for routine evaluation of many muscle-related diseases.Acknowledgements
This work was supported by NIH R01EB015032, P41EB015909, R01EB019934, R01HL63030, R01HL61912, R03NS109664 and DOD CDMRP AZ170028.
References
1. Wyss M, Kaddurah-Daouk R. Creatine and creatinine metabolism. Physiological reviews 2000;80(3):1107-1213.
2. van Zijl PC, Yadav NN. Chemical exchange saturation transfer (CEST): what is in a name and what isn't? Magn Reson Med 2011;65(4):927-948.
3. Vinogradov E, Sherry AD, Lenkinski RE. CEST: from basic principles to applications, challenges and opportunities. J Magn Reson 2013;229:155-172.
4. Kim M, Gillen J, Landman BA, Zhou J, van Zijl PC. Water saturation shift referencing (WASSR) for chemical exchange saturation transfer (CEST) experiments. Magn Reson Med 2009;61(6):1441-1450.
5. Chen L, Barker PB, Weiss RG, van Zijl PCM, Xu J. Creatine and phosphocreatine mapping of mouse skeletal muscle by a polynomial and Lorentzian line-shape fitting CEST method. Magn Reson Med 2018.
6. Haris M, Nanga RP, Singh A, Cai K, Kogan F, Hariharan H, Reddy R. Exchange rates of creatine kinase metabolites: feasibility of imaging creatine by chemical exchange saturation transfer MRI. NMR Biomed 2012;25(11):1305-1309.
7. Parasoglou P, Xia D, Chang G, Regatte RR. 3D-mapping of phosphocreatine concentration in the human calf muscle at 7 T: comparison to 3 T. Magn Reson Med 2013;70(6):1619-1625.
8. Nehrke K, Bornert P. DREAM--a novel approach for robust, ultrafast, multislice B(1) mapping. Magn Reson Med 2012;68(5):1517-1526.
9. Fiedler GB, Meyerspeer M, Schmid AI, Goluch S, Schewzow K, Laistler E, Mirzahosseini A, Niess F, Unger E, Wolzt M, Moser E. Localized semi-LASER dynamic (31)P magnetic resonance spectroscopy of the soleus during and following exercise at 7 T. Magma 2015;28(5):493-501.
10. Valkovic L, Chmelik M, Meyerspeer M, Gagoski B, Rodgers CT, Krssak M, Andronesi OC, Trattnig S, Bogner W. Dynamic (31) P-MRSI using spiral spectroscopic imaging can map mitochondrial capacity in muscles of the human calf during plantar flexion exercise at 7 T. NMR Biomed 2016;29(12):1825-1834.
11. Khegai O, Madelin G, Brown R, Parasoglou P. Dynamic phosphocreatine imaging with unlocalized pH assessment of the human lower leg muscle following exercise at 3T. Magn Reson Med 2018;79(2):974-980.
Figures